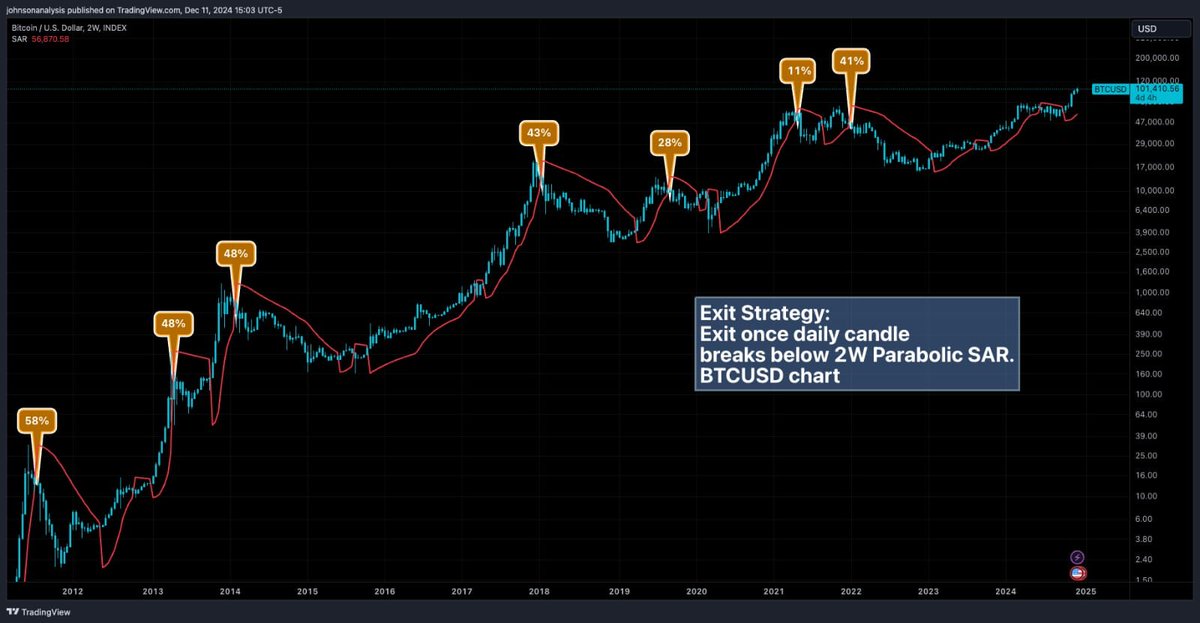
Relationship between BTC, RUT, and Bitcoin Miners
https://t.co/27RKfLpaAs
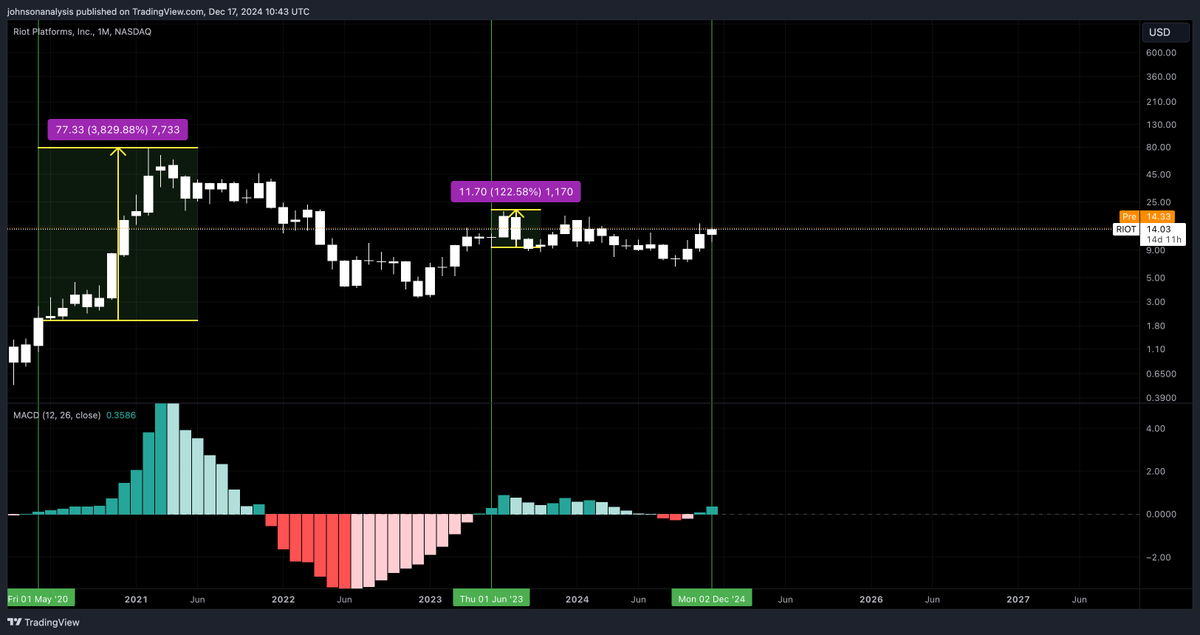
For the bitcoin miners (part of RUT) to blast off, two pre-requisites need to be met:
(1) BTCUSD breaching it’s ATH
(2) RUT breaching it’s ATH
ETHUSD Price Projection using 2W RSI
The past two crypto bull runs, the 2W RSI for ETHUSD has always hit 90.
If it were to hit 90 from these levels, that would put the price at ~$18,745 which would be about a 5x from these levels.
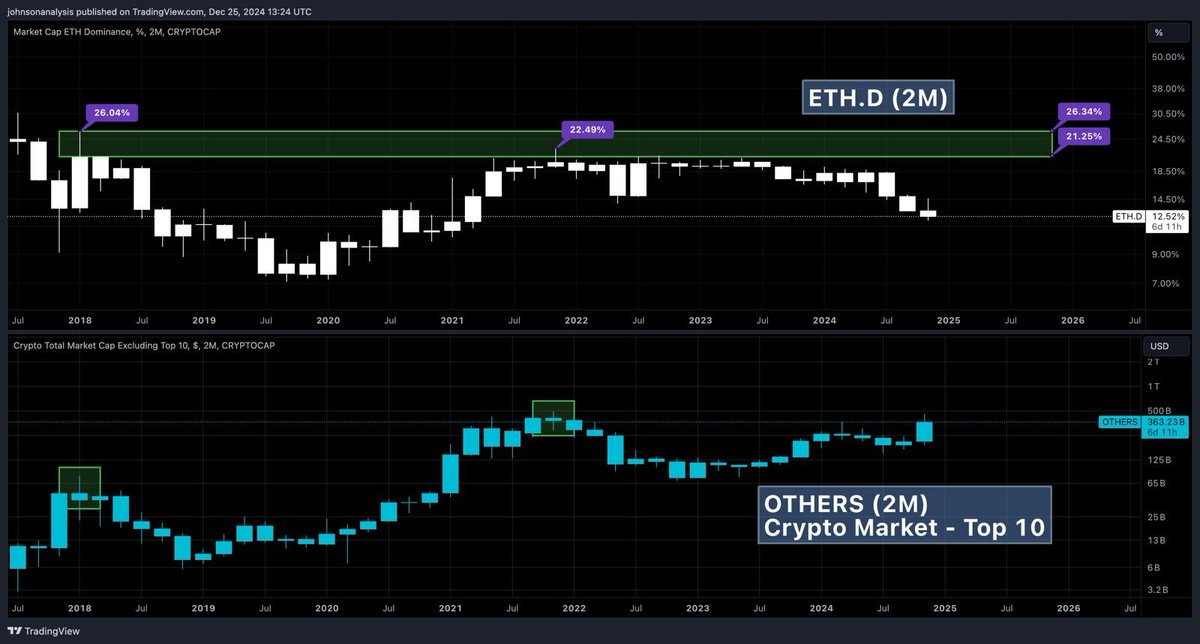
Using ETH.D to exit your altcoin positions near the top
ETH.D breaching 21% and peaking has historically (2 crypto bull runs) coincided with peak euphoria in the altcoin space.
This is another useful metric to keep an eye out for as ETH is the king of the altcoins.
Using ETH.D to time exit for your ETH
https://t.co/Rc3n2hrxFA
As you can see, the past two crypto bull runs, when ETH.D breached the 21% level, that was the most ideal time to exit out of your ETH positions.
Just something to keep in mind
Fed Funds Rate and Unemployment rate is eerily similar to around the 2000 stock market top.
Russel-2000 (index of micro/mid-cap stocks) has been diverging away from Nasdaq-100.
This same divergence took place prior the 2000 stock market peak.
In a stock market bull run, small-cap stocks in the Russell 2000 typically hit new all-time highs and enter price discovery only in the later stages. When this index breaks past its previous high, it’s a clear warning sign that the market has entered a euphoric phase.
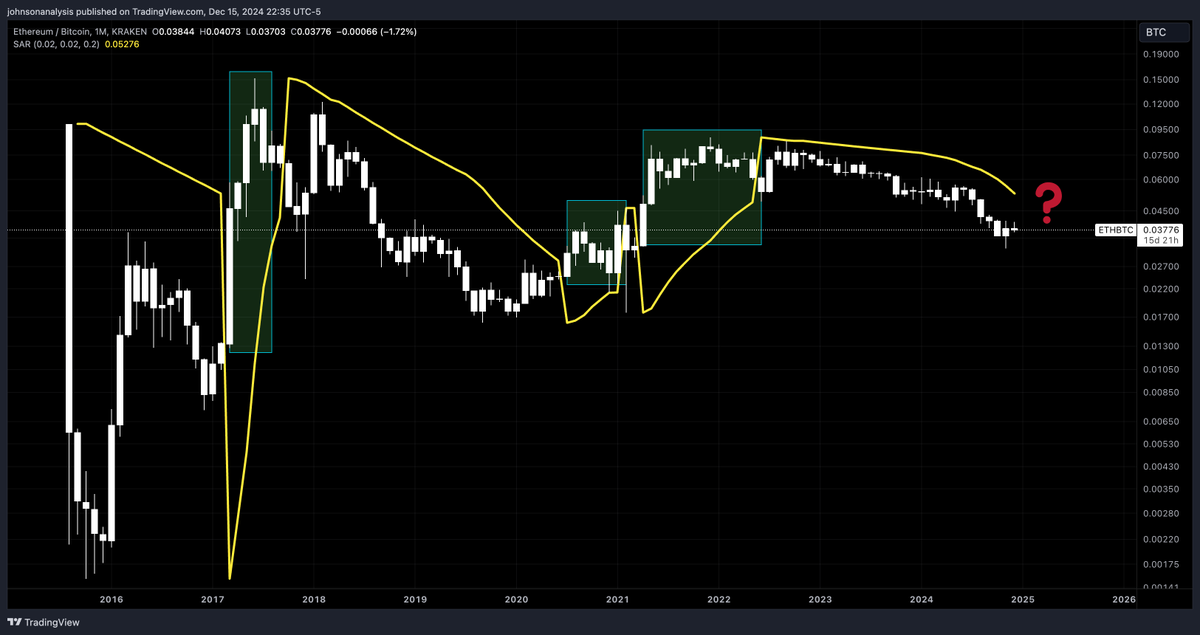
BTC.D (1M) Parabolic SAR vs ETHUSD (1M)
• 6 days to fully confirm this BTC.D 1M Candle close below it’s 1M Parabolic SAR. This has historically acted as a bear trend confirmation signal for the BTC.D.
• BTC.D breakdown has coincided with ETHUSD/ETHUBTC going up
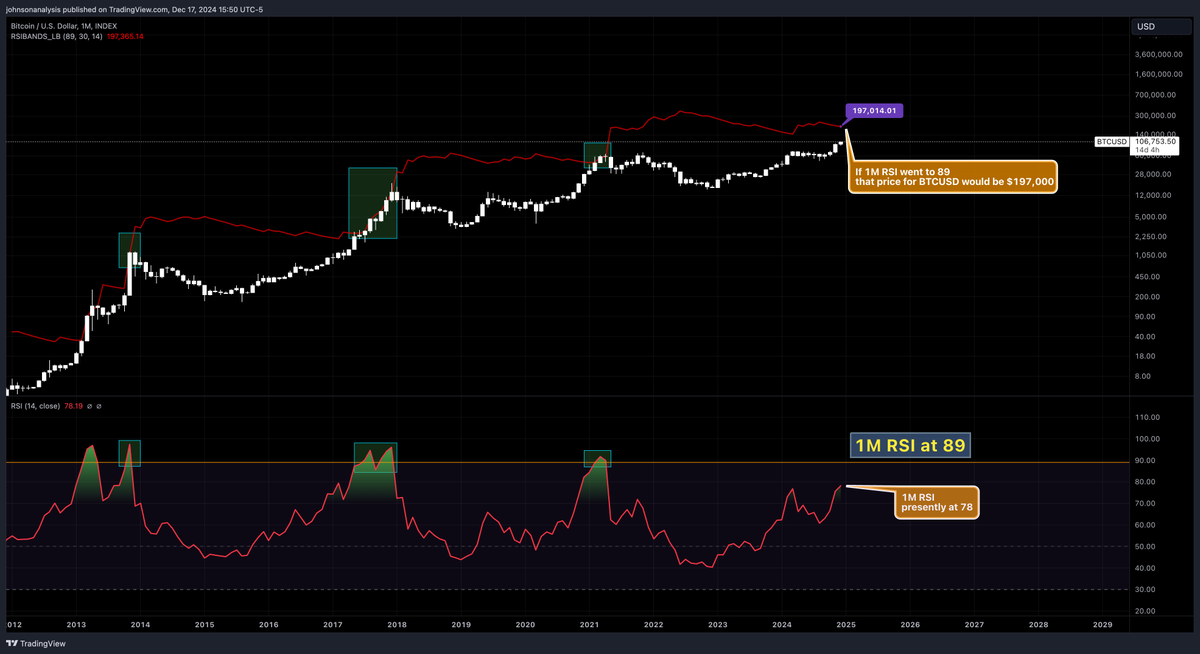
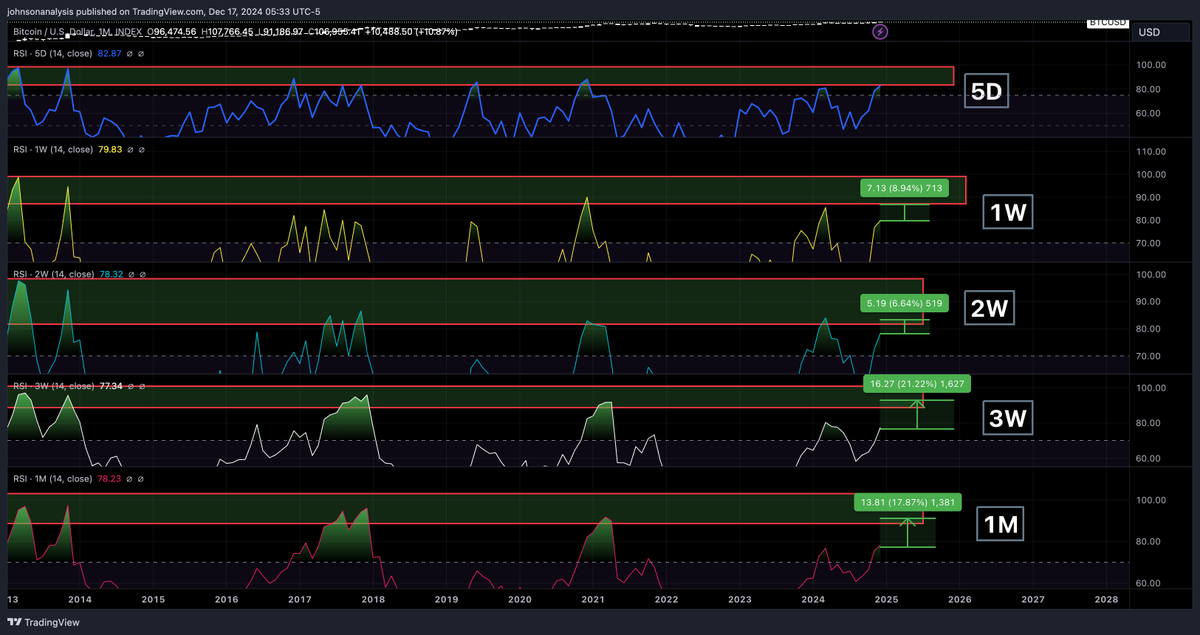
@Washigorira Projecting BTCUSD Bull Cycle Peak using RSI Bands
• The red line shows the price needed for the 1M RSI to hit 89, currently at 78. For RSI to reach 89, BTC must rise to $197,000. Historically, 89 has always been reached, making it the projected target.
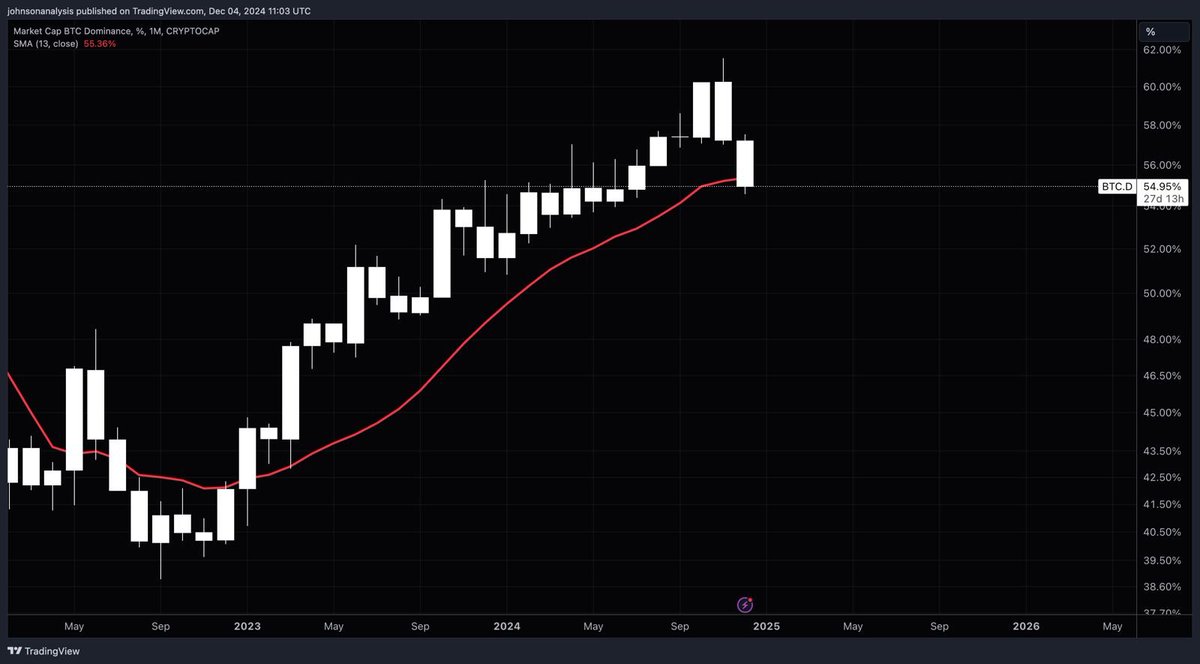
This is why the 13 Month SMA breakdown for BTC.D is so important. As you can see, this breakdown has coincided with the altcoin market going beast mode.
The bottom chart represents BTC.D.
The Yellow Boxes illustrate when the SMA breakdowns occured. As you can see, BTC.D has been above the 13 Month SMA for years. But, this is soon to change :)
@ColinTCrypto haha yup, here are the final things I'm looking for:
(1) BTC.D monthly breaks and successfully closes below it's 13 month simple moving average. Will need to wait until the end of the month for this to fully confirm.
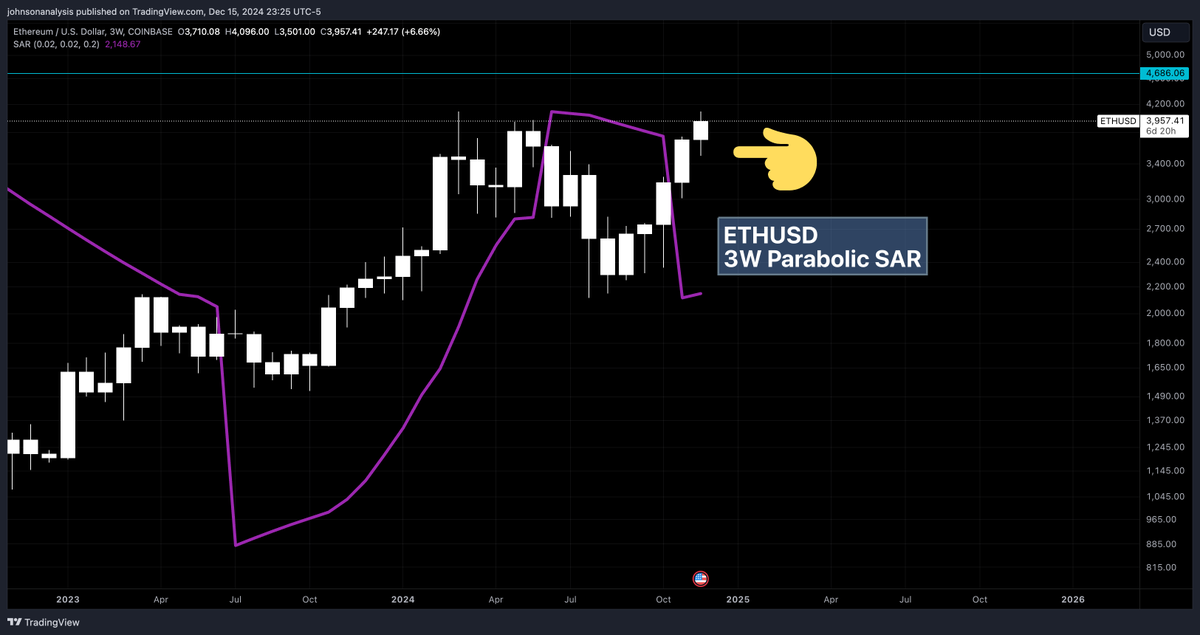
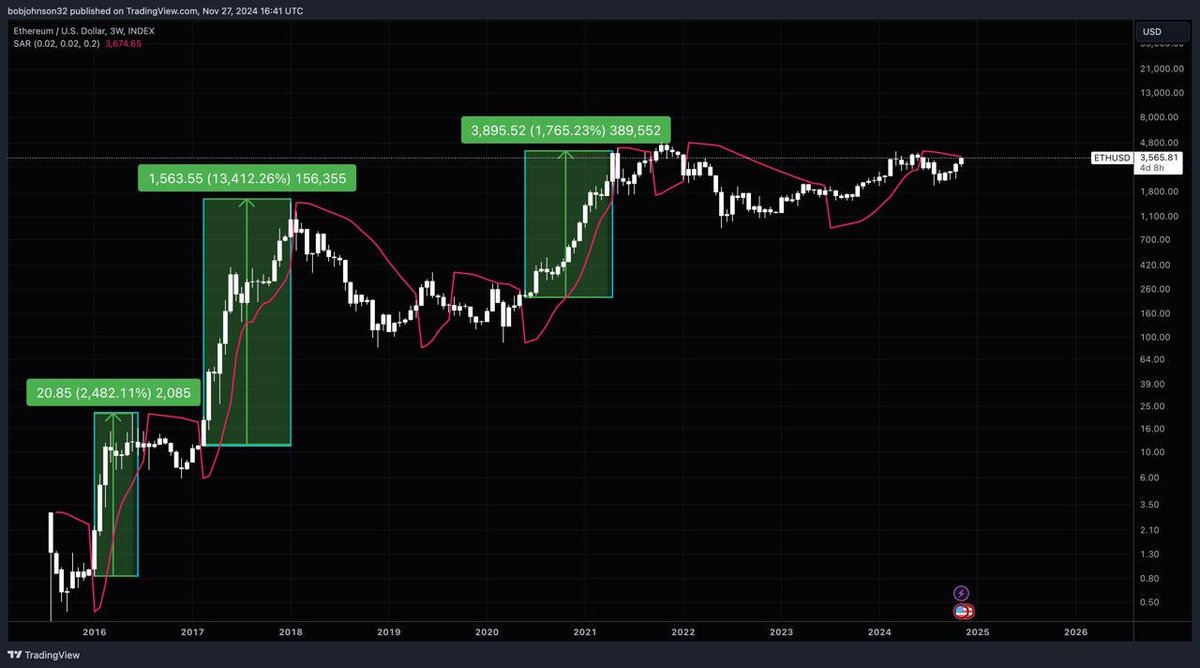
@ColinTCrypto This is by far the most important signal that has already confirmed IMHO for ETHUSD. A break above it's 3W Parabolic SAR. Green boxes illustrate how this signal leads to thousands of percentage gains in crypto bull markets.