In 2023 BTC printed a sharp Thursday sell-off with wicks below the blue zone.
This Thursday we printed wicks below it again, last wick at the exact same time as in 2023.
If the pattern repeats this way, $87,000 looks next to me, followed by a drop into October.
This thesis would only be confirmed if there is no rejection in the $83,000 range.
A sweep of $75.5k is still on the table.
That’s where I’d look to add to my longs.
Since this is a high-timeframe (1W) pattern, delays or deviations may occur on lower timeframes than 1W.
It doesn't necessarily mean it has to happen again!
bitcoin:native
I am very confident that Bitcoin will rise rather than fall.
The bear market is over, so it is advisable to take every dip seriously when it comes to long-term investments.
I still expect September to be bullish rather than bearish.
The $85,000 to $87,000 range will be reached soon.
I bought more Bitcoin and Ethereum today!
In 2023, when Bitcoin topped (green circle), the 5D chart showed wick gaps between candles of no more than 1%.
I expected that move for Monday.
The difference this time, we had a weekend, in 2023 we didn’t.
The stock market was closed on Monday, so I was expecting a 3-day delay.
Since this is a high-timeframe (1W) pattern, delays or deviations may occur on lower timeframes than 1W.
It doesn't necessarily mean it has to happen again!
As soon as Bitcoin loses the area around $76,777, I’m targeting levels between $73,880 and $75,300.
bitcoin:native
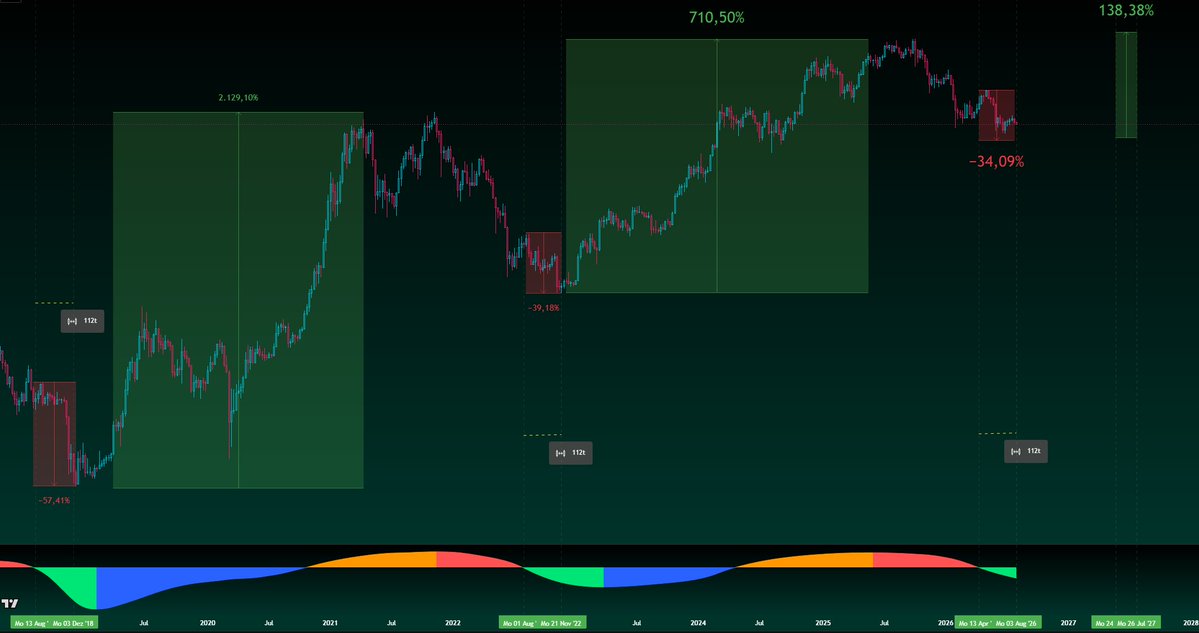
According to this outstanding setup, we could see the final bottom anytime between 3.8.2026 and a one-week delay.
My analysis claims that 112 days after we turned from red to green on the Bitcoin Journey Map, the absolute cycle bottom was formed.
This has happened in every cycle.
The bear journey is over soon.
We are about to see a bull run that will melt faces.
Many people will get front-run while they wait for sub $40k!
I’m not ruling out that it could happen, but a drop below $40k would need something similar to the COVID & FTX crash.
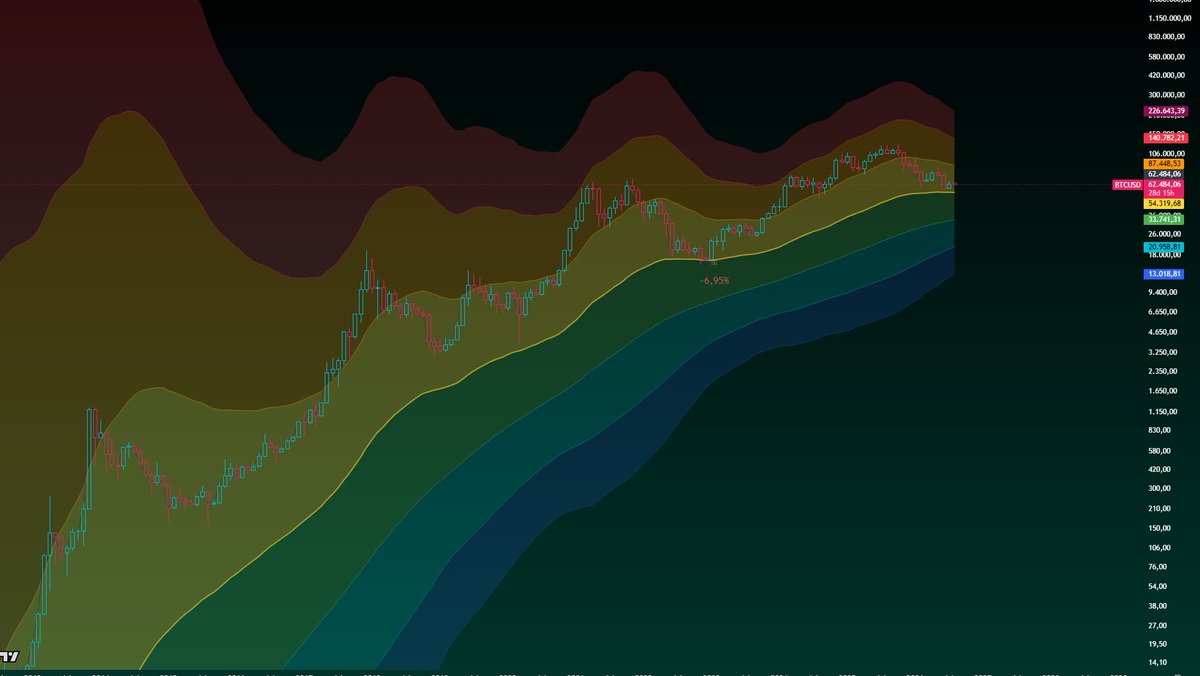
Check out the second picture!
“In the entire history of Bitcoin, the price has fallen below the yellow zone only once, and that was due to a historic event, the coronavirus pandemic & FTX crash.”
See you in 2027, when we hit a new all-time high.
📢GM fellas and happy #MomentumMonday to y'all. Before we are diving into today's four top charts, I would like to briefly remind you of my first raffle which is set as soon as I hit 5k followers. Make sure to check out the post attached below to participate in it!
⚠️Alright then, quick little update on my very unique indicators provided for you, make sure to lean back and enjoy! Ready? Let's do this:
1) The BTC Cipher has clearly and remarkably confirmed the bitcoin:native cycle bottom yet again correctly. Against all "BoTtOM's iN oCToBEr" guys, it has again remained true and offered a perfect spot long term entry for everyone who listened back when my buddy @xapa03 and I were calling for the bottom to be in. Did you listen? 💁
Nevertheless, the next important shift in BTC Cipher is about to be happening soon. The cross-up above the white line signals "momentum kicking in". When the BTC Cipher will have crossed above this threshold, the bitcoin:native bull will be in full motion and in retrospective, on average bitcoin:native had always had a +89% move within an average time of about ~200ish days from the deepest bottom price to the phase shift. This would correspond with an approximate bitcoin:native price of $109k in Q1/Q2 2027, likely March or April - as soon as we break above the white threshold and enter "momentum kicking in"-mode. 🚀
2) Great Falls Oscillator strongly consolidating and preparing for its momentum trailing level (orange) to come down further to eventually cross and confirm the bull market shift. 🪨
3) Sir Ronald Aylmer Fisher Transformation Index has broken ABOVE the red threshold marking the final regime change and thus confirming the bear to be over and the cycle bottom to be in, after its momentum oscillator (orange) has preceeded this call.☎️
4) Root Mean Square Energy/Liquidity Algorithm has boldly consolidating its cross below the red momentum line and the cycle bottom confirmation. This indicator remains to be seen as a super slow but pretty impressively accurate model. We will have to wait a long time for the next phase, which is "Seat belts on?". Until then, we will monitor closely and as always, I will let you know about all changes. 🔃
Have a blessed new week in Bitcoin and stay safe at the Frontier. If you need anything, just reach out to me, Sheriff's here to help.🤠
Take care
I'm often asked where I'd best open my long.
I point to the pattern, it's played out perfectly so far.
According to the pattern, this week could start bullish and then drop toward $73k.
I see Bitcoin falling toward $73k–$75k over the next two weeks.
I'll start scaling in from $75k with a max of 20% to avoid getting front-run.
I expect a pump to $86k once Bitcoin reaches the $73k���$75k target.
My largest order will be at $67.5k.
You can see the Ichimoku Cycle Engine in the video, and you'll also recognize the similar behavioral pattern from 2023.
the genius behind every indicator i am using is my brother
https://t.co/Q7leQj5tEB
Follow him, he deserves it!
bitcoin:native
Every time the DSS Bressert crossed up on the 4-day timeframe, a big pump followed.
Bitcoin hit its lowest price in November 2022.
On the 4-day chart it took almost 53 days for the DSS Bressert to make a bullish crossover.
After that Bitcoin pumped hard.
The DSS Bressert is near the capitulation level (the red line).
The bullish crossover started from there.
That is why I show this example.
I already showed in several threads with other indicators that Bitcoin has bottomed.
The current behavior looks a lot like 2019 and 2022.
Here I focus only on the 2022/2023 period.
Even the slightest correction should be taken seriously when it comes to long-term investments.
bitcoin:native
Dear bears, the bear market is over and the bottom is in.
Back in May I publicly called the bottom for July 1st.
Let me show you a clear video that probably won’t improve your mood.
Stay stubbornly on the sidelines if you want.
Calling $62,200 as the final low. ⌛️
New all time high by 2027. ⌛️
We’re in the early stage of a bull run.🖐️
When the TEM wick printed (marked with the circle), it took 147 days until Bitcoin put in its final low.
In 2022 the price difference between the 147-day and 161-day mark was less than 1%, even with the FTX crash and the lingering corona pandemic effects.
The Bitcoin Journey Map shows that once 112 days had passed, the final bottom was in and that price zone was NEVER touched again.
That means we never see $62,200 again unless a real black swan hits.
That’s now what most of you bears are betting on, because the original plan didn’t work out.
The exact same pattern is playing out right now.
the genius behind these masterpieces is
he deserves every follower, the content he puts out is next-level
@thebtcfrontierX
bitcoin:native
Bitcoin held the support perfectly at the Ichimoku cycle engine on the 8-hour timeframe.
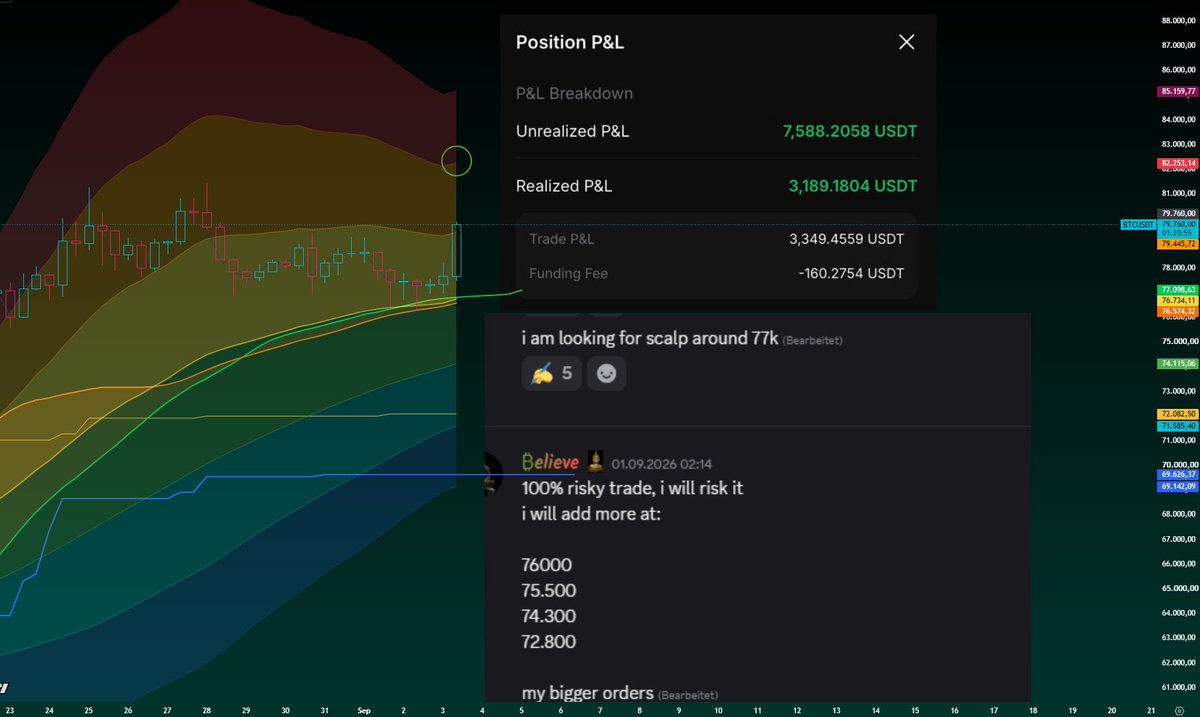
I am always trading, what i am posting.
Another trade, another win. ✅
Only scalps, very quick entries and exits, until I’ve built up my swing position.
Full tp around 81-82 or breakeven 🤡
Join our discord to not miss any live trades.
https://t.co/6atyr1dSg7
bitcoin:native
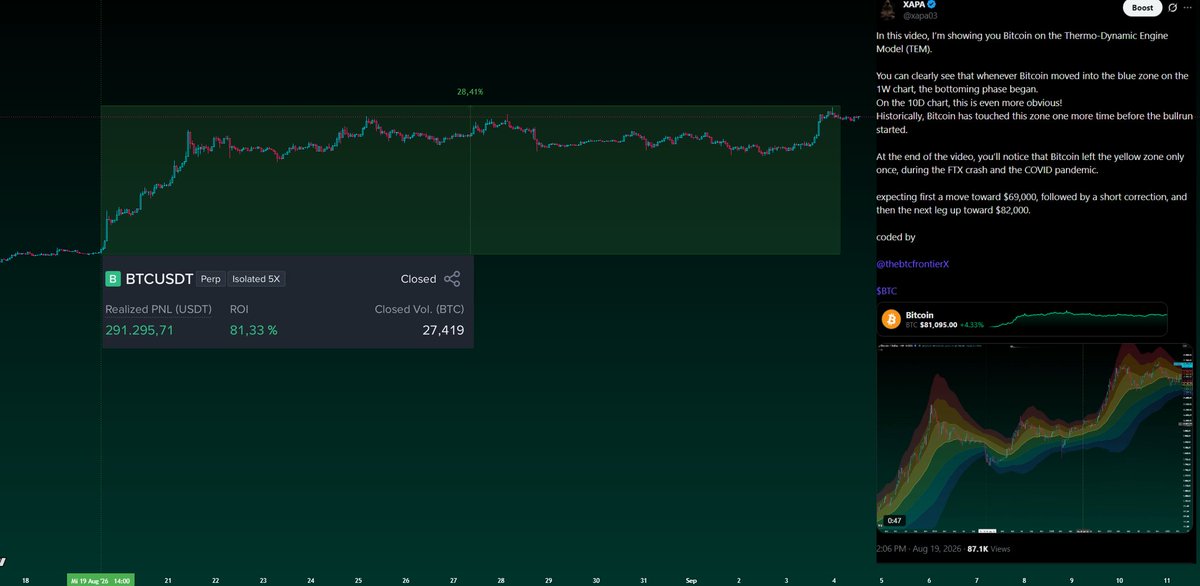
I called that breakout first and gave you a clear reason why we would see $82,000 very fast.
If you look closely, after Bitcoin hit $69,000 it only had a very small correction, then it went straight to $82,000.
Check my previous calls.
The timing has always been perfect.
Don’t miss any live trades. Join our Discord:
https://t.co/svEoqDjrxT
bitcoin:native
Whenever the Paranoia Indicator goes into the red zone on the 12-hour timeframe, a correction has followed.
We’ve either dropped right around the moment the black bar entered the red zone, or we’ve been stuck in the overheated zone for multiple days, which then causes the black bar on higher timeframes to slide into the red area as well.
I said Bitcoin would reject around 82,000 and it did.
Now I’m watching for new scalp entries.
Do not miss anything and join XAPA's World
https://t.co/svEoqDjrxT
The Paranoia Indicator shows me the perfect long entries and the perfect exits.
The brilliant genius behind that indicator is my brother
@thebtcfrontierX
He deserves every follower.
Make sure to follow him.
bitcoin:native
I’ve shown this pattern many times from different angles. Today, for the first time, it really hit me how insanely precise the percentage moves repeat on a weekly basis.
This time without any indicators, purely from the UTXO Cross perspective.
Measured from the TEM wick, Bitcoin put in a 36% pump between day 210 and 224.
November $100,000+ if Bitcoin keeps repeating it the same way it has until now.
holy bull.. 🐂
In June 2022, Bitcoin found its first low, only to form almost its final low 147 days later (on the weekly chart). At that time we were still in the Corona pandemic. Bitcoin fell by a maximum of 0.68% within two weeks to reach its "final" bottom.
On November 9, 2022, the UTXO age bands cross occurred, a signal that has historically always predicted Bitcoin’s final bottom.
After the final bottom we could observe Bitcoin moving sideways to the upside for three weeks, followed by three weeks of sideways movement to the downside. However, the bottom had already been formed.
After these three weeks the Bitcoin bull run began.
bitcoin:native