Today is the International Day of Women and Girls in Science ! Let’s celebrate with this periodic table those who demonstrated, calculated,observed, discovered and ultimately prove wrong those who say women don’t belong in science @UNESCO@4womeninscience#WomenInScience
Categorical color. When using color to establish categories, the goal is simple: to distinguish one thing (or group of things) from another. This is easiest when there are few categories and it becomes increasingly untenable the more you have. 1/8
from: https://t.co/eNp8SwTXF3
Good design is emotional design. We associate good feelings with brands that speak to us at all levels and keep the magic of pleasurable, seamless experiences alive.
#Tableau Superstore data in a new guise.
Viz: https://t.co/JhtTBvPDpg
Since nov., I ve been working for INSEP [a public institution which is one of the largest inter. Olympic training center], for a sport 𝐝𝐚𝐭𝐚𝐯𝐢𝐳 𝐞𝐱𝐡𝐢𝐛𝐢𝐭𝐢𝐨𝐧 at the Palais des Congrès during ECSS with brilliant people! Are you coming on July 4th? Admission is free!
Can't make it to #TC23 but still want to be part of @DSuffragettes’s interactive scatter plot? We've got you covered.
Join the community by adding your own data point to the springtime prompt! 📈🌸
https://t.co/dAiMkWqom2
Merci 2022🎤🎤🎤🎤🎤 +🖼️🖼️
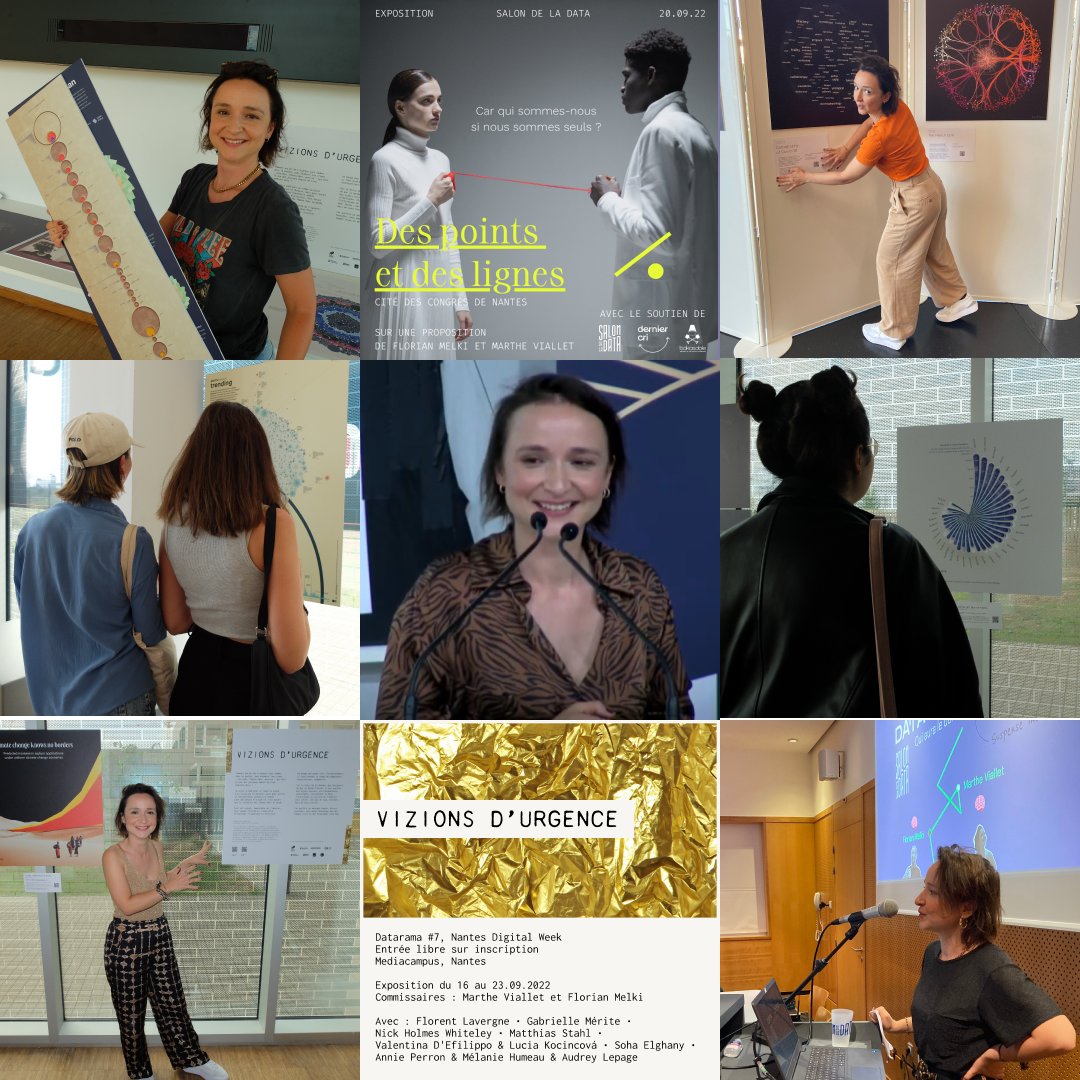
5 conférences données à @INSEP_PARIS, la @dgfip_officiel, le @Web2day, le @Salon de la Data, et et à @Tls_dataviz et 2 expos de dataviz pour le Salon de la Data sur la visualisation des réseaux, à Datarama sur l'urgence sociale et environnementale ✨
And we conclude with @MartheViallet who likes to see data in a different way and can't wait to read this newly released book [thanks to @PickMeUpAL ✨] | @cybunk, @tillnm, Lora Oehlberg, Wesley Willett
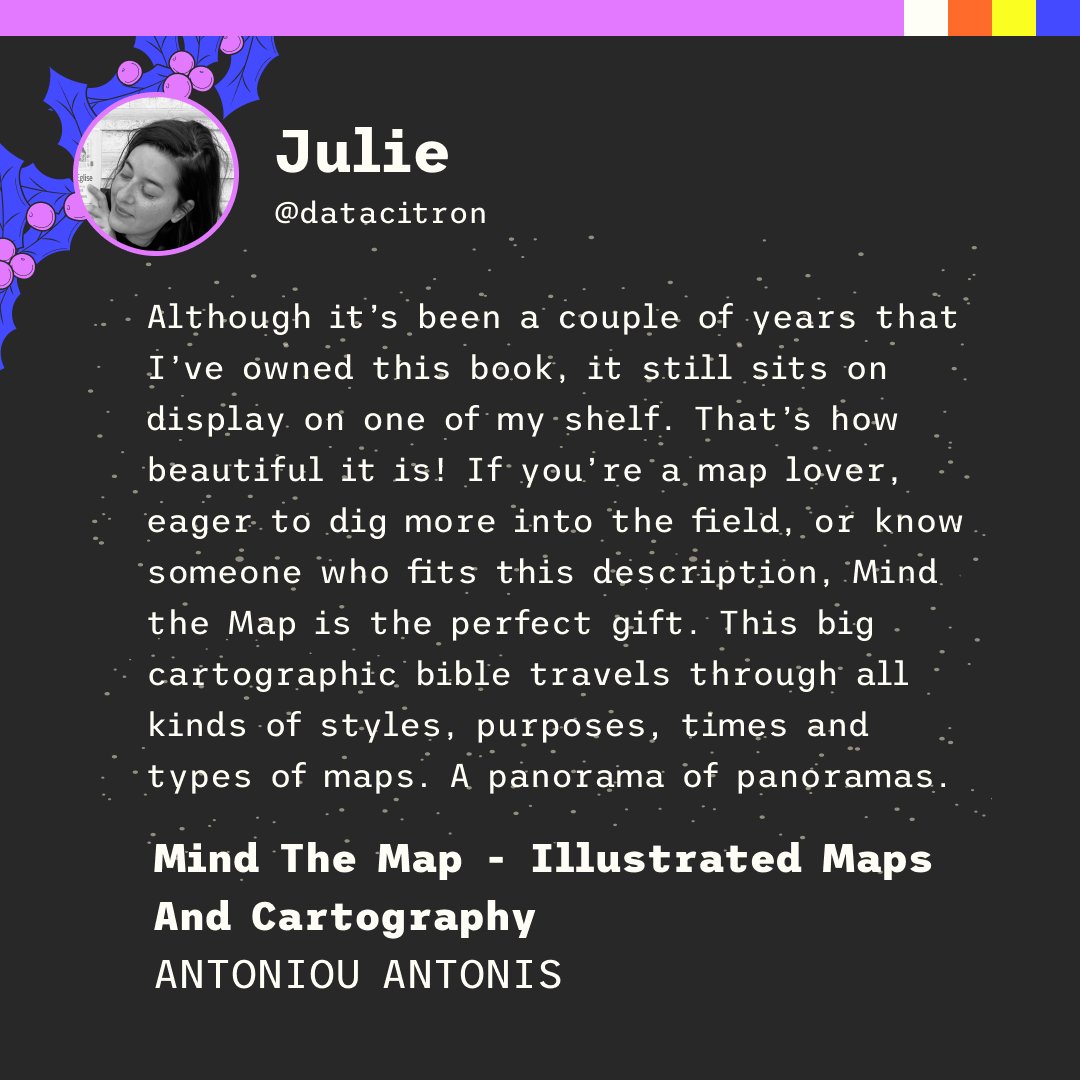
Maps just hit different, right? You look at them and you enter a new space. That's why for her recommendation, our zesty DataSuffragette Julie, aka @datacitron, chose a cartographic book 🗺️
I don't even know when I had free time to create something for myself. I am completely blown away by Valerio Pellegrini's latest work. I thought let's make it in Tableau. I love the curvy gradient trends.
https://t.co/B3vmc9shzy
Setting up of the dataviz ✨EXHIBITION✨ in progress 💪🏼🖼📊 ! With @FloDataviz • Vizions of émergency • Datarama 7 • Mediacampus • @NantesDigitalW • @Media_designlab @audencia_com …


![DSuffragettes's tweet photo. And we conclude with @MartheViallet who likes to see data in a different way and can't wait to read this newly released book [thanks to @PickMeUpAL ✨] | @cybunk, @tillnm, Lora Oehlberg, Wesley Willett https://t.co/KGElWxOuAk](https://pbs.twimg.com/media/FkgkqYIagAIj1L_.jpg)
![DSuffragettes's tweet photo. And we conclude with @MartheViallet who likes to see data in a different way and can't wait to read this newly released book [thanks to @PickMeUpAL ✨] | @cybunk, @tillnm, Lora Oehlberg, Wesley Willett https://t.co/KGElWxOuAk](https://pbs.twimg.com/media/FkgkqV1agAAJW42.jpg)