If yall want I can dig up all the no news Mondays I have documented on the week of CPI & then you’ll believe me 😅
Pictures below are TWO separate no news Mondays on CPI week.
As always I am only sharing this information to HELP you.
Put this in your notes for next time 🤝
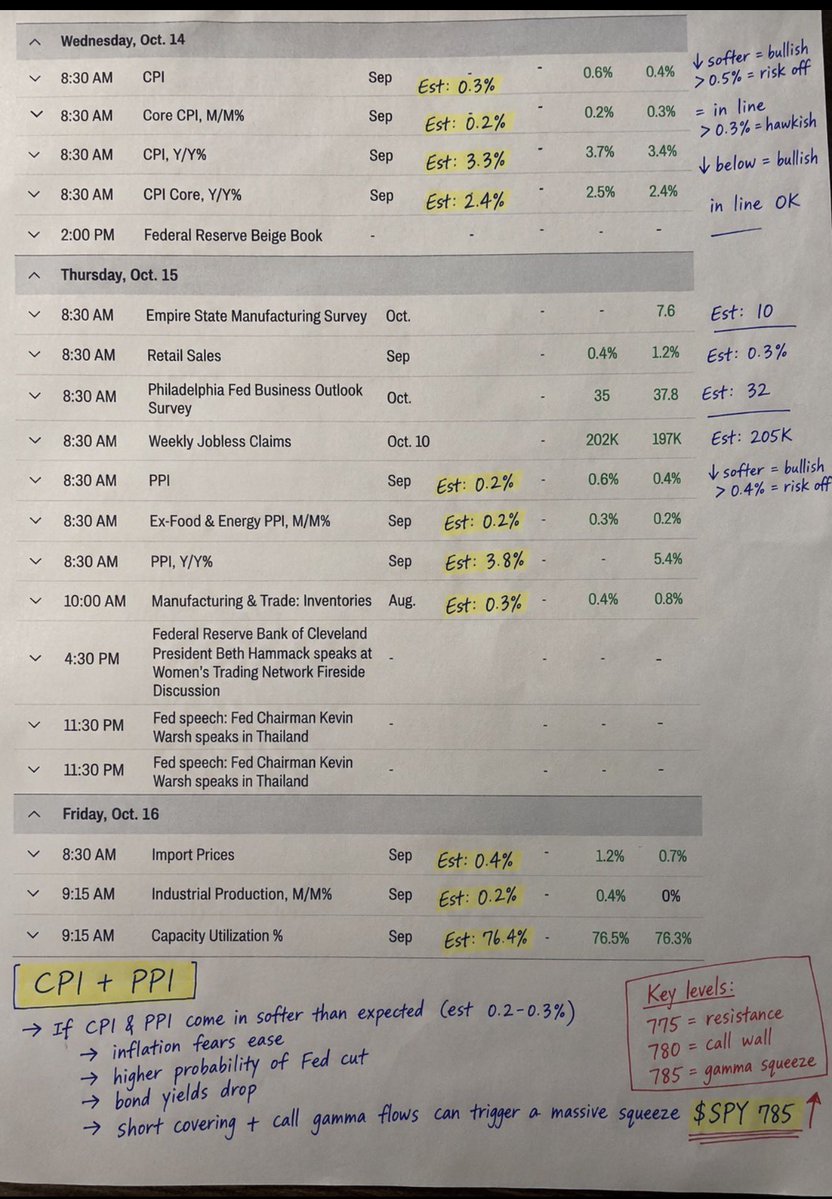
BIG WEEK FOR $SPY!
CPI Wednesday.
PPI Thursday.
Two massive inflation catalysts.
I'm anticipating softer inflation numbers, potentially fueling expectations for Fed rate cuts for Oct 28.
If CPI and PPI surprise to the downside, we could see a MASSIVE gamma squeeze pushing $SPY toward $785!
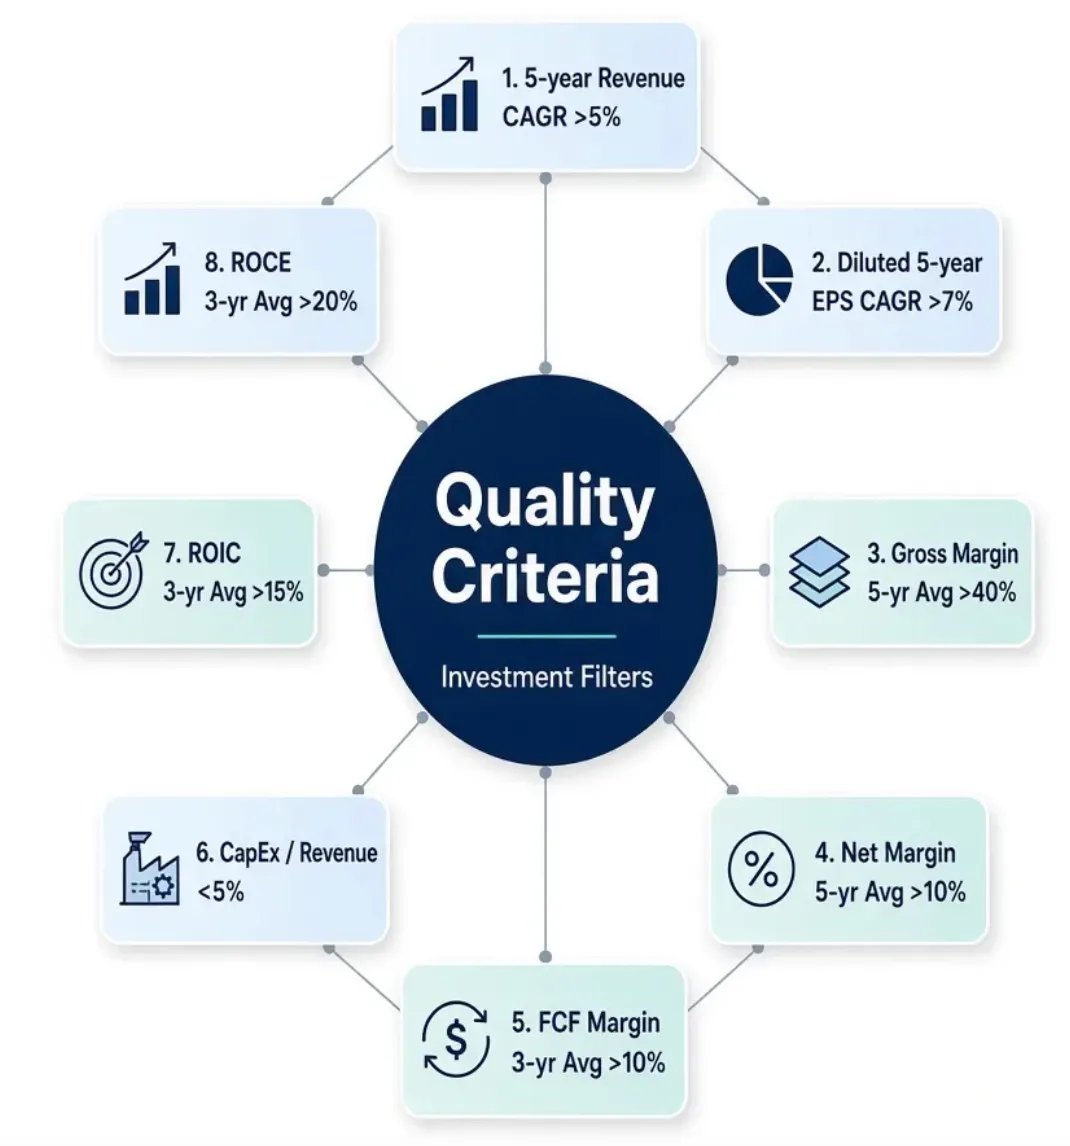
Here is the BEST stock screener
Save it. You will use this forever.
It found names BEFORE they run like $SPCX $MRNA and $HIMS
My secret behind my $100K Months
Posted below. Just put it into Finviz.
"Pay a trading guru $2,000 to teach you a strategy"
No mf
I learned the same strategy for free on YouTube while you're paying some guy in a rented Lamborghini to teach you basic supply and demand
Here's the strategy most $2,000 courses teach. I'm giving it to you for $0 right now:
Step 1: Open a chart of NQ (Nasdaq futures) on TradingView. Set it to the daily and then 4 hour timeframe. This is free
Step 2: Before the market opens at 9:30am, mark the previous day's high and previous day's low. These are your external liquidity pools. Institutions need to raid these levels to fill their orders. Draw a horizontal line at each one
Step 3: Also mark any fair value gaps and order blocks from the 4 hour/1hour chart. FVGs are inefficiencies price left behind during aggressive moves. Order blocks are the last opposing candle before a displacement. These are your internal delivery targets. When price returns to these areas, it tends to react
Step 4: Wait for the market to open at 9:30am. In the first 5-15 minutes, price will spike aggressively in one direction. This is the liquidity raid. The market maker is pushing price into stop losses to fill institutional orders. Just watch
Step 5: Wait for the sweep. Price will push past the previous day's high or low, or internal/external liquidity levels (one of the levels you marked). This raid triggers thousands of stop losses. Liquidity gets grabbed. This is your signal that the move is almost done
Step 6: Wait for displacement. After the sweep, look for a large aggressive candle in the OPPOSITE direction. This candle should have a full body with minimal wicks and leave a fair value gap behind it. It tells you the market maker model is now delivering price the other way. The real move is starting
Step 7: Enter on the pullback. After the displacement candle, price will retrace back into the FVG or order block it left behind on the LTF. Enter on this retracement. Your stop loss goes behind the sweep high/low. Your take profit goes at the next liquidity level in the direction of displacement. Minimum 1:2 R:R, ideally 1:3 or more
Step 8: Set your stop loss. Set your take profit. Walk away. Don't watch. Don't move anything. Let it play out
That's it. That's a $2,000 course in one tweet. Liquidity sweep into displacement into pullback entry. It works because institutional behavior is structural and repeating. They sweep liquidity every single morning because that is how the market moves. This isn't a pattern that "might" appear. It appears everyday on every timeframe
Now here's what the course won't tell you: knowing the strategy isn't enough. You need to PRACTICE it 500+ times on a free demo account before risking real money. The strategy is simple to understand and difficult to execute because your emotions will constantly try to make you enter too early, exit too soon, or skip the setup entirely
The $2,000 course gives you the same information I just gave you. Then they put you in a Discord where you ask questions and get vague answers. The education took 10 minutes. The other $1,990 bought you access to a group chat
Save your money. Watch YouTube for the visual explanations. Practice on a free demo. Journal every trade. After 500 trades you'll know this strategy better than the guru who sold the course
The information has always been free. The discipline to practice it has always been the hard part. No course solves the discipline problem. Only you solve that by showing up every morning and doing the reps
I teach this exact strategy with live examples inside my free Discord. You watch me execute it every morning in real time. No course fee. Just live execution and community
Free access in bio. Come learn how to make your first $10,000/month trading
#TNX $TNX
In the last 25 years, there has been 6 instances of 6 or more consecutive weekly up-closes in 10-year Treasury yields.
Each advance was subsequently followed by months of large drawdowns in #Rates.
#Yields are now on track for 9 consecutive weekly up-closes. At the same time, #TNX is registering a 79 "overbought" reading in the weekly Relative Strength Index (RSI).
Will history rhyme?
*Past performance is no guarantee of future results
*Schwab does not recommend the use of technical analysis as a sole means of investment research
*All names and market data shown below are for illustrative purposes only and are not a recommendation, offer to sell, or a solicitation of an offer to buy any security
*Chart source: thinkorswim
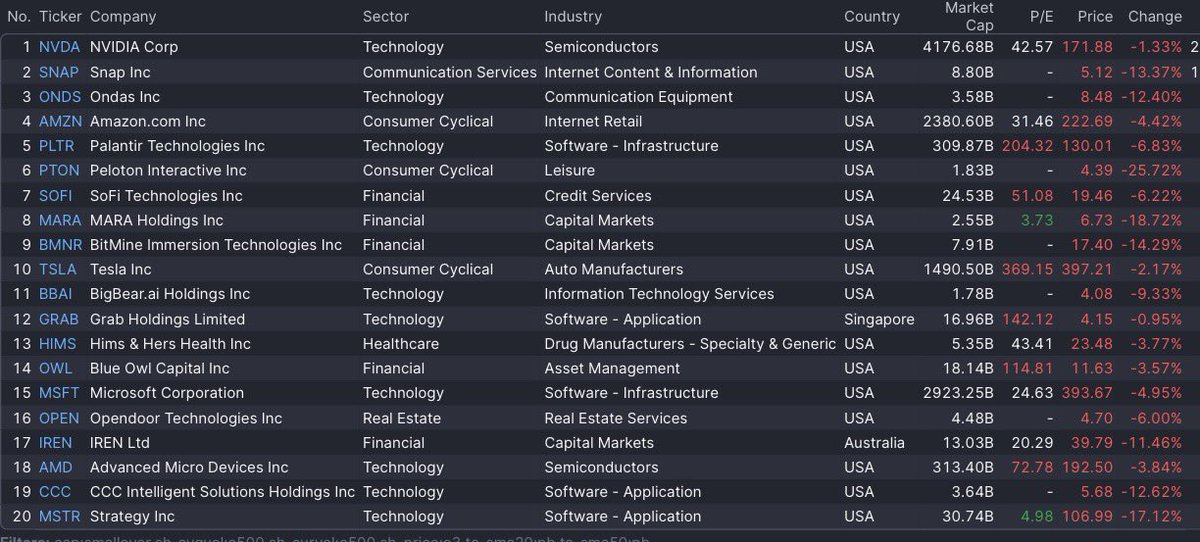
I HAVE THE BEST DOWNSIDE MOMENTUM STOCK SCANNER
It caught the top shorts today:
$MSTR $PLTR $HIMS $HOOD $SOFI $IREN
❤️ RT + Commnet “Banks” and I will send you the link
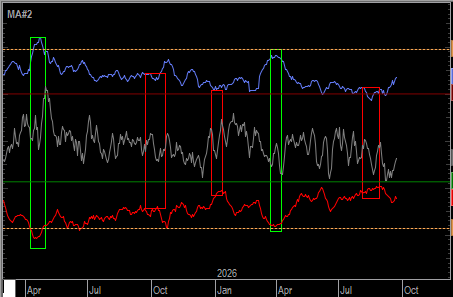
My longer term timing indicator, (which I have been updating monthly), is a long ways away from a Buy (buy shares for your investment portfolio). It has remained in high risk/liquidation mode since the middle of August.
@Mr_Derivatives I tried to eat a Big Mac about a year ago.. it was terrible. The lettuce was cut so small it was just falling out all over the place. I ended up putting it in the trash and buying something more edible from Burger King
A fired Goldman Sachs quant trader taught me everything in a single conversation
He said: “We don’t do predictions. We only buy contracts where the price deviation exceeds 6%.”
It’s just that simple
That’s the desk operation for a $2 million annual salary
I fed his explanation and 5 GitHub repos into Claude, and Claude built a scanner. It processes over 400 markets every hour
This scanner can find those contracts priced in the 7-19c range, with true probabilities between 60-90%
At these entry points, you need a win rate of 1/4
And this bot’s win rate is 81%
Three months later:
From $2,000 to $8,191
99 trades, Sharpe ratio 2.30
A few cases:
ETH Merge upgrade - market 72c, true probability 88%, +19c
SOL breaks $200 - market 44c, true probability 81%, +15c
Florida hurricane cat3+ - market 81c, true probability 92%, +7c
Wheat breaks $800 - market 53c, true probability 68%, +20c
All of these were found by the scanner, and all were profitable
He looked at my terminal last week
He said: “This is what we do with $800M, 47-person team.”
And my current setup costs $25 per month
Claude - $20
VPS - $5
Repos - free
API - free
Now there are 8 agents running 24/7:
velvet_void +$697
nano_alpha +$541
ratking_eth +$407
darkpool_7 +$356
His fund returned 19% last year
And my setup returned 409% in three months
The real edge was never any secret—it’s just always been expensive, until now
70% win rate, 7 wallets copytrading rn from ~500 monitored, bot never paused, never gambling, just math and profit
Giving This Free for 24 hours. To get it:
1. Comment the word 'CLAUDE'
2. Like and Retweet this post
3. Follow me @tec_marco10 (so i can DM you)
[The Art of DCA]
Surviving a -$2,250 drawdown to close +$1,000 net.
This is the trade retail never posts.
When high-momentum stocks break down, rigid traders either blow up or panic-sell the absolute bottom. A weighted grid does the opposite: it aggressively weights the bottom tiers to drag your breakeven into the dirt.
$HIMS Execution Breakdown:
Pyramid Accumulation (4 Tiers):
- Entry 1 & 2: 50 sh @ ~$32 + 50 sh @ ~$28 (Initial probes: 100 sh)
- Bloodbath Heavy Adds: 150 sh @ ~$18.50 + 100 sh @ ~$15.00
Total Position: 350 shares ($7,201.75 basis)
Max Adverse Excursion (MAE): -$2,250.25 (stock cratered -57% from peak down to $13.74)
Net Avg Entry: Sunk all the way down from $32 to $20.58
Scaled Exit: Closed 350 shares (252 + 98) @ $23.50
Result: +$1,015.30 net (+14.1%)
Look at that chart: $HIMS never came close to retesting the original $32 entry.
It didn't have to.
By scaling 250 of the 350 shares near capitulation ($15–$18), a modest dead-cat bounce to $23.50 locked in a 4-figure net profit.
Position sizing isn't just risk management. It's an offensive weapon
The two clocks of investing
The market has two clocks, and I think most investors spend far too much time watching the wrong one. The first clock measures the stock price, it moves every second, and constantly creates the feeling that something important must have changed.
The second clock measures the business, customers gained, products improved, market share taken, cash generated, competitive advantages widened. This clock moves much more slowly, and on most days it barely appears to move at all.
What makes investing so psychologically difficult is that these two clocks can disagree for years. A stock can fall 50% while the business becomes more valuable, and a stock can triple while the business becomes worse.
That means price is not always measuring progress. Sometimes it is measuring how investors currently feel about future progress, and feelings can change in 5 minutes while competitive advantages, earning power and intrinsic value usually cannot.
I think this misunderstanding also leads people into one of the weakest strategies in investing, constantly trading the first clock. They buy something at $100, sell it at $103, congratulate themselves on a successful trade, and feel as though they accomplished something.
Maybe they made a few dollars, but economically they accomplished very little. If your goal is to build serious wealth, particularly when you are starting without much capital, clipping tiny gains and repeatedly jumping from stock to stock is an extraordinarily difficult strategy.
The math of wealth becomes powerful when time begins working on increasingly larger amounts of capital. A 20% return on $10k makes you $2k, but eventually that same return on $1m creates $200k, and on $10m it creates $2m. The percentage did not become more impressive, the base did.
That is the part people underestimate. Compounding looks almost boring in the beginning because the numbers are small, then somewhere along the journey the mathematics becomes almost absurd.
This is why selling a wonderful business simply because the stock moved from $100 to $110 can be such an expensive habit. You may celebrate the $10 gain while unknowingly giving up the possibility of owning something that eventually goes from $100 to $500, $1,000 or far beyond.
Great investing is not about maximizing the number of times you can say, “I made money on that trade.” It is about maximizing what your capital can eventually become.
There is another psychological trap. When a stock falls long enough, your brain starts rewriting the business story to match the price, and instead of asking, “Has the business actually changed?” you start wondering, “How could I possibly be right if the stock keeps falling?”
The opposite is even more dangerous. A rising stock can make weak analysis feel brilliant, because the market can reward you before you deserve it just as easily as it can punish you while the underlying business is doing exactly what you hoped it would do.
Over time, I’ve learned that one of the most valuable skills in investing is separating feedback from information. The stock price is feedback, while revenue growth, unit economics, customer behavior, competitive position, reinvestment opportunities and cash generation are information.
Eventually, the two clocks usually move back toward each other, but the market is under no obligation to tell you when. Sometimes price catches up to the business, and sometimes the business deteriorates until it catches down to the price.
This is also why patience alone is not a strategy. You need patience combined with the ability to continuously ask which clock is wrong, because without that discipline, patience can become stubbornness.
The stock market updates every second, the business does not. Wealth is rarely created by dancing between every movement of the first clock, it is created by understanding the second clock well enough to give compounding the time it needs to become enormous.
🌹
Want to Know If the Market Is Topping or Just Resetting for the Next Leg Higher? Read this.
Stan Weinstein’s framework gives us one of the simplest ways to answer it.
The Nasdaq ran 34% from the March low to the June high.
Then it spent three months going nowhere.The key is the 30-week moving average.
Stage 2 pause:
- 30-week MA still rising
- Price holds above it, pullbacks find support near the line
- Down weeks come on lighter volume
- The range eventually resolves higher
Stage 3 top:
- 30-week MA flattens out
- Price whips above and below the line
- Heavy volume shows up on down weeks
- Rallies keep failing at the same level
Right now, $QQQ sits above a 30-week line that is still rising.
By Weinstein’s framework, that looks more like a Stage 2 pause than a Stage 3 top.
That can change. The line flattening is the tell.
Until it does, the trend gets the benefit of the doubt.
Sideways above a rising line = pause.
Sideways through a flat line = potential top.
The market doesn’t need to go up every week to remain in an uptrend.
Sometimes the strongest moves come after months of doing nothing. We’ve seen this again and again - October 2023, April 2025, November 2025, and March 2026 are some of the best examples.
Until the 30-week MA tells us otherwise, the primary trend remains intact.
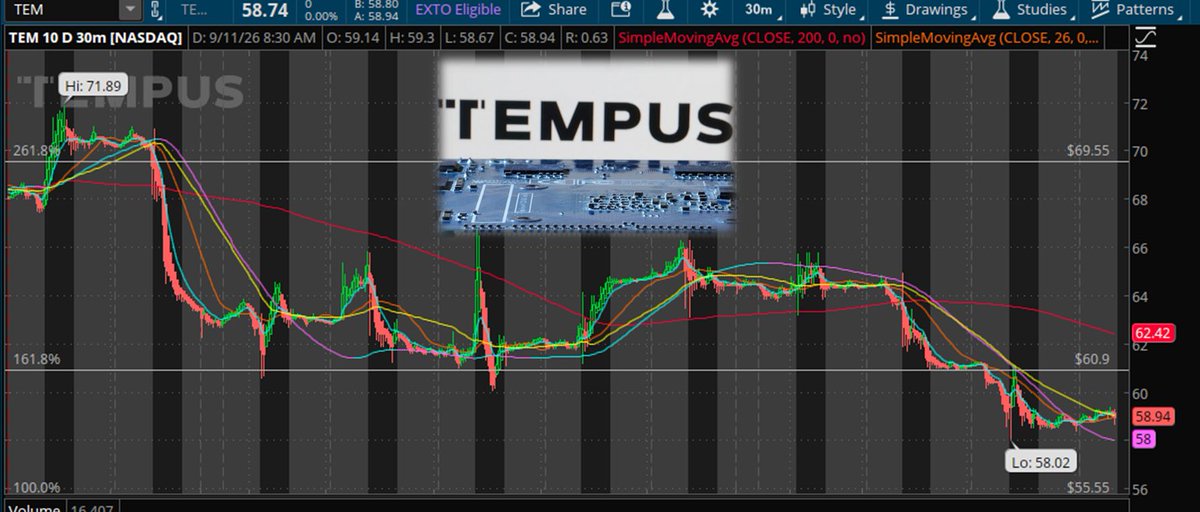
$TEM - Tempus AI
🔹Launches Effort to Build the Largest Multimodal Whole-Genome Dataset to Advance AI-Driven Healthcare Innovation
🔹Plans to link large-scale whole-genome data with rich clinical outcomes in a model-ready environment for AI-focused healthcare research
🔹Making Available 100,000 Disease-Specific Whole Genome Sequences Paired with Longitudinal Clinical Outcomes
🔹With a Long-Term Goal of Reaching 1 Million Genomes
Tempus AI $TEM announced Sept 9th that it has been selected by the Advanced Research Projects Agency for Health, within the U.S. Department of Health and Human Services, to receive an award of up to $9.5 million to build the first autonomous clinical AI agent capable of providing safe and effective care to patients suffering from heart failure.
🚨 THEY DON’T WANT THIS PUBLIC, SO I’M POSTING IT.
What you’re looking at in this image is HOW THE GAME IS ACTUALLY PLAYED.
Insiders don’t care about RSI, MACD, or whatever indicator is trending this week.
They care about WHERE LIQUIDITY SITS, WHO’S TRAPPED, AND HOW TO FORCE REACTIONS.
Retail looks at a chart and sees chaos.
Institutions see the SAME STRUCTURES REPEATING OVER AND OVER:
- QML setups
- Fakeouts and liquidity grabs
- Demand and supply flips
- Compression into expansion
- Stop hunts disguised as breakouts
- Flag limits
- Reversal structures that repeat cycle after cycle
NONE OF THIS IS ACCIDENTAL.
Every pattern on that chart exists for one reason:
TO MOVE PRICE INTO AREAS WHERE ORDERS ARE STACKED.
Once you understand that, a lot of things stop hurting you.
You stop chasing green candles. You stop panic-selling red ones. You stop getting liquidated on moves that felt “random.”
This is why MOST TRADERS LOSE.
They react to price instead of understanding WHY PRICE IS MOVING.
The people who survive this market spend years studying charts like this until it finally clicks.
After that, the market feels SLOWER, CLEARER, AND FAR LESS EMOTIONAL.
Save this tweet. Study it.
If you can learn to read WHAT INSTITUTIONS ARE DOING instead of guessing what comes next, you’re already ahead of 99.9% OF PEOPLE HERE.
Remember: I’ve been trading markets for 20+ years.
I’ve seen every kind of bubble, crash and liquidation.
I only care about the moves that matter.
When the next one comes, my followers will see it first.
Follow and turn notifications on.
You won’t get a second warning.


![dod_alen's tweet photo. [The Art of DCA]
Surviving a -$2,250 drawdown to close +$1,000 net.
This is the trade retail never posts.
When high-momentum stocks break down, rigid traders either blow up or panic-sell the absolute bottom. A weighted grid does the opposite: it aggressively weights the bottom tiers to drag your breakeven into the dirt.
$HIMS Execution Breakdown:
Pyramid Accumulation (4 Tiers):
- Entry 1 & 2: 50 sh @ ~$32 + 50 sh @ ~$28 (Initial probes: 100 sh)
- Bloodbath Heavy Adds: 150 sh @ ~$18.50 + 100 sh @ ~$15.00
Total Position: 350 shares ($7,201.75 basis)
Max Adverse Excursion (MAE): -$2,250.25 (stock cratered -57% from peak down to $13.74)
Net Avg Entry: Sunk all the way down from $32 to $20.58
Scaled Exit: Closed 350 shares (252 + 98) @ $23.50
Result: +$1,015.30 net (+14.1%)
Look at that chart: $HIMS never came close to retesting the original $32 entry.
It didn't have to.
By scaling 250 of the 350 shares near capitulation ($15–$18), a modest dead-cat bounce to $23.50 locked in a 4-figure net profit.
Position sizing isn't just risk management. It's an offensive weapon](https://pbs.twimg.com/media/HSVL6ByWgAEP_I1.jpg)
![dod_alen's tweet photo. [The Art of DCA]
Surviving a -$2,250 drawdown to close +$1,000 net.
This is the trade retail never posts.
When high-momentum stocks break down, rigid traders either blow up or panic-sell the absolute bottom. A weighted grid does the opposite: it aggressively weights the bottom tiers to drag your breakeven into the dirt.
$HIMS Execution Breakdown:
Pyramid Accumulation (4 Tiers):
- Entry 1 & 2: 50 sh @ ~$32 + 50 sh @ ~$28 (Initial probes: 100 sh)
- Bloodbath Heavy Adds: 150 sh @ ~$18.50 + 100 sh @ ~$15.00
Total Position: 350 shares ($7,201.75 basis)
Max Adverse Excursion (MAE): -$2,250.25 (stock cratered -57% from peak down to $13.74)
Net Avg Entry: Sunk all the way down from $32 to $20.58
Scaled Exit: Closed 350 shares (252 + 98) @ $23.50
Result: +$1,015.30 net (+14.1%)
Look at that chart: $HIMS never came close to retesting the original $32 entry.
It didn't have to.
By scaling 250 of the 350 shares near capitulation ($15–$18), a modest dead-cat bounce to $23.50 locked in a 4-figure net profit.
Position sizing isn't just risk management. It's an offensive weapon](https://pbs.twimg.com/media/HSVL6BvWkAA7WLS.jpg)




![dod_alen's tweet photo. [The Art of DCA]
Surviving a -$2,250 drawdown to close +$1,000 net.
This is the trade retail never posts.
When high-momentum stocks break down, rigid traders either blow up or panic-sell the absolute bottom. A weighted grid does the opposite: it aggressively weights the bottom tiers to drag your breakeven into the dirt.
$HIMS Execution Breakdown:
Pyramid Accumulation (4 Tiers):
- Entry 1 & 2: 50 sh @ ~$32 + 50 sh @ ~$28 (Initial probes: 100 sh)
- Bloodbath Heavy Adds: 150 sh @ ~$18.50 + 100 sh @ ~$15.00
Total Position: 350 shares ($7,201.75 basis)
Max Adverse Excursion (MAE): -$2,250.25 (stock cratered -57% from peak down to $13.74)
Net Avg Entry: Sunk all the way down from $32 to $20.58
Scaled Exit: Closed 350 shares (252 + 98) @ $23.50
Result: +$1,015.30 net (+14.1%)
Look at that chart: $HIMS never came close to retesting the original $32 entry.
It didn't have to.
By scaling 250 of the 350 shares near capitulation ($15–$18), a modest dead-cat bounce to $23.50 locked in a 4-figure net profit.
Position sizing isn't just risk management. It's an offensive weapon](https://pbs.twimg.com/media/HSVL6CCWsAAqi2L.jpg)