$BTC is in repair-needed mode.
No need to pretend the chart is healthy. It isn’t. But this is exactly why location matters.
The easy shorts were higher, when price rejected the June 2nd open area on June 15th and 16th. That was the cleaner spot. That was resistance doing its job.
Down here is different.
The green arrow is not random. That June 10 candle is the first real repair candle after BTC tested the February wick-low zone and held it on close. If this structure is actually trying to repair, that is the candle bulls want to see defended.
Lose it cleanly, and the argument gets a lot uglier.
Then you are basically back to the June 5/6 lows as the last line, and sure, maybe those still hold, but now the structure is no longer clean repair. It is damaged price sliding back into the same danger zone again.
That does not mean we can’t go lower. We absolutely can.
It just means shorting after the clean rejection already happened higher, while price is now testing the repair candle, is a very different trade.
This is where the bear case has to prove it can keep getting paid.
Does price accept below the repair structure?
Or does it hold, reclaim, and trap the late sellers who got brave at the worst location?
That is the test.
Support is not magic.
But the reaction here matters a lot.
$GNOM - Probably consistently outperforms the S&P 500 the next few years. Yes a lot of other ETFs up way more on the year but they are near ATHs, this one near ATLs. More important to look forward than behind.
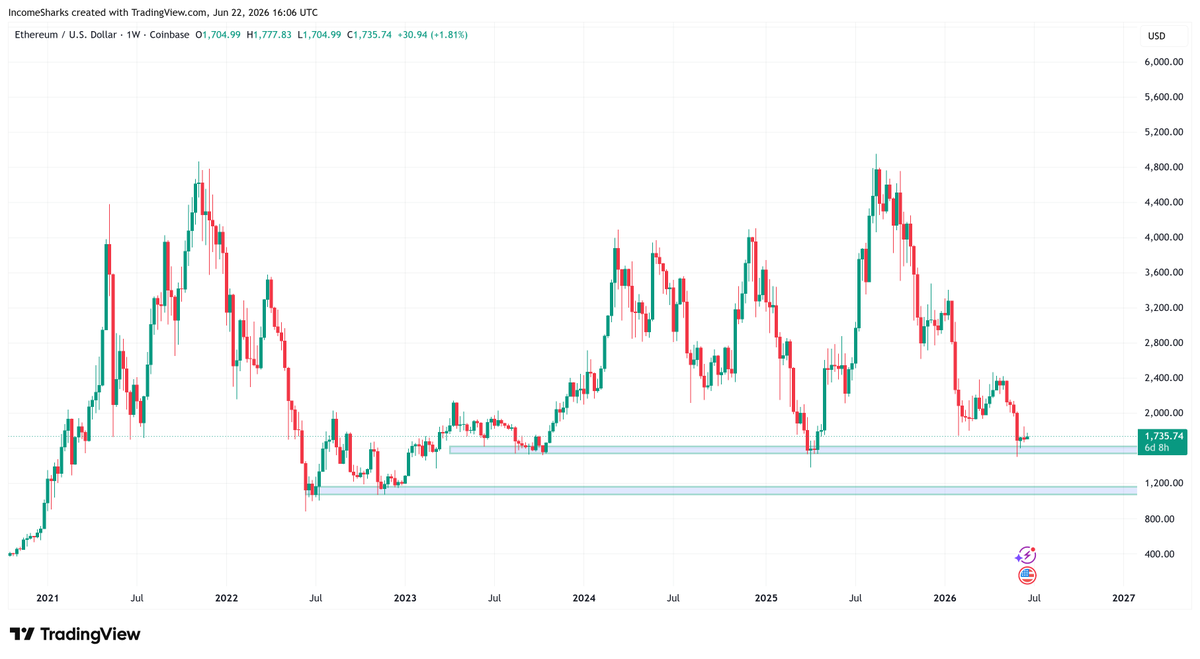
$ETH - Not too long ago you had to rationalize why you were taking profits at $4k and now a year later you look at this chart and wonder when the bleeding is ever going to stop.
Pay attention to multi year breakouts in industries that heavily benefit from AI that experienced their round one hype cycle already sitting at lows ready to experience their value matching cycle.
Back in 2022, I made a video calling the Bitcoin bottom using Wyckoff accumulation.
This one is different.
I’m not saying “the bottom is in.”
I’m asking the question that actually matters right now
Is this accumulation, or is this redistribution?
The redistribution story is easy.
Lose the lows, fail the reclaims, start living below value, and the market is probably searching lower. That part is simple.
So in this video, I spend more time on the harder question:
What would this need to look like if it was accumulation?
Because BTC is sitting right back near the same area that created the February stopping action.
The chart is ugly. The regime is still bearish. There is a lot of repair work to do.
But support usually looks ugly when you’re sitting on it.
I walk through the Wyckoff case, the value area, the key reclaim levels, and what bulls actually need to prove from here.
Holding the low keeps the accumulation idea alive.
Reclaiming value gives it teeth.
Losing the range changes the conversation fast.
Enjoy!
https://t.co/en6Kee7FtK
New Paradigm to Denial right now on Semis. The real trap is on the Return to Normal bounce that should come if this plays out. That's where you would look to actually short, a failed recovery that makes a higher low.
This is why value areas matter.
I anchored this profile from the Feb 6 liquidation low to today.
Since then, BTC has basically been washing back and forth through the same auction.
VAH to VAL. VAL to VAH. Back again, and again, and again. That’s not random. Inside value, price is moving through an area where the market has already agreed to do business.
The POC is the fairest price in that auction, and for all the gloom right now, BTC is only about $2,500 below that level.
That does not mean everything is fine, it just means the market is still very close to the center of this entire post-liquidation auction, even after all the noise, fear, and doom.
That’s why this area can feel so nasty. Both sides can make an argument.
Bulls try to buy lower value. Bears try to fade upper value. Failed breaks snap back through the zone and price can travel from one side of value to the other way faster than people expect.
The interesting part now is that price is sitting below value, so oddly enough, the first thing bulls want is to get back into the chop zone.
Reclaim VAL, get back inside the auction, then try to work back toward POC and the upper side of value.
That would at least put BTC back in the washer.
What bulls do not want is failed attempts below value.
Because once the price is accepted below the auction price, the market is no longer trading within the known value. It is trying to find a value lower, and that is where things can get very slippery.
Inside value is chop. Outside value is the attempt at price discovery. The edge is knowing which one you’re in.
With that said, bulls are running out of nearby structure to defend. They just swept one key low, and the Feb 6 low is the last major one left in this auction.
So reclaiming VAL soon matters.
The longer price stays rejected below value, the more this starts looking like acceptance lower instead of just another rotation.
Let’s talk about the bull case for a minute.
Not “this is the bottom.” Not “send it.” Just the bull case.
Because, like it or not, BTC is sitting at support. Maybe it fails. Maybe this thing loses the floor, and we’re having a very different conversation soon.
But we’re at the area now and I’m not going to pretend I haven’t seen this type of setup resolve bullish before. I have.
What caught my eye is how different this trip into the zone looks compared to February. Back then, once BTC lost the 80k area, it only took about 5-7 days to flush into the 60k zone.
Fast move. Heavy volume. Real liquidation.
This time, BTC got back near 82k, topped for a few days, and then took roughly 24 days to work its way back into the same general area.
Yes, the last few days got ugly and that matters. But the entire trip back down was still slower, less violent, and a lot more controlled than the February flush.
That’s interesting.
From a Wyckoff angle, that’s basically effort vs result.
In February, sellers hit hard and got paid immediately.
This time, sellers got us back to the same zone, but it took almost a month.
So now I’m asking a pretty simple question...
Was Feb 5-6 stopping action?
Was Feb 24 a secondary test?
Was that February through April range some form of early accumulation?
And is this just the market coming back into the same area to see if supply is actually dried up?
That’s the bull case.
Not confirmed. Not something to marry. Just something to respect.
Because if that earlier range was real accumulation, then this is where the bigger hands should be interested again.
They don’t need to defend my opinion. They need to defend price and that’s all that matters now.
Do buyers show up? Do we get a spring and reclaim? Do late shorts get trapped?
Can BTC bounce with some force, pull back, hold a higher low, and start taking levels back? That’s what I’d want to see for the Bull case.
If price just sits here, fails to reclaim, and starts accepting lower, then forget the bull case.
Then it was just a range inside a downtrend and the market is searching for value lower. Simple.
But I don’t want to blind myself to one side just because the narrative is ugly.
That’s how turns get missed. We’re all just studying footprints here.
The bear case is easy. Lose this area, lose the February low, and lower value becomes the conversation.
But the bull case is there too, fast liquidation into the zone in February, a much slower return into the same zone now, and one question left for the market to answer.
Was that earlier range accumulation, or not?
The next few days should tell us a lot.
The missing piece in the bull case is demand and demand does not prove itself in a story.
It proves itself here at this level.
If that earlier range was real accumulation, this is where the bigger hands should start showing up again.
This is where the theory has to become evidence.
The most successful traders I’ve ever met all share one thing:
They got knocked down… and kept going.
Not one of them had a smooth path. Not one of them “figured it out fast.” Every single one failed, stumbled, doubted, and kept showing up anyway.
That’s the trait that separates survivors from statistics.
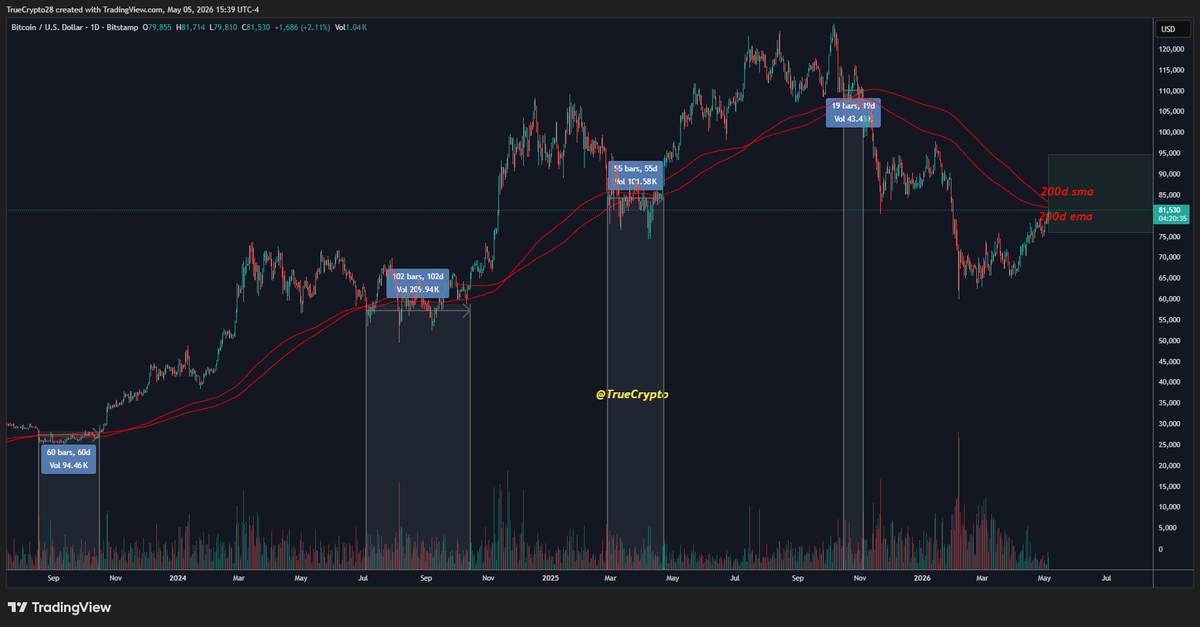
Bitcoin is now poised to test the 200-day EMA/SMA for the first time in 184 days.
This area matters, but not because the 200s are magic.
Because after price stays stretched away from them for that long, the move into them is often the easier mean-reversion trade.
What comes next is usually the harder part.
In past cycles, Bitcoin has often spent 20, 50, even 100+ days chopping, traversing, and faking out around this zone before the next cleaner move revealed itself.
Historically, Bitcoin often does not just tap this area and cleanly move on. It tends to spend time negotiating around it. Occasionally, price bursts straight through. Sometimes it rejects fast. But more often than not, this area becomes a high-timeframe decision zone.
That’s why I look at the 200-day EMA + 200 SMA less as two lines and more as a zone the market has to prove itself in.
A lot of the time, this area turns into a real battle zone, where sharp moves, fakeouts, squeezes, and repeated traversals can all show up before the market finally reveals its hand.
The touch gets attention.
The behavior around it is the real signal.
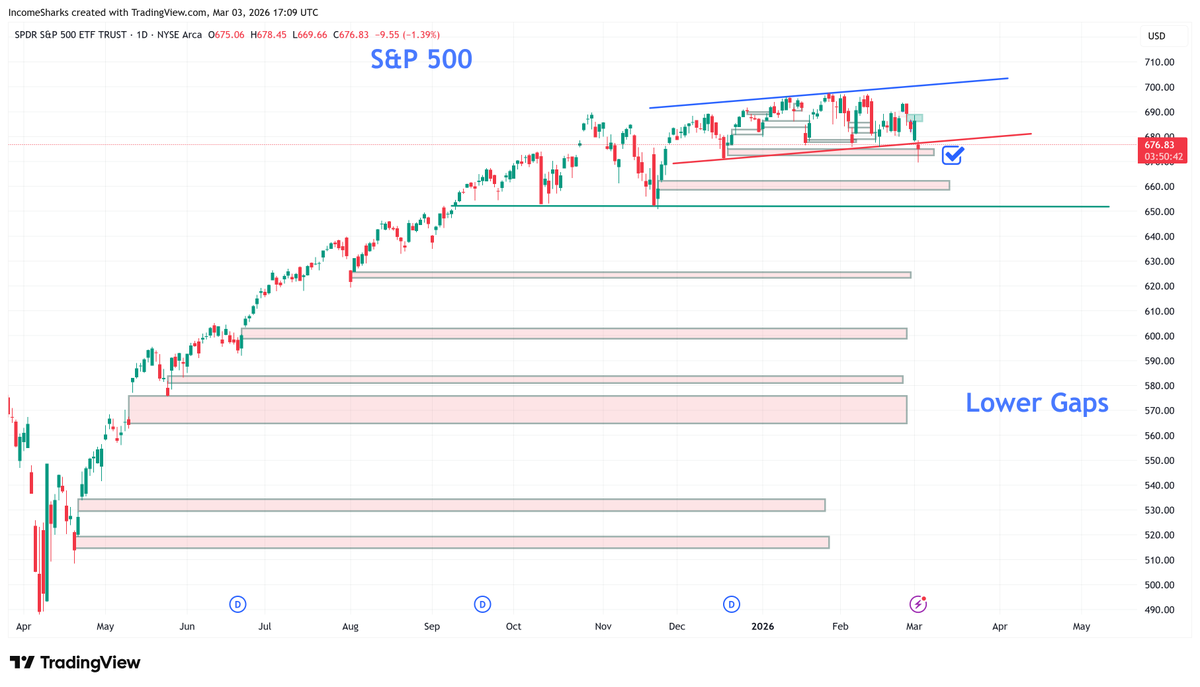
$SPY - It's easy to look at the chart and see how ugly it can get with all those gaps. But then you look at how much effort, bad news, fear, and sentiment it took just fill that one today and how quick of a reaction it got with buyers showing up.
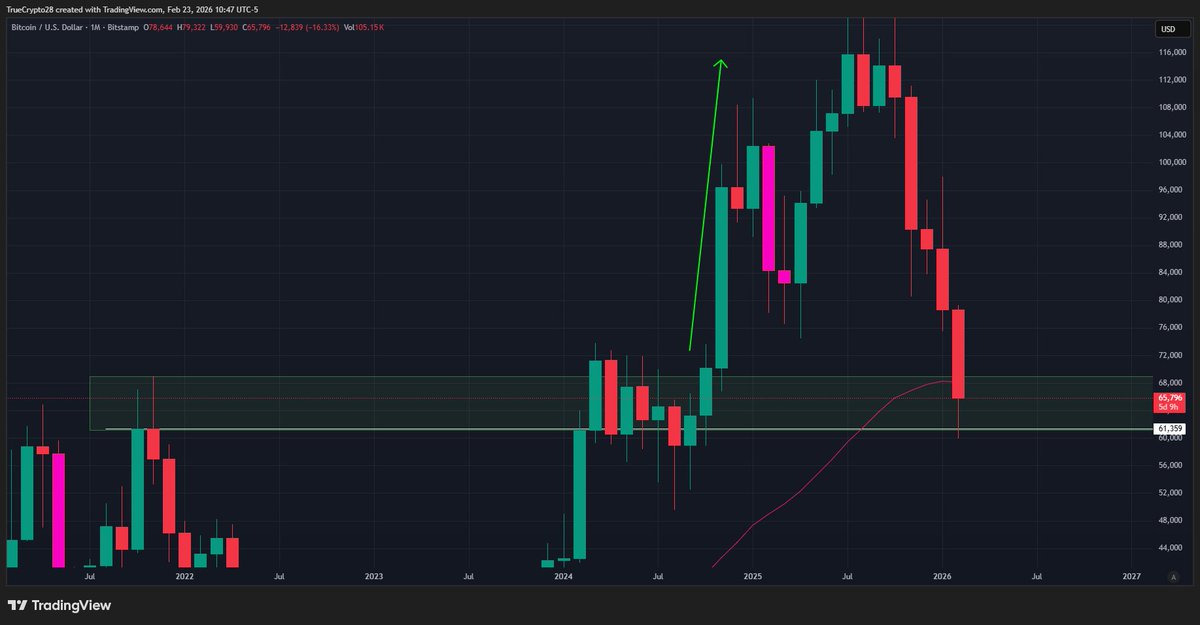
$BTC
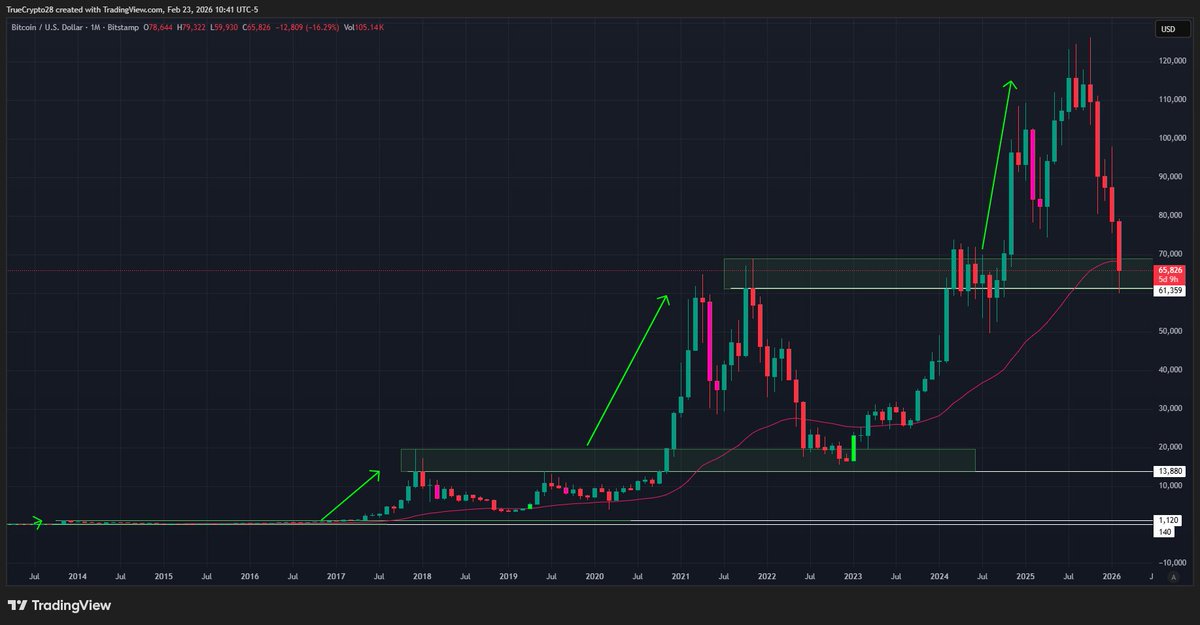
This 7-year log trend line has held on two touches thus far this cycle.
In chart 3, we have the 2019 monthly closing low drawn thru the 2022 monthly closing low (2019 cycle low thru the 2022 cycle low)
#Bitcoin has done many things, but Bitcoin has NEVER, in its entire history, closed a monthly candle back below a prior cycle’s monthly closing high after confirming a breakout above it.
$61,359 is that level (Oct 2021 monthly closing high).
If we close below it, it's the first confirmed monthly cycle-level top-side breakdown in history.
We'll know soon.
How real bottoms form.
People want to know if this is the bottom. The truth is that bottoms are not single candles. They are structures. They form slowly. They take effort. And they force you to read the chart without jumping ahead of it.
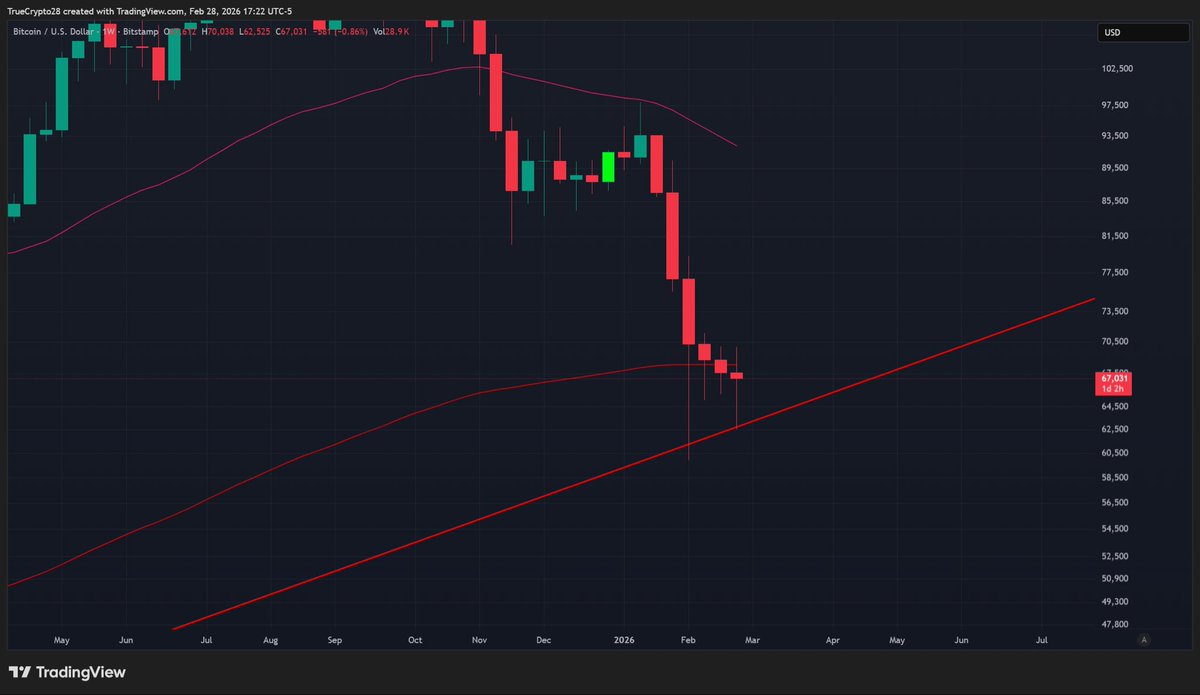
Right now price is still trapped inside the full range of the February 5 down candle. That single candle has contained price for almost a month. Until we break out of it, everything that happens inside is just noise. Even if the low is already in, structure still needs time to develop.
Look at the chart. The bounce from 59.9 has only taken us into the lower part of the range (top of the last capitulation candle) and into some early moving average resistance. That is normal. A market that just dropped from 98k to 59k is not going to reclaim higher timeframe levels in a straight line.
If this is the early stage of a bottoming process, the signs will always show up in the same places. Key horizontal levels. Key reclaim points. Key acceptance zones. And whether those levels fail or hold on higher timeframes.
The first chart shows the zone we are stuck in. This is your candle range. Until price escapes the full body and reclaims it, there is no thought of a structural shift. Bulls need to take back that zone and hold above it. Not wick above it. Hold above it. If price breaks out but cannot accept at the new level, that is not a breakout. It is a trap.
The second chart shows a more typical bottom. A large selloff. A range that forms. A slow reclaim of lost ground. One level at a time. Each level becomes a test. The market either accepts the reclaim, or you get a swing failure pattern that rejects and sends the price lower. That slow crawl is common because bottoms form when buyers gradually prove they are willing to absorb the supply that forced the initial drop.
The third chart shows the rare version. The V type. These happen when you get a violent move down followed by immediate defense of the wick lows and the close. Notice how clean the stepping structure is. Price fights through each area of resistance. It does not teleport. It grinds. It reclaims. It accepts. Then moves to the next level. That is the clue for a real V-bottom. Not the violence of the initial bounce, but the calm strength that follows.
In both versions, the key is the same. Horizontal levels. Are they reclaimed. Does price accept at the new level. Or do you get rejection or a higher timeframe swing failure pattern.
This is why the next stretch matters. A move into 74 to 76 will tell you who is in control. A push into 78 to 80 tells you how much supply is left. A test of 83 tells you if the deeper levels are being defended. Acceptance at any of these opens the door to the next. Rejection or failure at any of these warns you the bottom still needs more time or lower levels.
Bottoms are built by watching the reaction at each step. That is the entire game.
You do not predict them. You read them.
If this is going to be a V type, you will see clean stepping. If this is going to be a range type, you will see sweeps, failed breakdowns, and slow absorption.
If this is not the bottom, you will see failed acceptance at the key reclaim zones.
The chart will tell you everything if you stop searching for a hero candle and start focusing on structure. Most traders look for magic instead of levels. But it has always been the same. A real bottom reveals itself one reclaim at a time.
Watch the levels. Watch acceptance. Watch the reactions. Do that and won't get caught offside with a bias, do that and the market will show you the bottom long before the crowd sees it.