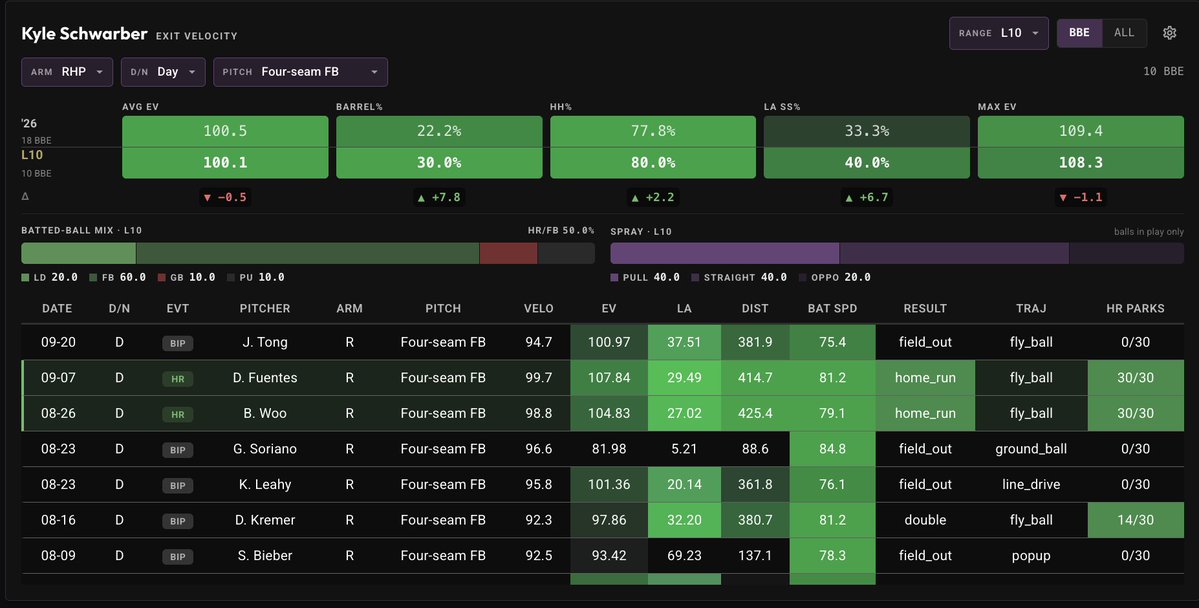
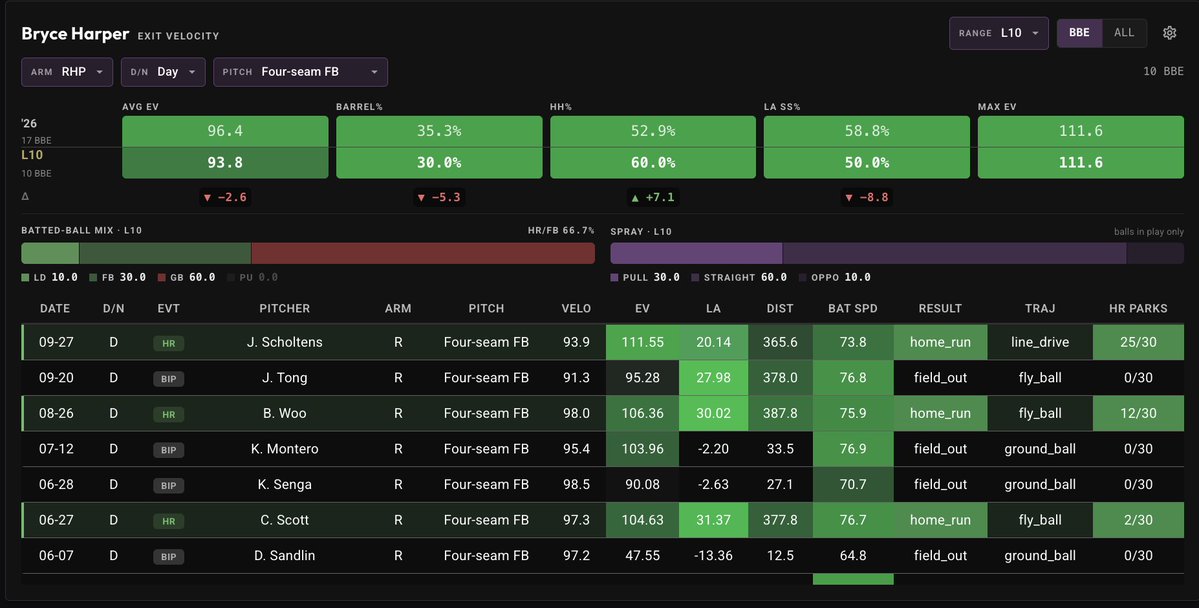
Bryce Harper & Kyle Schwarber will see a Fastball 49% of the time in the day tomorrow vs Tyler Mahle 👀💣
WHO’S YOUR FAVORITE PHILLY TOMORROW ⬇️?
📊 Data provided by @PropFinderApp
🎟️ Use code WP to save 30% OFF!
Chase Brown vs Pittsburgh Steelers 👀🏈
While everyone is targeting the bigger name RB1s this week I feel like Chase Brown is a SNEAKY RB1 worth looking at against Pittsburgh.
The Steelers allowed 15.4 carries per game to RB1s last season and are already allowing 13.5 to start 2026. Bijan and TreVeyon have both had productive games against this run defense.
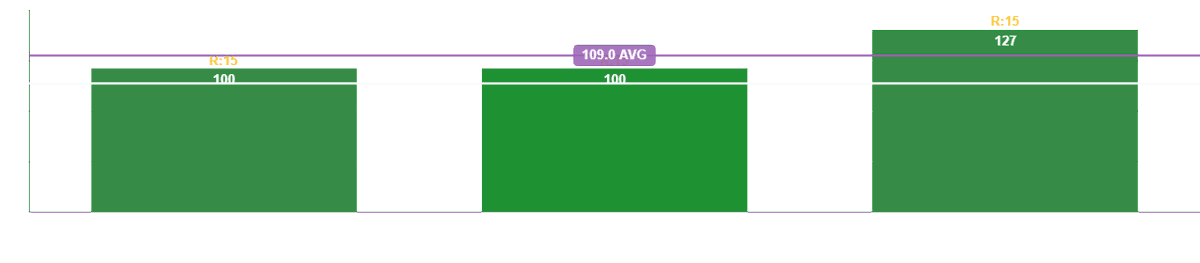
Brown has also had success against Pittsburgh H2H, averaging 109 combined rushing and receiving yards. I'm personally leaning a little more toward his RUSHING YARDS in this matchup. 👀
Now look at the rushing matchup using 2025 data:
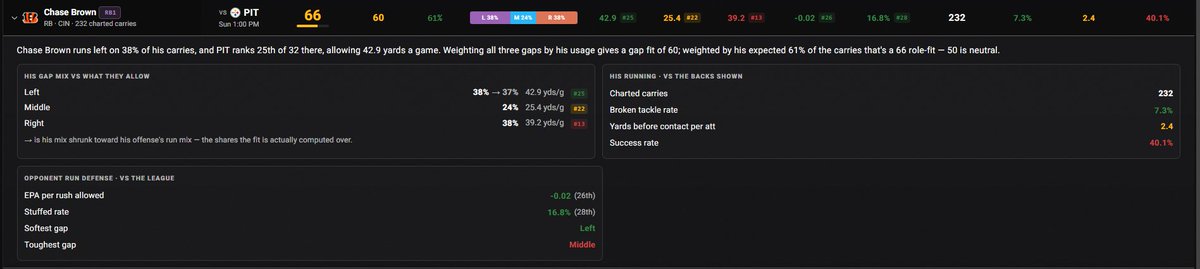
📊 ROLE FIT: 66
📊 GAP FIT: 60
🏃 Expected Backfield Share: 61%
Pittsburgh's run defense allowed:
🎯 Left: 42.9 Rush YDS/G — 25th most
🎯 Middle: 25.4 Rush YDS/G — 22nd most
🎯 Right: 39.2 Rush YDS/G — 13th most
The interesting part is where Brown actually runs.
🎯 LEFT GUARD — 17.2% of his carries
Brown: 4.43 YPC | PIT allowed 4.31 YPC
🎯 MIDDLE — 24.1% of his carries
Brown: 4.75 YPC | PIT allowed 3.95 YPC
🎯 RIGHT GUARD — 22.8% of his carries
Brown: 3.49 YPC | PIT allowed 3.44 YPC
Those three gaps account for 64.1% of Brown's charted carries. The middle stands out to me. It's his most frequently used individual gap, and he averaged 4.75 YPC on 56 carries there last season.
Pittsburgh's overall run defense isn't a complete mismatch, but Brown's workload and usage make this interesting.
NOW LOOK AT HIS RECEIVING UPSIDE 👀
Pittsburgh played Zone on 66.5% of its coverage snaps.
🎯 VS ZONE — 67 Targets
85.1% Catch Rate | 25.2% Targets/Route | 5.0 Yards/Target
Now look at his receiving route tree:
🎯 Flat: 52% of routes | 30 Targets | 93% Catch Rate
🎯 Angle: 25% of routes | 27 Targets | PIT 4th most yards allowed
🎯 Screen: 4% of routes | 10 Targets | 90% Catch Rate
Flat and Angle account for 77% of his routes, giving him another way to produce if Cincinnati continues involving him in the passing game.
For me the rushing yards are where I'm leaning but I wouldn't ignore his receiving production either. This is one of those RB1 matchups I feel could fly under the radar while everyone focuses on the bigger names. 👀
📺 https://t.co/a8a96iA5mO
📊 Data provided by @PropFinderApp
🎟️ Use code WP for 30% OFF
Rachaad White vs Seattle Seahawks 👀🏈
I feel like White is due for a BIG game in the receiving department and this is a matchup I want to attack.
Croskey Merritt is Washington's clear RB1 on the ground but White has a completely different role in this offense. He's their primary receiving back. Croskey Merritt also averaged just 0.5 targets per game in 2025.
Seattle allowed 7.3 targets per game to RBs in 2025 and look at White's production in his last game:
🎯 7 Targets
🎯 6 Receptions
🎯 40 Receiving Yards
Now compare their involvement in the passing game.
📊 2026 ROUTES RUN
Rachaad : 41
Croskey : 4
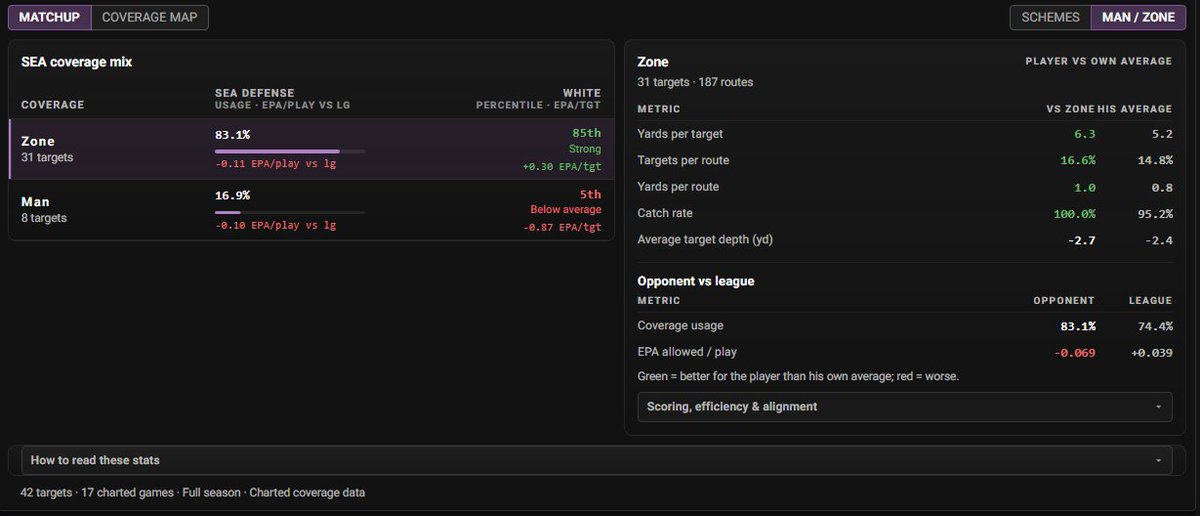
Now look at White's matchup against Seattle's coverage using 2025 data Seattle played Zone on 83.1% of its charted defensive snaps, and White's production against Zone stands out.
🎯 VS ZONE — 31 Targets
100% Catch Rate | 6.3 Yards/Target | 16.6% Targets/Route | 1.0 Yards/Route
Compared to his numbers against Man:
🎯 VS MAN — 8 Targets
5.2 Yards/Target | 0.8 Yards/Route
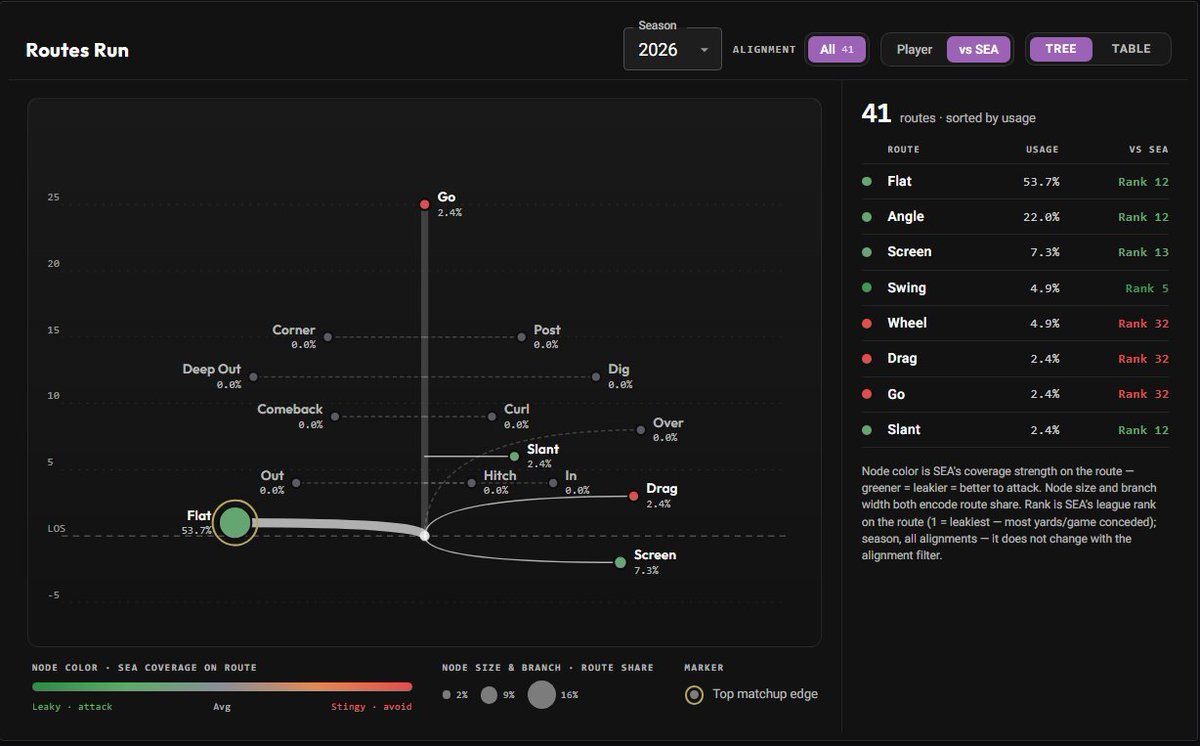
Now look at his 2026 route tree against Seattle:
🎯 Flat: 53.7% of routes | SEA 12th most yards allowed | 100% Catch Rate
🎯 Angle: 22.0% of routes | SEA 12th most yards allowed | 13.0 Y/T
🎯 Screen: 7.3% of routes | SEA 13th most yards allowed
The biggest thing for me is VOLUME. White just saw 7 targets, has run 41 routes compared to Croskey Merritt's 4, and now faces a Seattle defense that allowed plenty of RB targets last season and this season.
I'm looking at White's RECEPTIONS and RECEIVING YARDS here, not his rushing production. 👀🔥
📺 https://t.co/a8a96iA5mO
📊 Data provided by @PropFinderApp
🎟️ Use code WP for 30% OFF
Lamar Jackson vs Dallas Cowboys 🔥🏃♂️
Dallas has struggled to contain mobile quarterbacks and we're already seeing it again in 2026.
Remember when I told y'all Jayden Daniels was going to destroy Dallas on the ground before leaving with an injury he had 7 Carries | 69 Rushing Yards And Dart also got loose against this defense 11 Carries | 54 Rushing Yards
Lamar hasn't faced a defense with this kind of vulnerability against mobile QBs yet this season. Now he gets Dallas, a team he already torched in their last H2H matchup in 2024 15 Carries | 87 Rushing Yards | 1 Rushing TD 🏃
Now look at the rushing matchup using 2025 data.
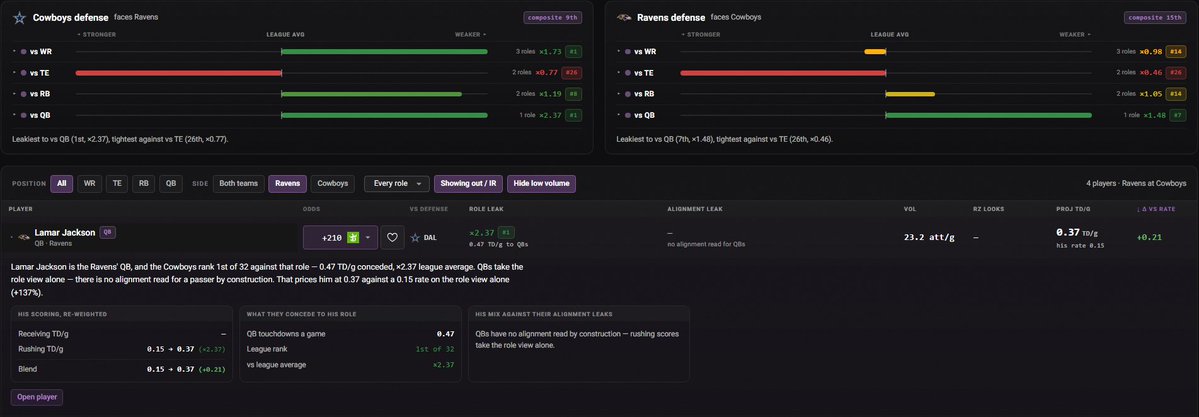
Dallas allowed 0.47 rushing TDs per game to QBs, the MOST in the NFL and 2.37× the league average.
Lamar's adjusted rushing TD rate:
🎯 0.15 ➡️ 0.37 TD/G 📈
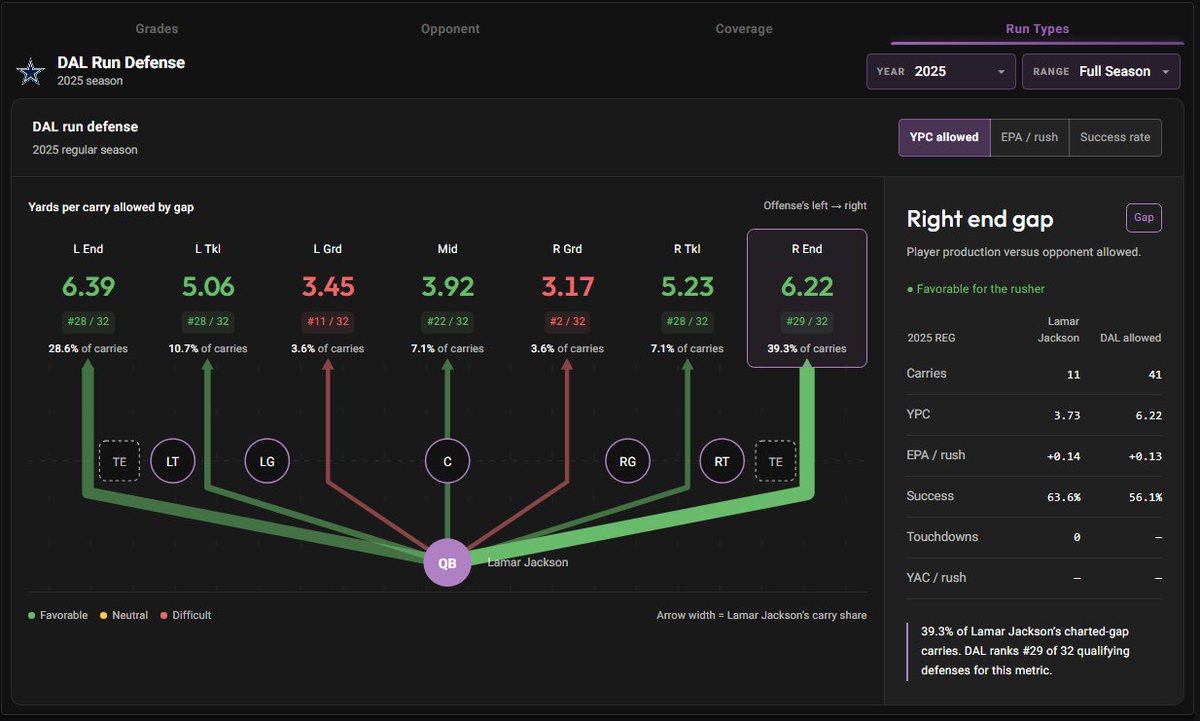
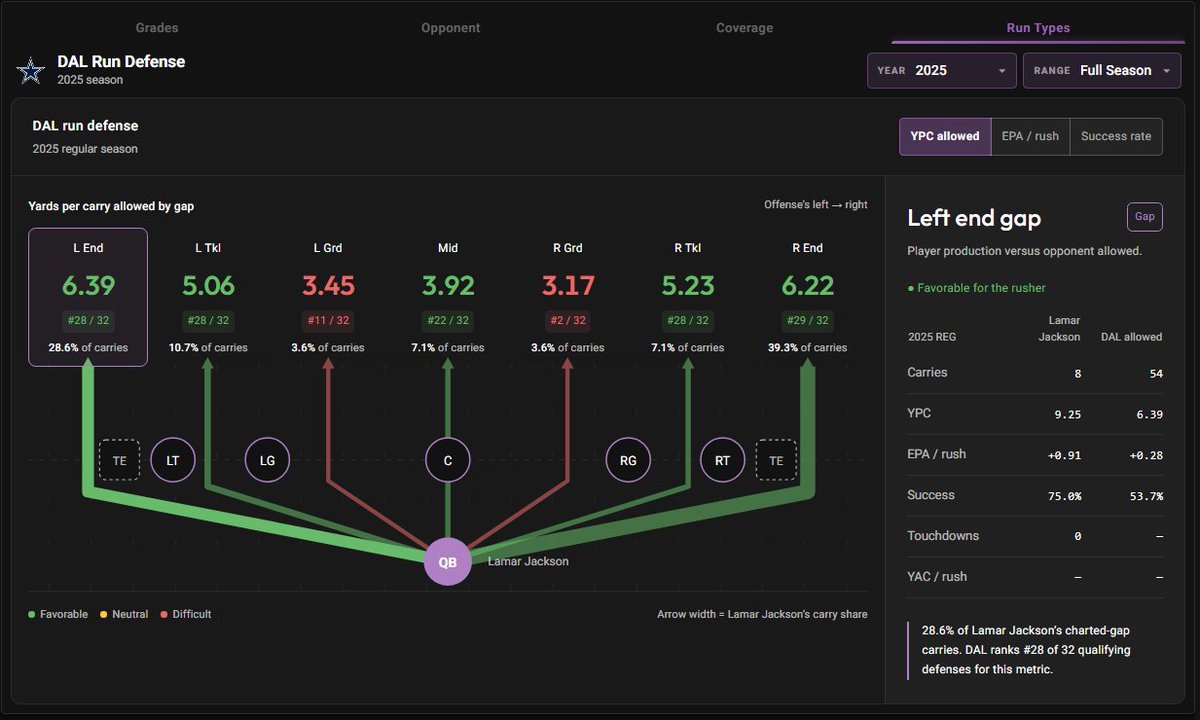
Now look at where Lamar actually runs compared to Dallas' defensive weaknesses:
🎯 LEFT END — 28.6% of Lamar's runs
DAL allowed 6.39 YPC | 28th of 32
🎯 RIGHT END — 39.3% of Lamar's runs
DAL allowed 6.22 YPC | 29th of 32
🎯 LEFT TACKLE — 10.7% of Lamar's runs
DAL allowed 5.06 YPC | 28th of 32
🎯 RIGHT TACKLE — 7.1% of Lamar's runs
DAL allowed 5.23 YPC | 28th of 32
Those four rushing gaps account for 85.7% of Lamar's charted carries, and Dallas ranked 28th or worse in yards per carry allowed at EVERY ONE of them. 👀
The biggest thing for me is his outside rushing usage. Lamar ran toward either end on 67.9% of his charted carries, and Dallas allowed over 6 YPC at both ends.
I'm looking at Lamar's rushing yards in this matchup with his rushing TD market also worth researching. The combination of his previous H2H production Dallas' recent struggles against mobile QBs, and the rushing gap matchup is exactly what I wanted to see. 🔥
📺 https://t.co/a8a96iA5mO
📊 Data provided by @PropFinderApp
🎟️ Use code WP for 30% OFF
Sam Darnold vs Washington Commanders 👀🏈
Darnold is BACK from injury and heading on the road to Washington. I really like this matchup for his passing yards. Washington's pass defense struggled in 2025, allowing 257.1 passing yards per game (5th most) and 1.9 passing TDs per game (3rd most).
We haven't gotten a proper look at Darnold this season after he suffered an injury on the opening week, but remember what happened the last time he faced this defense: 🔥 330 Passing Yards 🔥 4 Passing TDs
Now look at the coverage matchups using 2025 data:
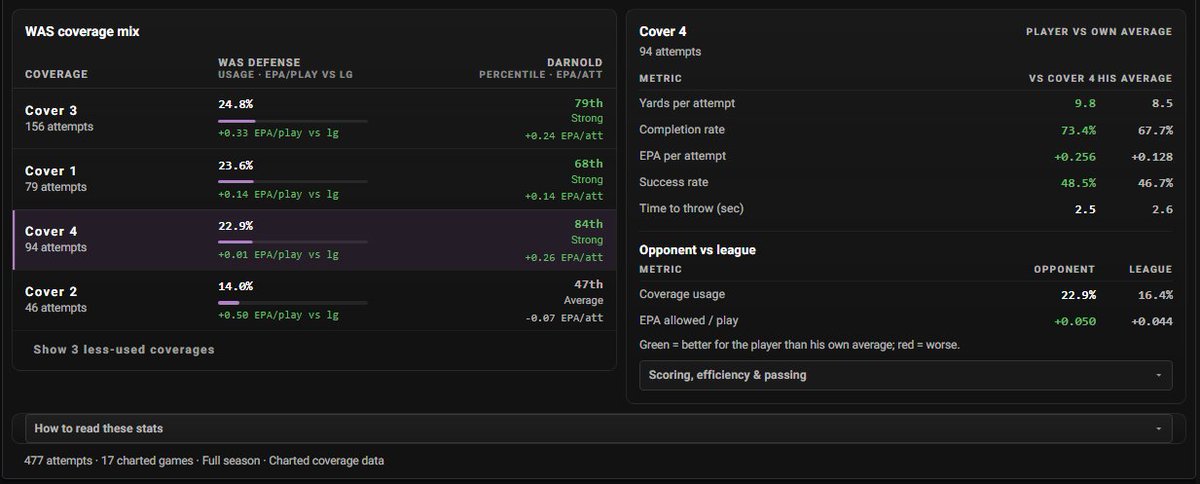
🎯 COVER 3 — 24.8% of WAS coverage mix
Darnold: 10.0 Yards/Attempt | 67.3% Completion | +0.243 EPA/Attempt
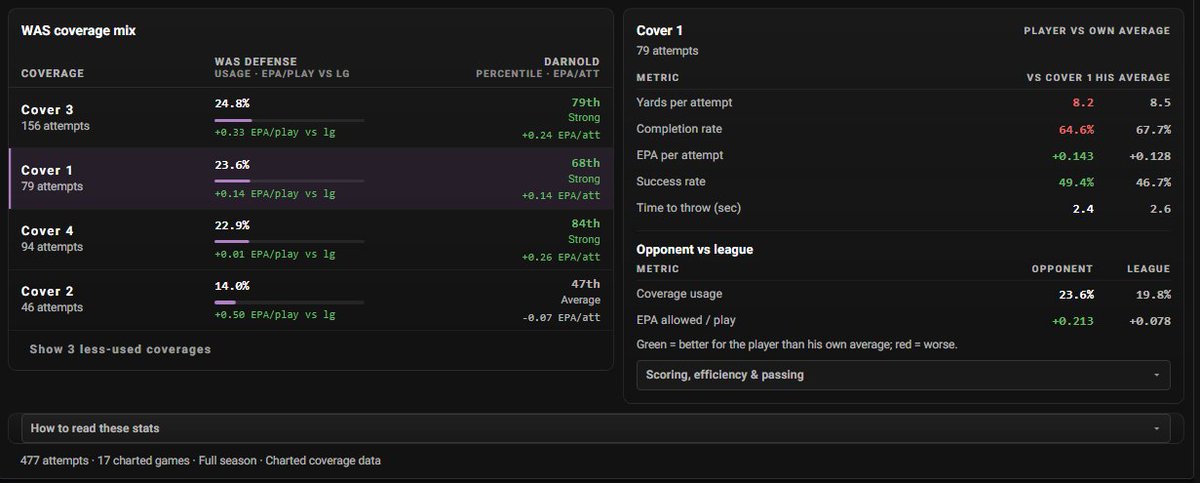
🎯 COVER 1 — 23.6% of WAS coverage mix
Darnold: 8.2 Yards/Attempt | 64.6% Completion | 49.4% Success Rate
🎯 COVER 4 — 22.9% of WAS coverage mix
Darnold: 9.8 Yards/Attempt | 73.4% Completion | +0.256 EPA/Attempt
Those three coverages account for 71.3% of Washington's charted coverage mix, and Darnold has shown strong efficiency against them. The two that really stand out to me are Cover 3 and Cover 4. Across 250 attempts against those looks in 2025, Darnold averaged 10.0 and 9.8 yards per attempt, respectively.
Washington also allowed +0.382 EPA/play against Cover 3, compared to the league average of +0.052. With his previous H2H performance and the coverage matchup, I'm looking more toward Darnold's passing yards in this game. 🔥
📺 https://t.co/a8a96iA5mO
📊 Data provided by @PropFinderApp
🎟️ Use code WP for 30% OFF
Cam’ron and Ma$e couldn’t stop LAUGHING after Ma$e confronted him over his “I’M THE MEAT MARKET” lyrics, so Cam FIRED BACK by pulling up an old video of Diddy looking at Ma$e’s BUTT 😭💀
“What was Puff looking at?” 🤣