Pine v5 is here!
It brings Pine libraries, switch structures, while loops and much more! You can learn more about new v5 features in our Release Notes (https://t.co/BdZeQnnefa).
Our Migration Guide (https://t.co/c6souORo5R) will help you with the transition. Enjoy!
@bedat_stephane @tradingview@version Don't think this feature is available, could write a custom script tp grab only necessary data and plot with shapes, but imo this workaround not worth it. Anyway the X axis will be messed up with complete time scale
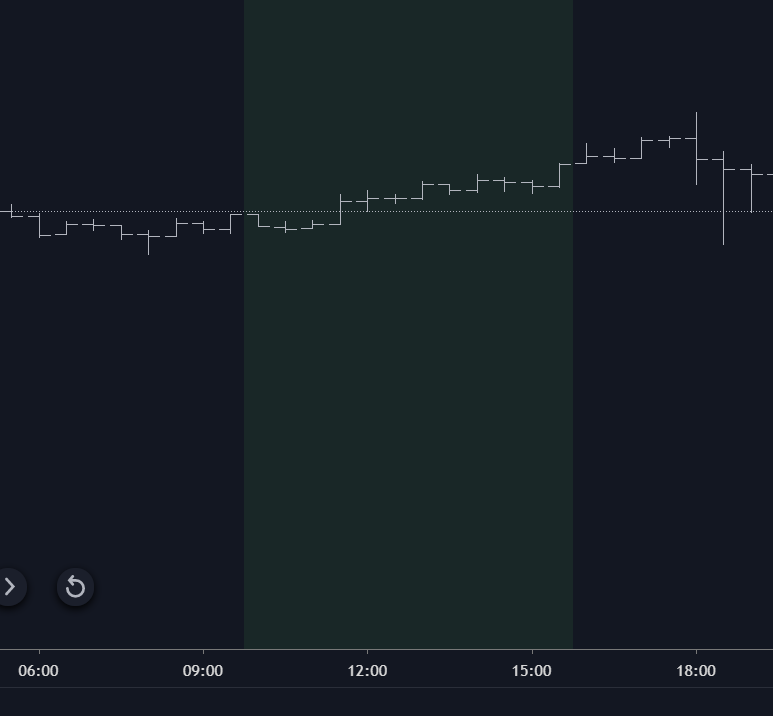
@bedat_stephane @tradingview The easiest way is to highlight the session on the chart:
//@version=4
study("", overlay = true)
session = input("1000-1600", "Session Highlight", input.session)
sessionTime = time(timeframe.period, session + ":1234567")
bgcolor(sessionTime ? https://t.co/y6dsiHReS3 : na)