The @hyblockcapital team is kindly giving to our community 3 year advanced accounts!
RT + like + comment your BTC end of year target to participate. Picking 3 winners in 24h.
They're also running a 70% sale this week, and you can get an extra 5% here: https://t.co/iqtXxdCA6N
Happy 17th #Bitcoin Whitepaper Anniversary! 🧡
Decades before Satoshi released the whitepaper in 2008, cryptographers, mathematicians, and cypherpunks had already laid the groundwork.
Here’s who they were, what they built, and how their ideas shaped Bitcoin.
A thread. 🧵👇
@COLDCARDwallet self custody gives me peace of mind and confidence that my savings are truly safe and are under my complete control that no one can take away from me ever
$BTC
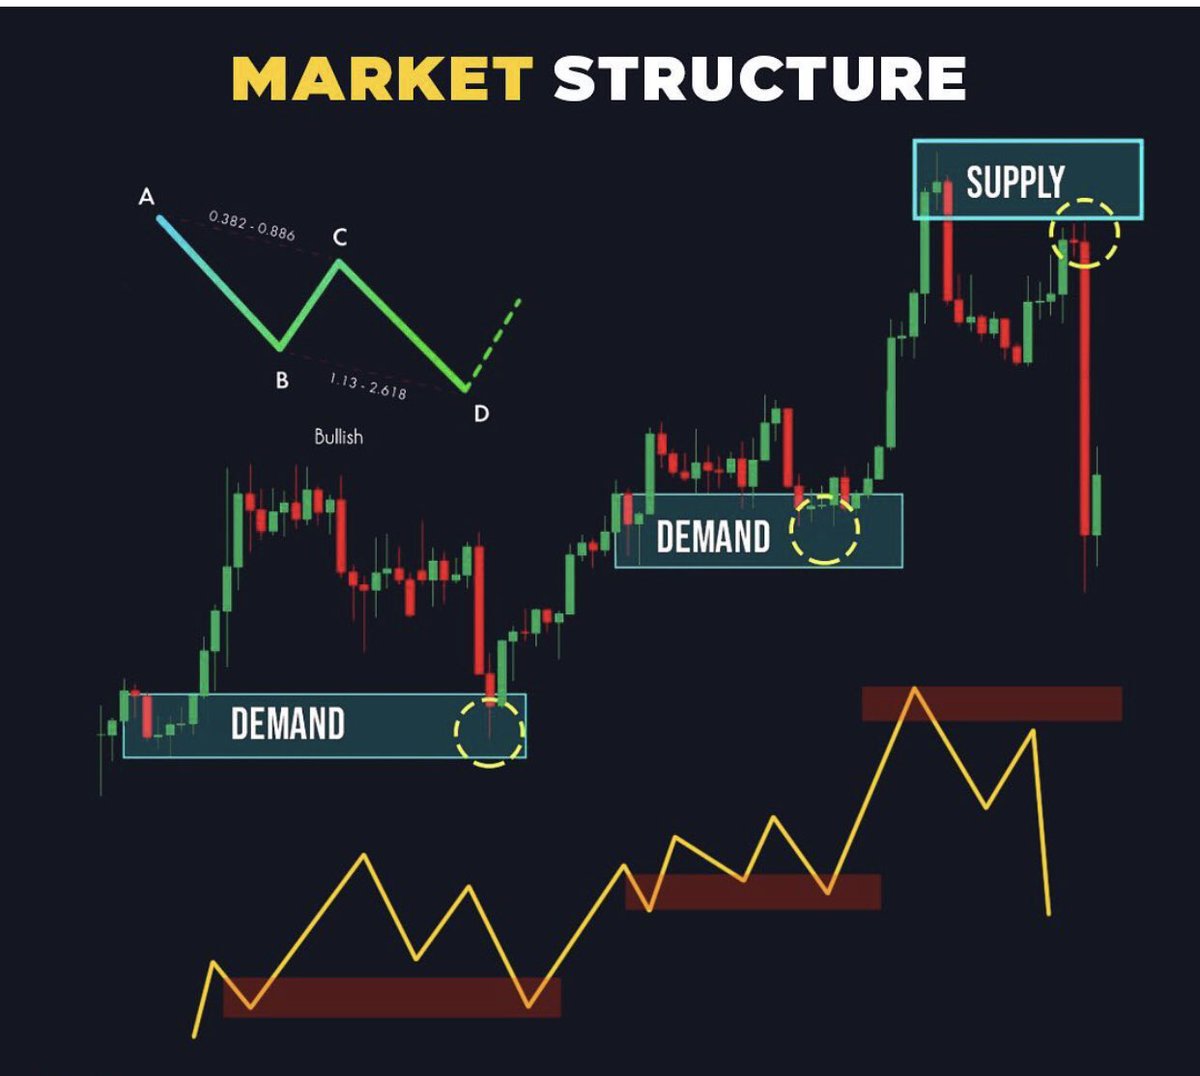
I like to use line charts for market structure.
They tend to be clearer as they only show the closes.
We've only seen lower highs on the weekly thus far.
Locally, this is the bears' last stand i.e. last reasonable area where a lower high could form if they're right + close proximity to invalidation.
$64k+ weekly close, ideally an impulsive one, would suggest a bullish break in market structure (first one in a while).
If that happens, the following considerations apply in my trading system:
1. HTF directional bias is set. Essentially means lower time frame long setups can be held for longer and/or with wider targets + stricter criteria for short setups.
2. Weekly close meme entry. If I get a strong HTF candle close signal, I'll often try to trade the nearest daily open setup to have some exposure in case the strong close turns into a trending runner without a pullback. I think I have a video on this but my brain is damaged from being on CT for almost the entirety of my 20s.
3. Medium time frame pullback entry. A lot of longs can pile in after a higher high, and if they're too horny they end up puking on a minor (no Diddy) pullback. This pullback, conveniently, can land at a nice higher low level. This is a slower trade as it can take a while for the higher high to higher low structure to form on the weekly time frame, but offers better proximity to invalidation.
In summary, we're at local resistance in the context of bearish weekly market structure, but if bears roll over here the technical implications are quite significant - you should have a plan.
So, what does all of this mean and how should you position? Up or down?
I don't know - I sold all my crypto in the March 2020 crash and never looked back.
Thank you for coming to my Cred Talk.
True Trading Tip
You must assume that it's not only possible but probable that your trade idea might be wrong.
Without this realization, you cannot establish appropriate risk thresholds or ensure your protection.
TRADING RULES
Small Losses only
Avoid big losses at all costs. The higher your % loss, the higher the % gain you need to get your money back. On a 50% loss, you need a 100% gain to break even
Control Risk
Know your exit criteria before you enter a trade.
Exit as soon as the reason for your entry is not valid anymore
Liquid Assets
Liquid assets are easier to exit. As a matter of fact, technical analysis is more reliable w/ highly liquid assets. Large volume makes it much more difficult to manipulate an asset
Buy Strong Assets, Short Weak Assets
A strong asset has less overhead resistance & better "flow"
Just The Charts
Trading for a living requires different skills. Everything you need to know is right there in front of you. If you can’t see it, it probably isn’t there.
Pattern Pressure
The asset needs to display some kind of basing pattern or consolidation pattern. Don’t chase or knife catch
Market Analysis
You need to know what kind of stage your asset is in with most of your Trades being in the direction of the primary trend.
Discipline
Stay disciplined. Keep emotions in check. Emotionally detached traders yield better results. Discipline will separate you from the pack
Edge-Based Signals Service
Next week I will open up my Edge-based Signals Svc to the public.
For the past year, these systems have managed to produce consistent returns.
Active Traders interested in no-cost access to this tool:
1⃣Like
2⃣Retweet
3⃣ DM for details
$ETH
Move off the lows thus far look corrective. Keeping in mind its a Sunday.
Corrective moves channel.
Impulsive moves do not.
Example:
- Move up right now is channeling
- I expect a move back down to do the same
- IF at any point we break the channel, *then* we likely transition from corrective -> impulsive move and thats when the fun begins. (It could reclaim the current channel resistance, but if not up/down channels at the lows would form a larger range - which is fine).
- Green dot = example of breaking a channels resistnace
Or we are due a lower low towards 2700.
So the two key things I'm watching, ETH as an example:
1) We break a corrective channel's resistance
or
2) We leg lower into D1 EMA 200 and/or put in some bull div on the 4hr on the next move down.
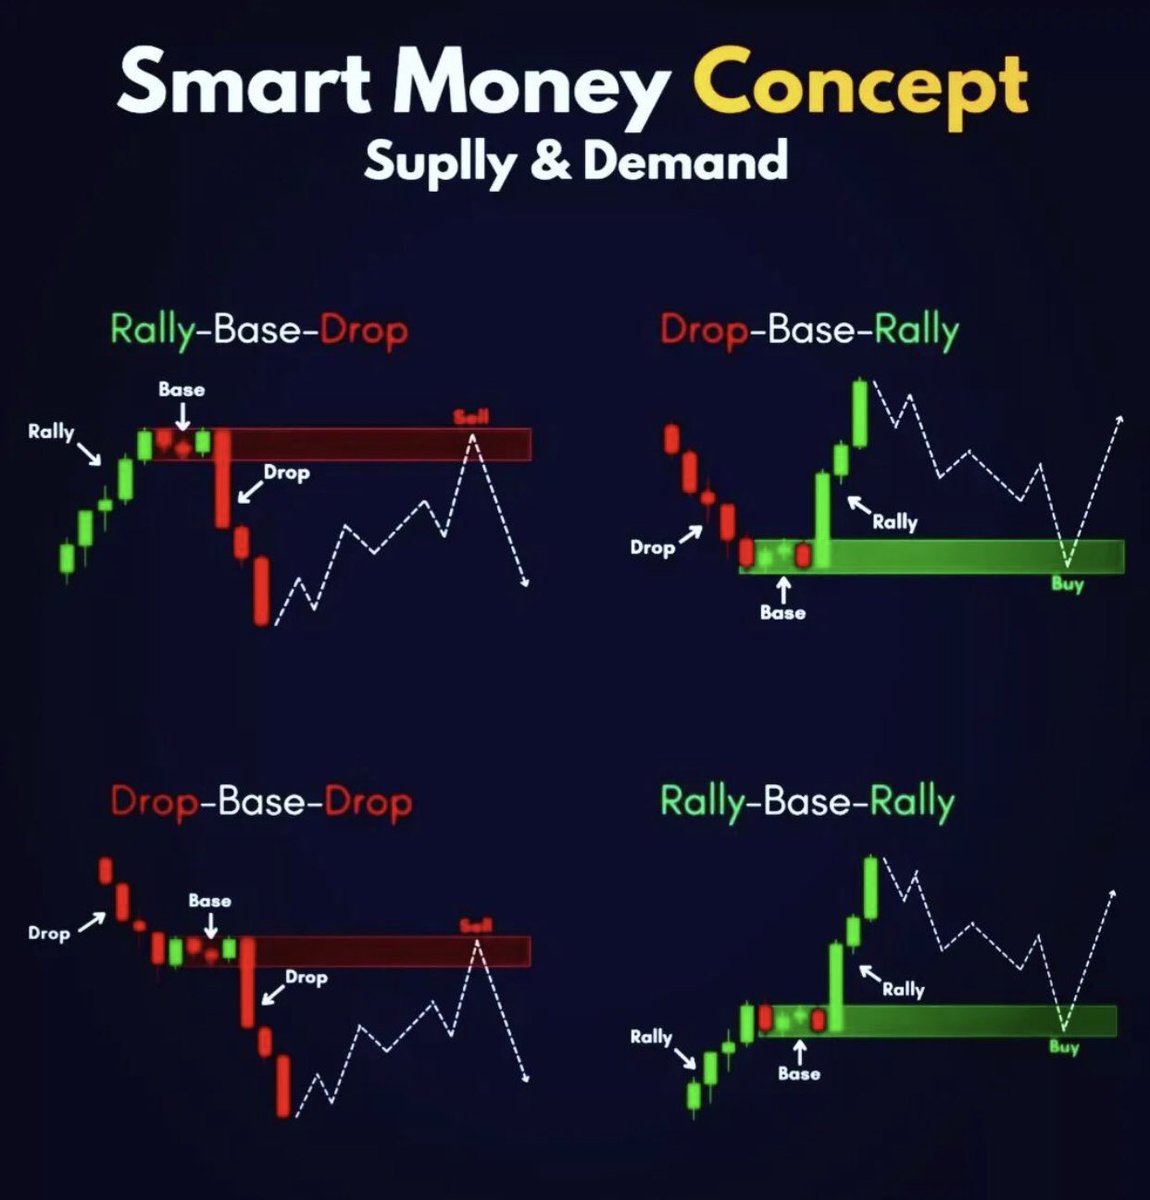
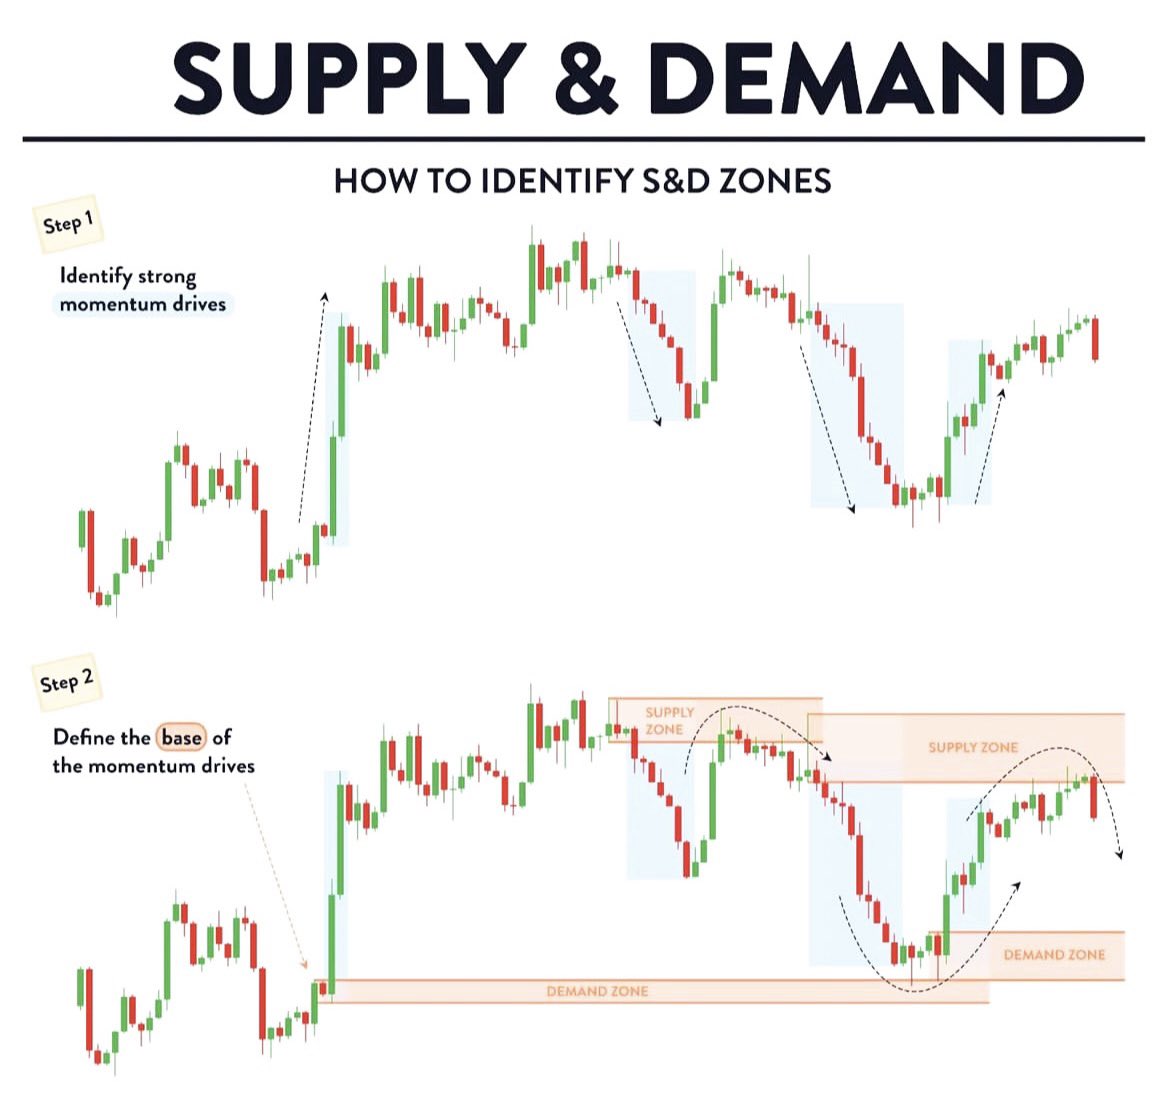
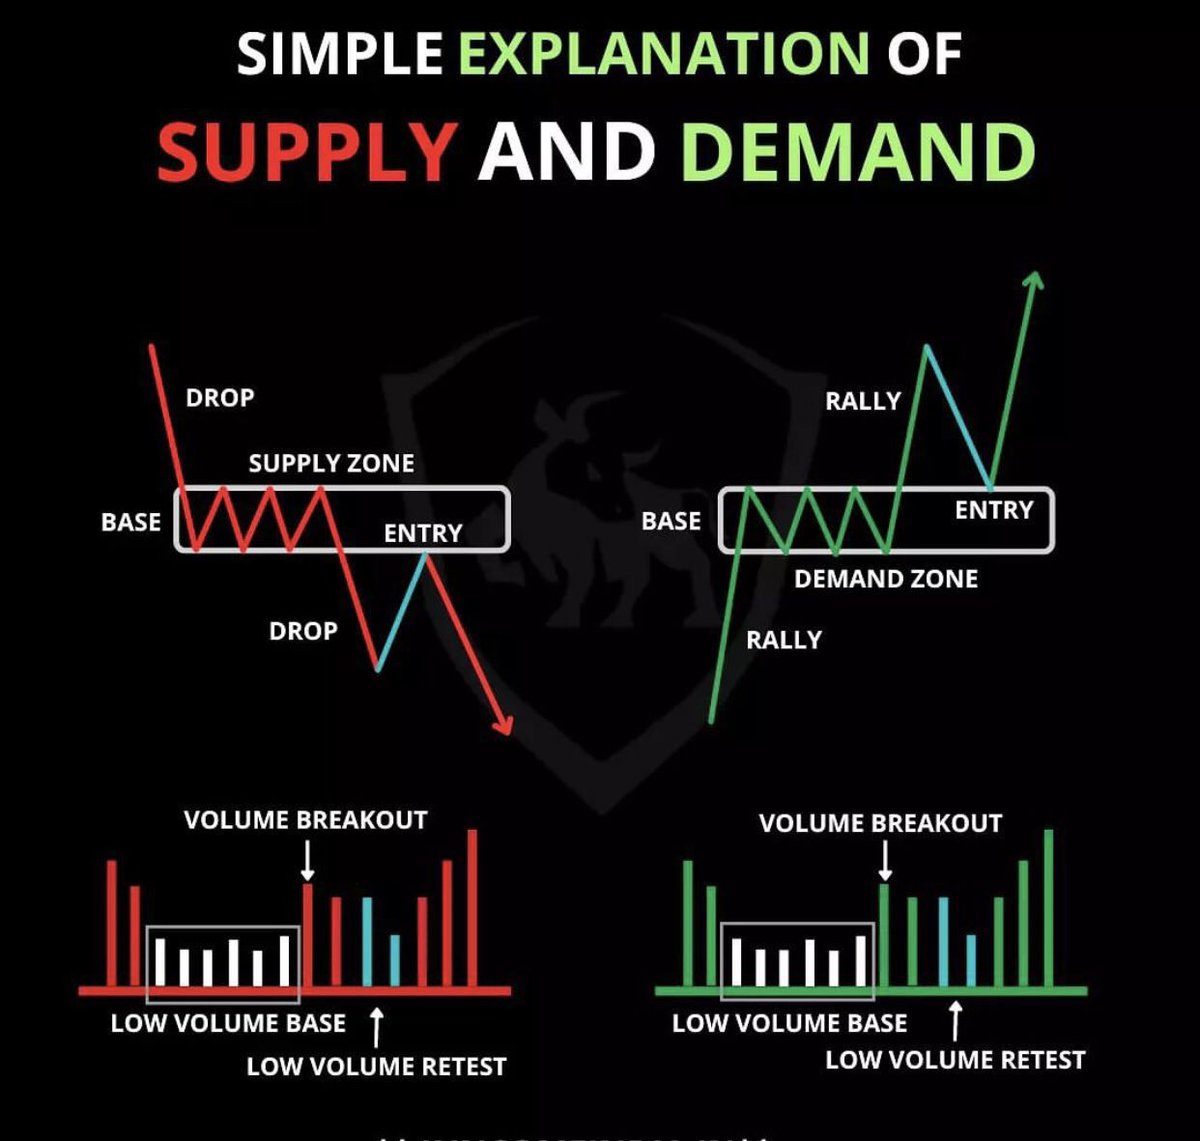
SUPPLY & DEMAND 📚:
1. Look for strong price momentum, candles must be backed with big volume.
2. Define the base of this price momentum.
Base refers to the area just before price exploded into a direction.
"6 Stages Of A Trader"
If we are to become a great trader we will go through some variation of all 6 of these stages.
Being aware of these stages can help you identify where you are now and where you need to eventually be.
(Which stage are you currently at?)
Stage One: The Mystification Stage
This is where the neophyte trader begins.
He has little or no understanding of market structure. He has no concept of the interrelationship among markets, much less between markets and the economy.
Price charts are a meaningless mish-mash of colored lines and squiggles that look more like a painting from the MOMA than anything that contains information. Anyone who can make even a guess about price direction based on this tangle must be using black magic, or voodoo.
However, as one begins to observe, read, study, the mess may begin to resolve itself into something that may make sense. Sort of... 😉
You spend years studying every possible combination of RSI, MACD, moving averages, BB, stochastics...
To realize that a simple price action setup is more powerful than any lagging indicator.
High Probability Models [All Of Them]
Require:
1) Knowledge Of Market Conditions [Profiles]
2) Time & Price Theory
3) Narrative [The "Why" Price Should Move Where]
4) Market Structure
5) Real Order Flow
6) Sound Money Management
7) Excellent Entry & Exit Criteria
Period.
#PriceAction
Understanding Supply/Demand vs Liquidity
Knowing what a Supply/Demand (SD) is and knowing how to use them are different. Small writeup to provide clarity, to my perspective.
Small write up to cover:
- Improper use of SD
- Suggested Use of SD
- Conclusion
A price action trading system is a process for using price data to make buy and sell decisions on a watch list of charts. Price action trading attempts to use entry and exit signals that have an edge by creating good risk/reward ratios that lead to profitable trading with wins that add up to more than losses.
Price action trading is the opposite of using opinions, predictions, and emotions to make trading decisions. Price action trading is the process of using what is happening in the market to determine whether you buy, sell, or hold a position.
There are four primary dynamics in price action trading:
1. An entry signal based on a breakout, breakdown, or technical indicator.
2. A stop loss set at the price level a trade should not go if it is going to work out.
3. A trailing stop that moves up a stop loss to lock in profits if a winning trade reverses.
4. A profit target on where a maximum reward will be locked in if the price level is reached.
Whether it is pure price action itself or technical indicators that are derivatives of price action, this is the process of making decisions based on reactive technical analysis not predictive technical analysis.
Price action traders can use chart patterns, candlesticks, or backtested data to plan their trades and trade their plans.