Forgive my absence over the last few months. I've been extremely busy servicing institutional clients, however I wanted to share a few observations and thoughts on the macro front.
1) USD / $DXY - In January we were sellers of dollar strength, seeking reversal at 110.12 to 110.31 in $DXY. A high of 110.17 has since led to an impulse wave down, and we believe we've now entered a medium term to long term dollar bear market. On the downside we're seeking 99.57- at a bare minimum, with downside attractions of 94 / 93 if the decline proves to be wave 'C', and 88 +/- 1 (initially) if the decline proves to be a 3rd wave. Attached are our published charts from January and current / updated work.
...continued
5) Cryptocurrencies - The wave '4' consolidation in Bitcoin remains in development off the 108.2k December high. Under one scenario whilst the rising lows remain in effect, we can make the case that we're in the latter states of a triangle that should lead to a 5th wave breakout in the near term. If we break the higher lows then we would contend wave '4' is morphing into a flat, which may take us to 82.2k to 80k +/- (back to pitch on the daily? 38.2% Fibo. intersect = March 24th) before a resolve higher in the 5th wave. Beyond that on the weekly chart, wave '5' objectives are tentative at 125k +/- 5k (until wave '4' is secured and we're able to more confidently project the upside), although we can't dismiss as high as 140k +/- 10k. Wave '5' completion should then lead to medium term exhaustion and trend reversal, and a retest of 50k +/- before a more significant rise materializes.
Finally, for my institutional followers, if you like what you see and believe our work can add value to your process, please feel free to reach out for more information, and I would be happy to send you a portfolio of our work. For individual investors / retail traders, I'll be sure to post an update as we get closer to the peak in the S&P and Bitcoin. Take care and Happy 2025.
...continued
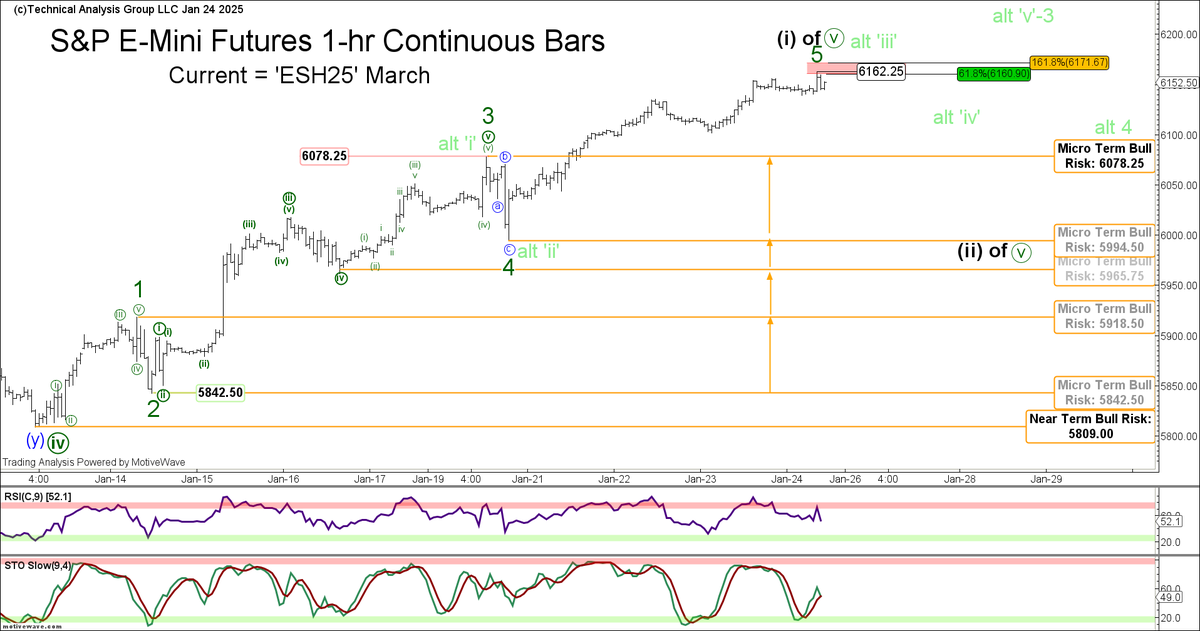
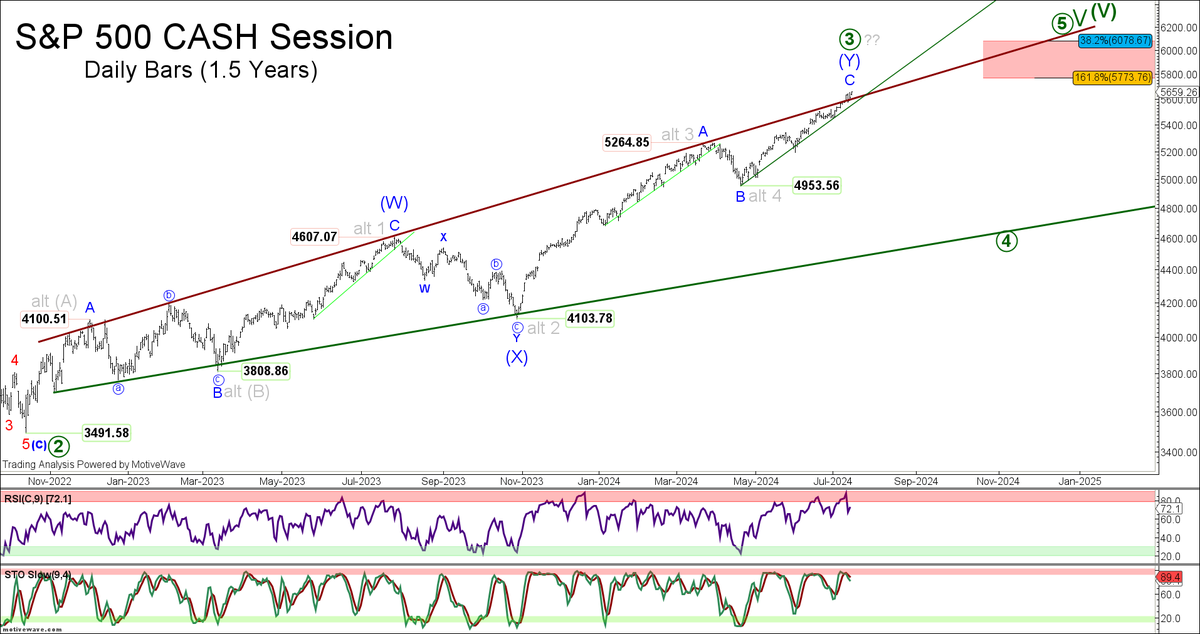
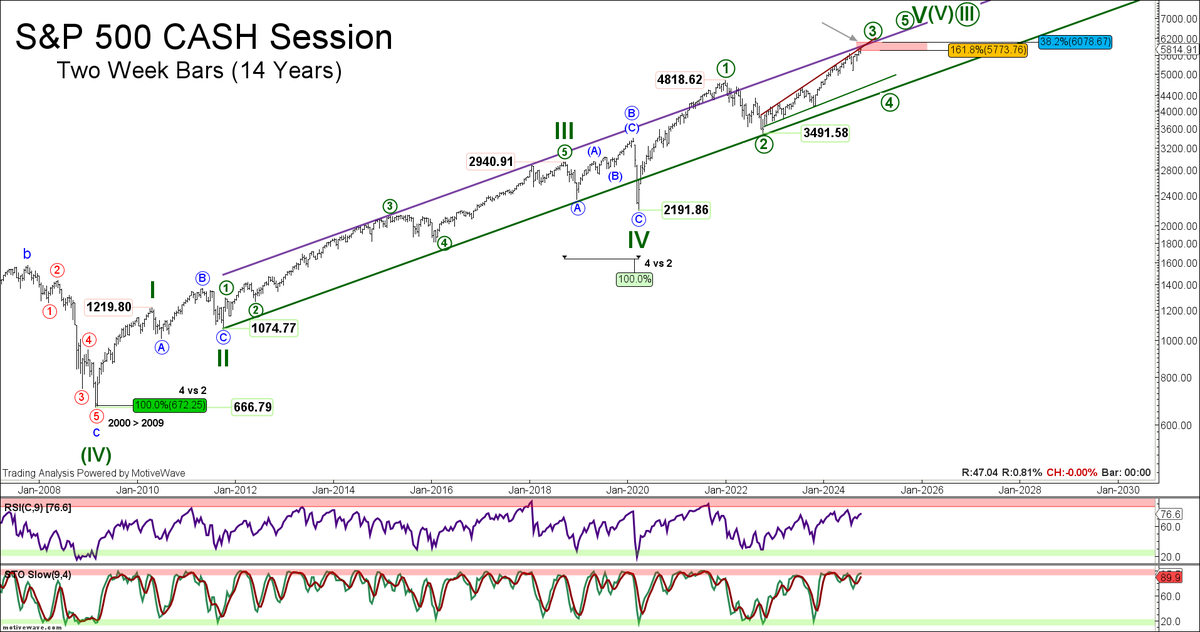
4) Stocks - In US Equities we were able to capture the January 13th S&P low, moving risk up 5 times in our 'ESH25' futures trade before taking profits on January 24th to allow for a move down in wave '2' to 5950 +/-. Pattern developments that followed have been murky at best, although we're now back to the top of the local channel in cash, and whilst above 6003.00 (cash) we're seeking upside continuation to 6350 +/-, and can't dismiss 6550 / 6600 +/- before exhaustion and trend reversal. Beyond that in the medium term, we continue to believe we're maturing in a complex 3rd wave, as part of an overall ending diagonal in development off the 2191.86 Covid low (per Prechter's ruleset, 1-3-5 of an ending diagonal -must- subdivide as a ZigZag, yet he also believes the diagonal ruleset is loose and needs further study and clarification). We're currently trading just below a confluence of key geometric resistance, including rising pitch on the daily / weekly charts that we have never successfully broken, and expect a significant reversal to materialize in the near future (likely from levels cited above).
...continued
3) US Fixed Income - As for rates, we believe the positive correlation between a strengthening dollar and higher rates will being to breakdown. As a bottom line on the long end of the curve we expect a retest / break 5.02%+ in the US10YY before a larger multi-year yield pullback becomes a reality. On the short end of the curve in the US2YY we closed our long TU positions into yield weakness in 3 parts on 8/4, 9/15, and 9/26, capturing the 3.50% yield low to re-engage short TU for a return to higher yields. Here, whilst 4.15% / 4.08% contains yield weakness, we expect a rise above the current 4.42% 2025 high to date, up to (tentatively) 5.00% +/-. We would be unable to claim this year's 4.42% high is the end of the rise in yield from 3.50%...
...continued
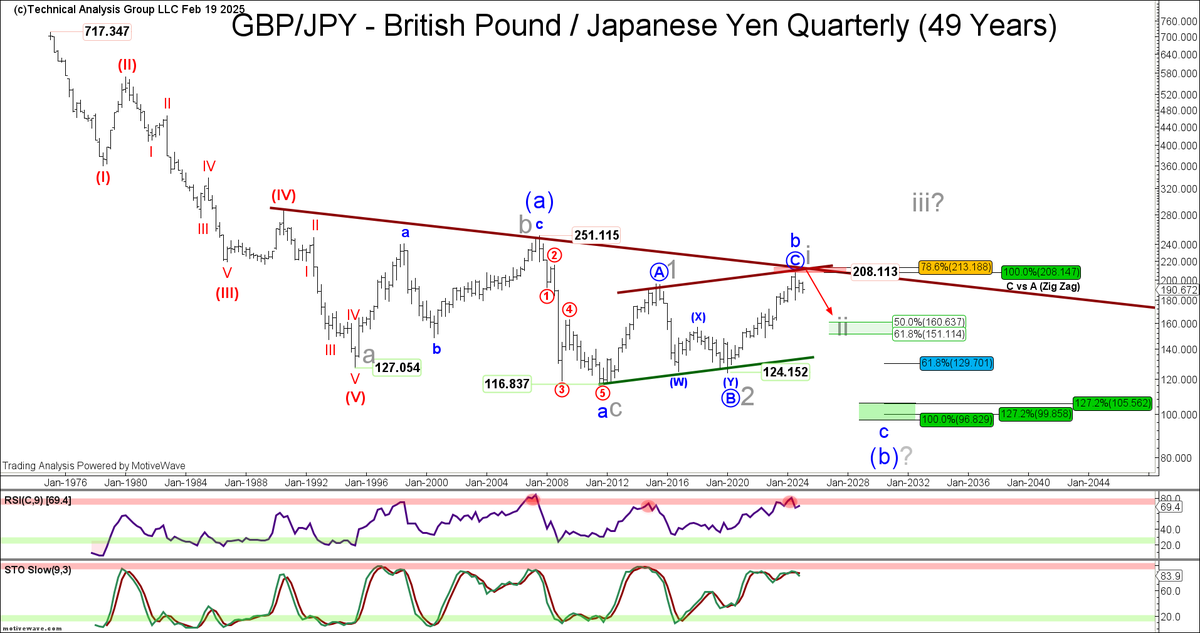
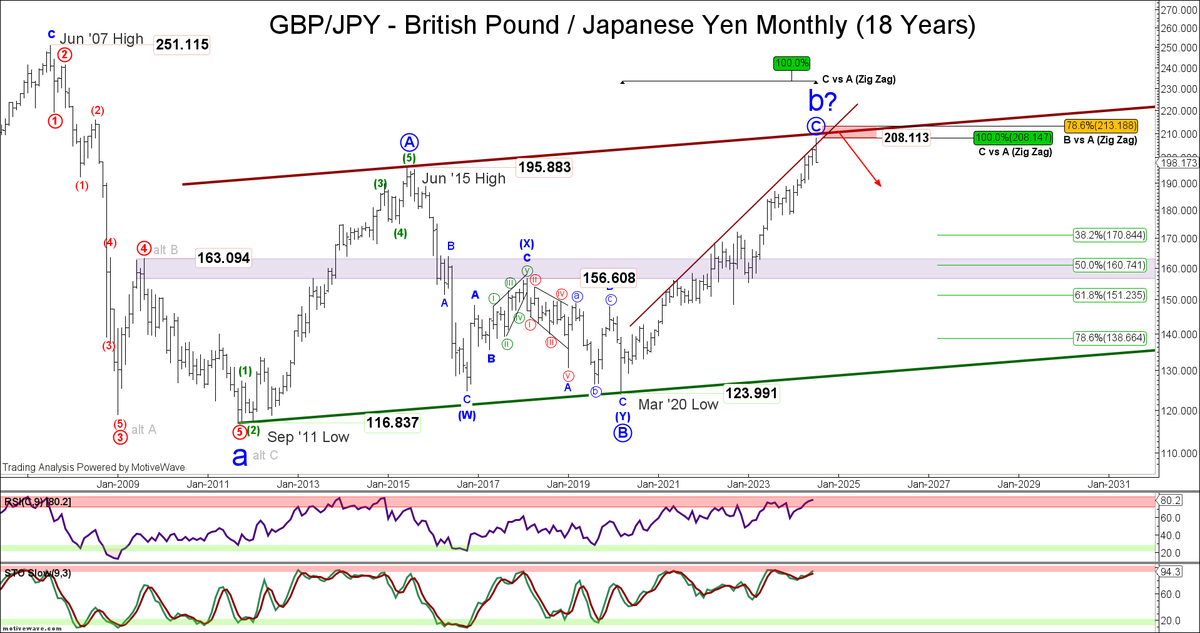
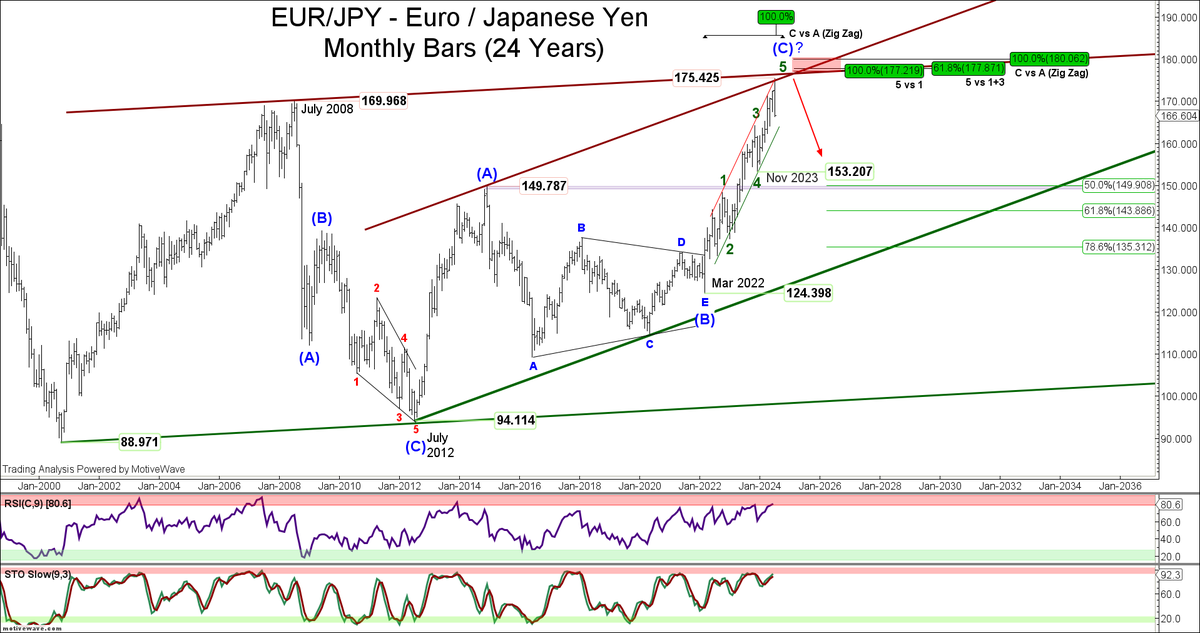
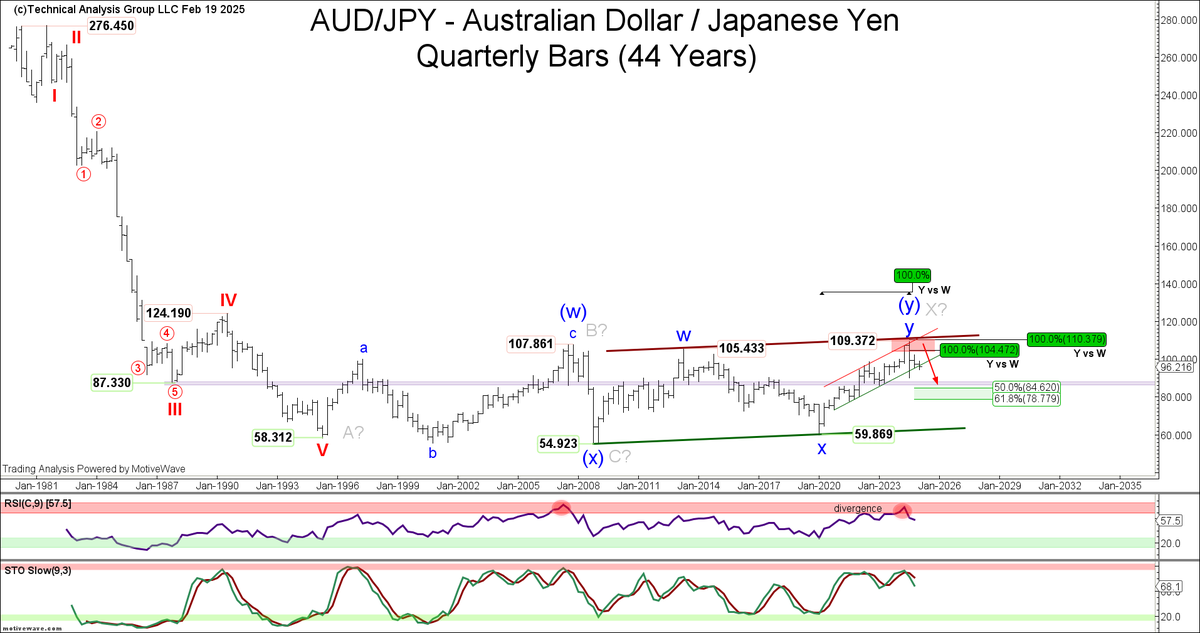
2) $JPY - As for the YEN, we remain medium term to long term bullish. All major crosses including USD/JPY, EUR/JPY, GBP/JPY and AUD/JPY left trend-establishing / impulsive declines from last year's highs into the August / summer lows. We believe last year's highs represent significant tops, levels we will likely not see again in the near future. If so a strengthening YEN will be a significant headwind for risk assets (carry trade, or lack thereof in this instance).
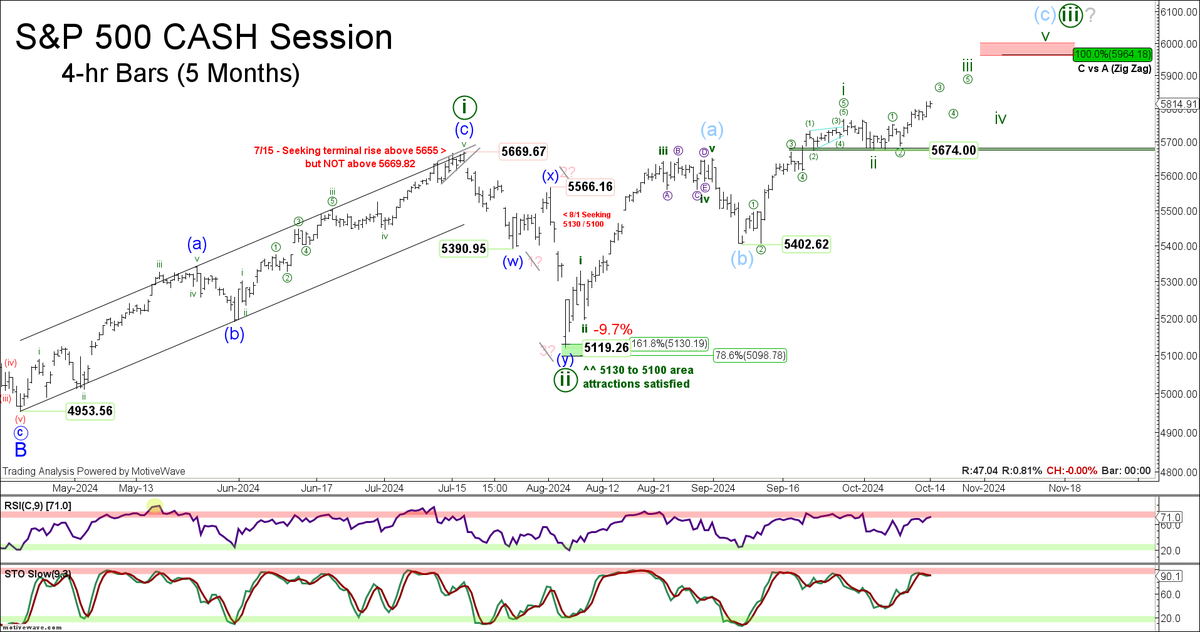
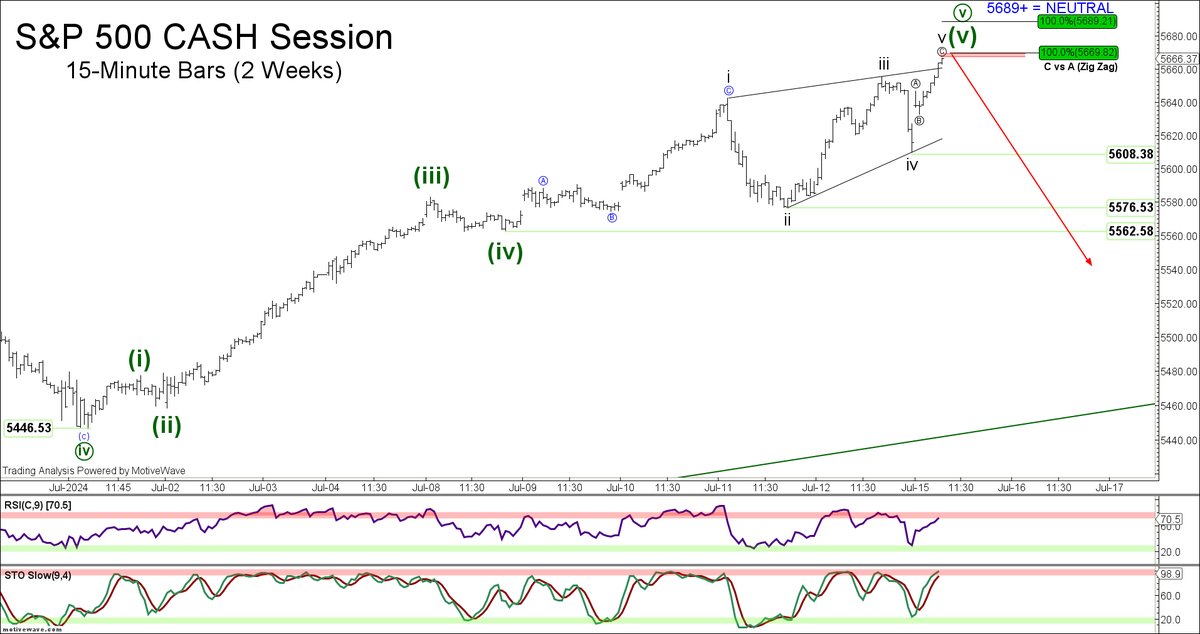
On July 15th, I identified an ending diagonal formation on the 15-minute chart (suggesting trend reversal was imminent), seeking a near term top above 5655, but not above 5669.82. At the time, I was looking for as much as a -15% ‘corrective’ decline in wave ‘4’ of a larger diagonal in development off the March 2020 ‘COVID’ low, that led to additional upside. The S&P subsequently topped on July 16th at 5669.67, leading to a -9.7% decline, bottoming on August 5th at 5119.26, directly into my 5130 / 5100 downside ‘attraction’ zone. While I’m pleased to have predictively captured the near 10% selloff, the decline failed to meet the desired 4818 overlap level before reversing to new highs. Therefore I was wrong about the idea that the mid-July high was the end of diagonal wave ‘3’. Which is fine, and frankly a great illustration as to just how tricky diagonal patterns can be… They are after all a ‘timing’ pattern, and probably one of if not the least predictable of all the wave-based patterns.
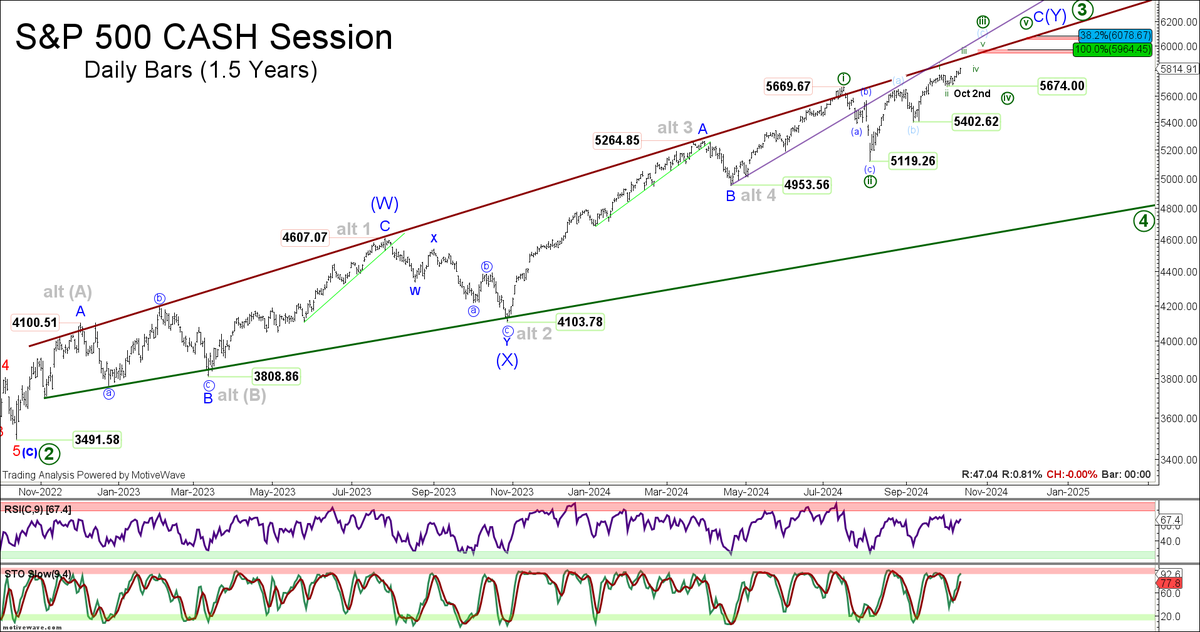
Moving forward, as a bottom line, I continue to see evidence across equity markets that suggests we are in fact trading inside of an ending diagonal. If you’re honest with yourself and disciplined about your application of the wave principle, you simply can’t label the rise off the October ‘22 low as an ‘impulsive’ = ‘trend-establishing’ sequence. It just doesn’t fit. It’s filled with 3-wave sequences, and the only way to conclude it’s impulsive is to either disregard the fractal nature of the wave principle and allow for extreme degree violations, or alternatively suggest the preceding correction ended with an 8%+ truncation in the most unusual of ways (one that has never been documented before, to my knowledge). So until we see clearance of rising pitch and the weekly trend channel, I must remain disciplined and call it as I see it.
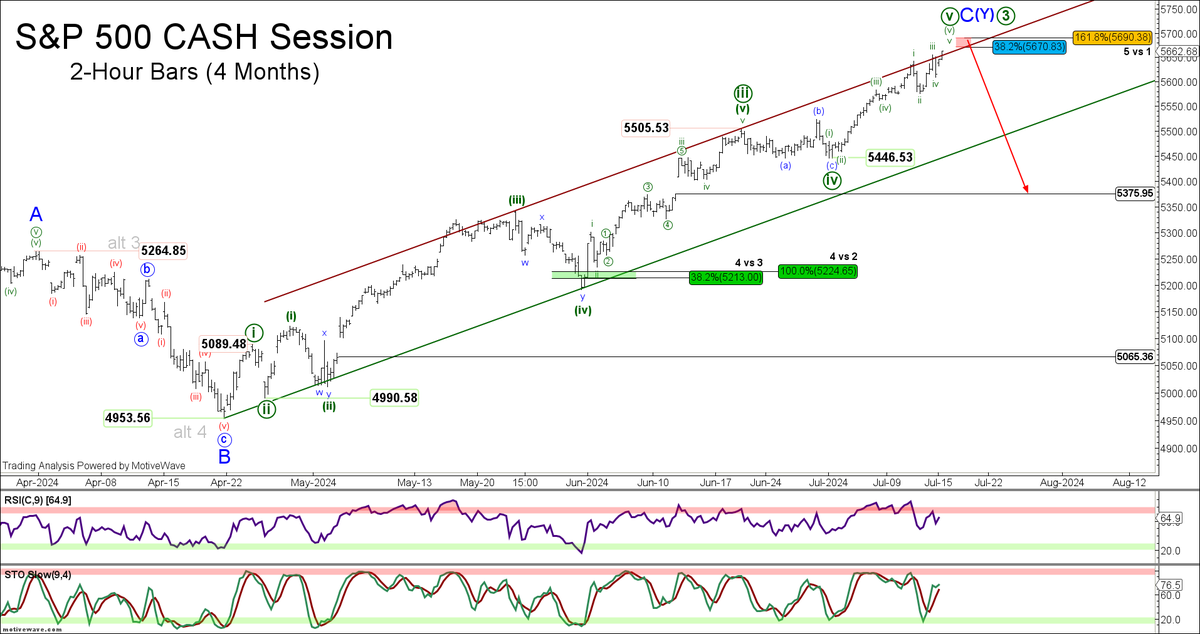
New Analysis = In the near term on the 30-minute chart, we’re approaching a 23 point attraction window in cash above the market at 5823 to 5846 . I expect this zone to lead to a multi-day pullback, and maintain the ‘high ground’ above 5760 in a 4th wave. In order to then continue higher, we must not break 5753. On the 4-hr chart, we’ll likely face an additional counter-trend 4th wave pullback, prior to reaching equality at 5965. On the daily chart, if my analysis is correct, 5965 to 6000 should then yield a pullback that takes us back below the 5669.67 July high, followed by a terminal rise to new highs that completes wave ‘3’ of the diagonal. This entire progression is likely to be capped by rising red and or purple pitch / trendline resistance on the daily chart. If so, we’ll likely enter diagonal wave ‘4’ at the end of this year or early next, which should carry below 4818 at a bare minimum. Wave ‘5’ will then lead to new highs, and conclude sometime in Q3 of ‘25.
One of the key macro forces behind the current decline in equities (and risk assets in general) is the reversal that’s underway in the YEN. Here are a few of the charts that our team sent to our institutional clients on July 24th, suggesting medium to long term top(s) (low in the YEN) had been formed in USD/JPY, EUR/JPY, GBP/JPY, AUD/JPY and CHF/JPY (as well as an overlay generated last week showing the correlation between the strengthening YEN and the decline in the S&P). In USD/JPY as an example, we contend this year’s 161.948 high represents a significant medium to long term top, a level we will likely not see again for several years. On the downside, we believe 127 +/- 1 is a conservative objective.
Given price action in equity futures this morning, we'll likely meet wave ‘3’ downside attractions in the S&P this week. The question now becomes, will a corrective rally in USD EUR GBP AUD and CHF lead to new 5th wave highs above 5669 in the S&P diagonal, prior to the larger market correction we seek? Or did this year’s 5669.67 S&P cash high complete 5-waves off the 2009 low? To be determined. In analyzing the top 10 S&P stocks, we can make the case for either scenario. Apple as an example favors the ending diagonal, whereas market leaders such as Nvidia suggest the more significant high has been formed.
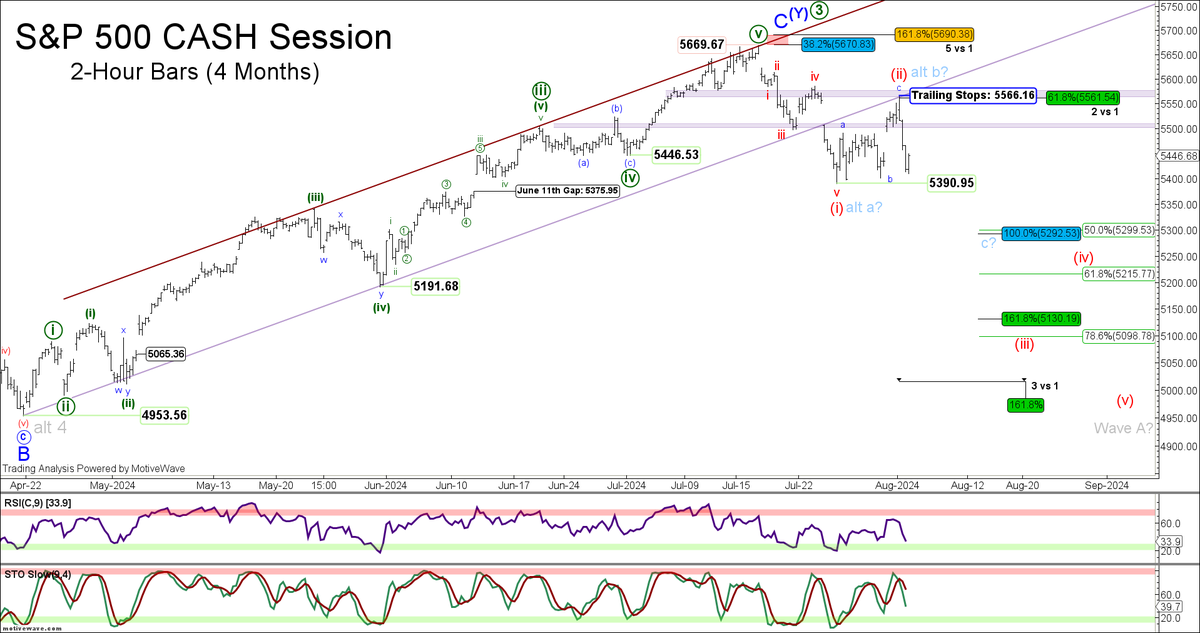
In the S&P 500, 5400 area attractions contained weakness, into last week's low of 5390.95. The 5390.95 low has since led to a 'corrective' 3-leg pullback, capped by ascending pitch on the 2-hr chart, retracing just beyond 61.8% of the decline to-date.
Trailing stops of 5585.34 remained intact / were never triggered, which now move down to today's rebound high / wave '2' or 'B' completion point = 5566.16. Whilst below I expect further weakness and new lows below 5390.95 at a bare minimum. In the nano / micro term, following today's -155pt decline, I would be surprised to see a retracement that breaks 5495 / 5500 / 5505.
On the downside, if the decline proves to be a 3rd wave (preferred), then I expect near term continuation to 5215 / 5200, with overall wave '3' attractions located at 5130 to 5100 +/-.
If alternatively the decline proves to be wave 'C' of a 3-legged correction, then downside may be limited to 5300 (broadly speaking), including equality of Waves 'C' and 'A' at 5292, inline with the 50% retracement of the rise off the April low at 5299. This however does not fit my higher degree wave model, which calls for a multi-month, 2-way pullback back to / below 4818 (bare minimum required overlap, see daily / two week charts).
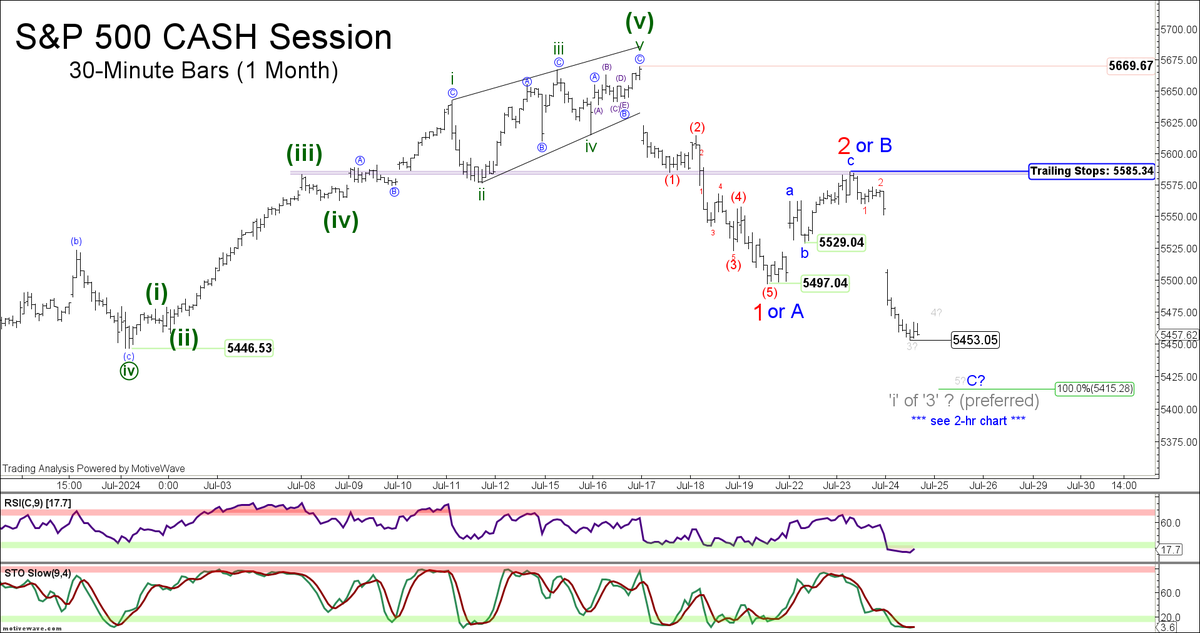
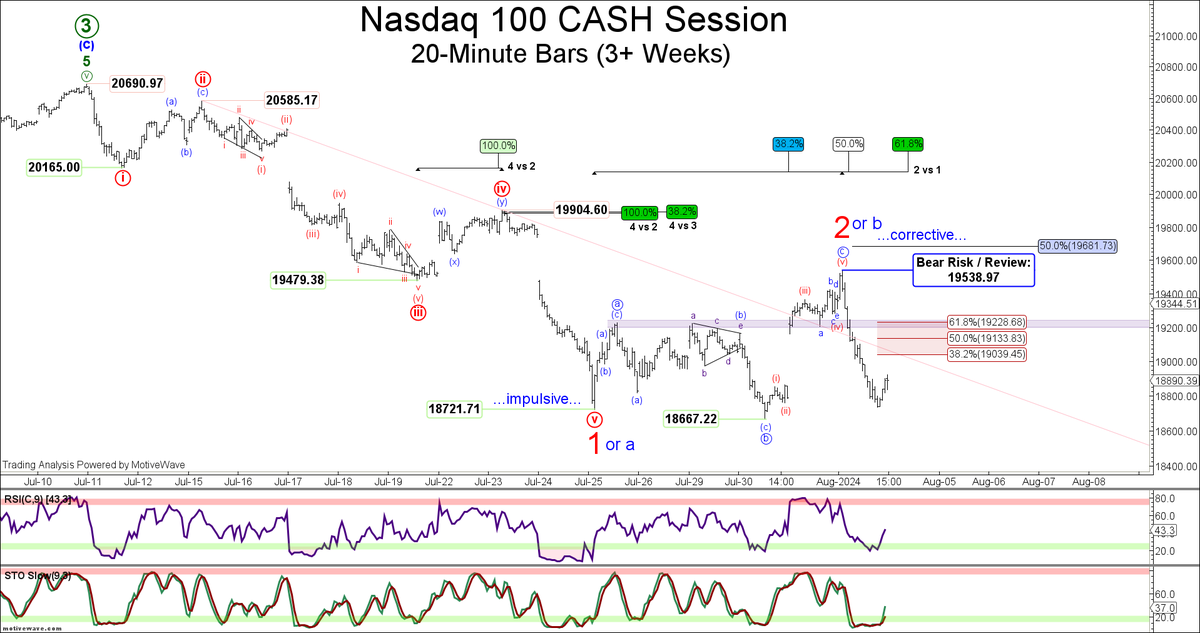
As for the morphed local pattern developments (with 5390.95 completing wave '1' or 'A'), the best explanation can be found in the Nasdaq 100, which completed 5-waves down to last week's low, followed by a similar corrective 3-leg FLAT, deemed complete into today's high = 19,538.97 (seller risk).
New S&P low to-date = 5453.05, down -3.8% from the sought-after 5th wave high. Trailing stops now move down from 5614.05 to 5585.34, with next downside attractions in wave 'C' = 5415 to 5400 +/-, followed by 5315 to 5300 if the decline proves to be a 3rd wave (preferred).
Beyond that, if the overall decline from this year's high unfolds as a trend-establishing / 5-wave sequence, confidence would then rise in terms of the larger ending diagonal that calls for a multi-month decline to 4818- (see post from July 15th for additional context).
Whereas alternatively, should 5415 to 5400 area contain weakness, I would then view a rise above 5585.34 as exposing this year's high, thus confirming the decline as a near term counter-trend corrective pullback.
@Hheartsurgeon Let me get back to you on this. My apologies for not being as responsive as I once was on twitter. I wish I had the time to engage / respond more actively.
Wave '5' in the S&P (cash) deemed complete into yesterday's high = 5669.67 (now bear / seller RISK), just -0.15 below the equality projection that I expected would cap the upside (predictively bearish call). I contend the sought-after reversal is now underway. See quoted post from July 15th for additional context. No new nano / micro term coverage to offer at this time.
The whipsaw in the S&P is indicative of a near term ending diagonal of the contracting variety (see 15 minute chart). I now contend reversal is imminent, and do not expect a rise above 5669.82. Above 5689.21 and I move to NEUTRAL. Overall medium term ending diagonal as illustrated on the weekly / daily chart is favored per VIX seasonality, which implies a mid-July reversal and volatility expansion throughout the remainder of Q3.
I'm seeking a -15% +/- decline below 4818 (bare minimum overlap requirement), followed by resumption of the underlying bull trend and new highs into year end.
For those who predictively sold into strength on Monday and Tuesday in the S&P, do know, from a wave principle perspective, we now have either 1) A completed 3-leg correction, or 2) The makings of a new impulsive decline.
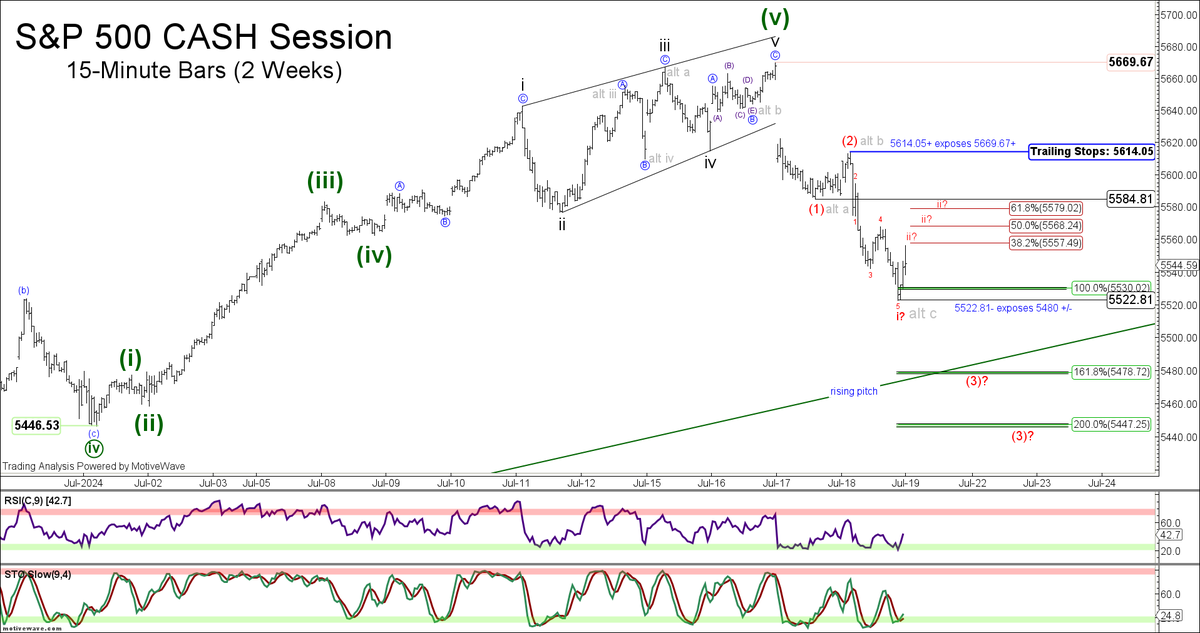
If the latter is true, then we shouldn't trade above 5584.81, and MUST not trade above 5614.05.
I have accordingly removed bear risk at 5669.67, and now maintain trailing stops at 5614.05.
Above 5614.05 will confirm the decline as 'CORRECTIVE' exposing the 5669.67 high and beyond, whereas a break of today's 5522.81 sell-off low will further the downside, exposing the next near term downside attraction level = 5480, which intersects rising pitch in the first half of the session tomorrow (rising to 5500 by Wednesday).
Although I remain bearish, it is worth noting that equality essentially contained weakness on the day, leading to a +33.44pt EOD rally (evidence potentially in favor of the corrective / bullish interpretation, TBD). Either way, after two failed attempts to capture the top of the 5th wave in futures off the April low, I'm happy to add value where I can and should.
Wave '5' in the S&P (cash) deemed complete into yesterday's high = 5669.67 (now bear / seller RISK), just -0.15 below the equality projection that I expected would cap the upside (predictively bearish call). I contend the sought-after reversal is now underway. See quoted post from July 15th for additional context. No new nano / micro term coverage to offer at this time.
The whipsaw in the S&P is indicative of a near term ending diagonal of the contracting variety (see 15 minute chart). I now contend reversal is imminent, and do not expect a rise above 5669.82. Above 5689.21 and I move to NEUTRAL. Overall medium term ending diagonal as illustrated on the weekly / daily chart is favored per VIX seasonality, which implies a mid-July reversal and volatility expansion throughout the remainder of Q3.
I'm seeking a -15% +/- decline below 4818 (bare minimum overlap requirement), followed by resumption of the underlying bull trend and new highs into year end.
Hey hope all is well. See tweets between March 20th to April 26th. I sold into strength at expected resistance (capped), then on 4/19 advised 'I view current and additional weakness as an opportunity to pare down, and or protect, and or eliminate (tactical trader) short positions'. I then maintained my personal short considering it may be a new impulse down, and on 4/26 advised I closed the remainder of the position (at a profit) following the rise above trailing stops. I've since been quiet (working), while awaiting the next attractive risk / reward trading opportunity. Cheers.
#SP500 $SPX Profits secured above trailing stops = 5089.48 (as advised in yesterday's update).
Although you can count the decline as *impulsive*, that same cannot be said for the Nasdaq 100.
I therefore view the decline to-date in the S&P as either 1) Wave 'W' of a complex correction, which should still make new lows below 4953.56 in wave 'Y', or alternatively 2) All of a near term corrective pullback.
Price is now testing the first potential zone of exhaustion = 5114 +/-, and 5126 +/-, including descending pitch (deemed near term pivotal).
I remain in wait & watch mode = let the market speak.
Have a great weekend :)
@GrandpaSandro I do not. I work for a research business providing technical analysis / strategy for institutional clients. That said, I enjoy sharing what I feel to be useful market turning points / analysis with the general public on twitter, when time allows.
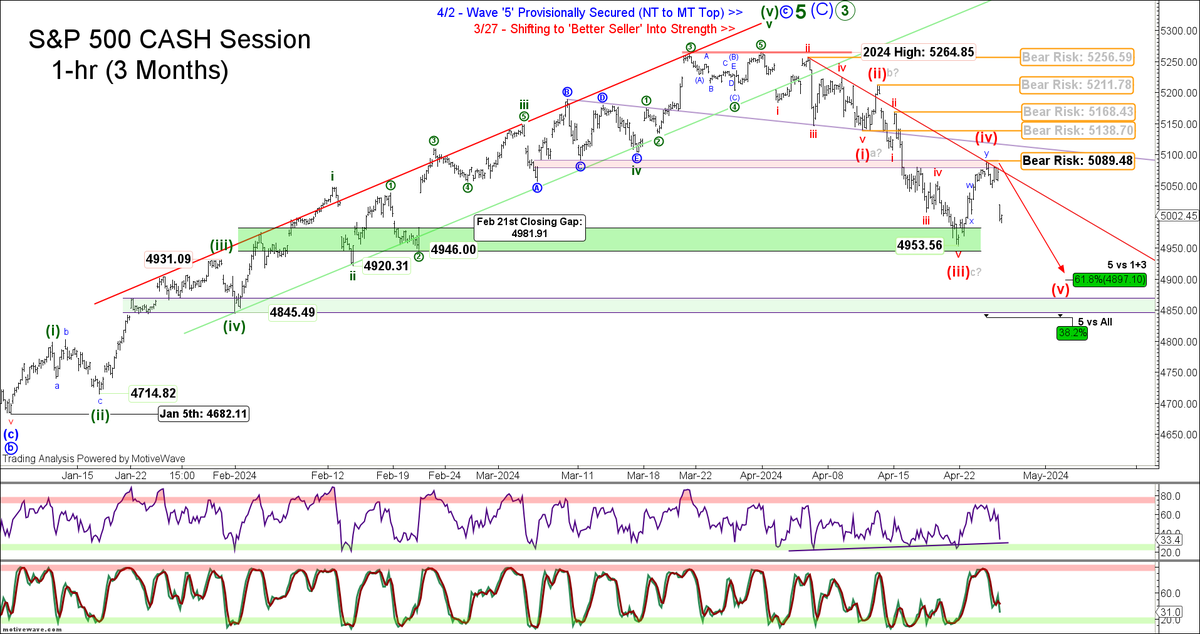
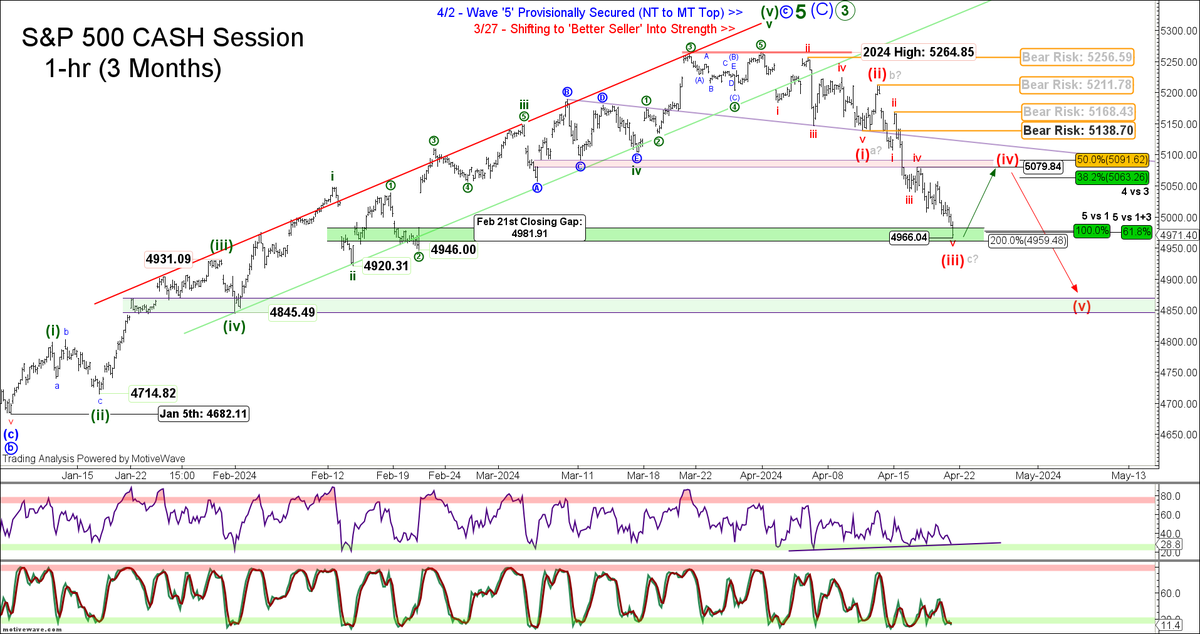
Wave '3' low in #SP500 $SPX captured, leading to the largest pullback in both price and time since wave '2' as expected. For those who predictively sold into strength / resistance = 5260 +/- as per my original call, I now move bear RISK / trailing stops down to 5089.48 (the wave '4' rebound high, capped by cited 5091 +/- 1 area resistance).
Whilst below bear RISK / trailing stops, I seek additional downside in wave '5' below 4953.56 at a bare-minimum, with downside attractions = 4900 +/-. As for the timeframe for wave '5' completion, I note a confluence of both Hurst cycle and Fib-based timing that suggests a low in / around May 7th / 8th. Wave '5' should then lead to the largest pullback in both price and time since this year's high = 5264.85.
If the decline to-date is in fact CORRECTIVE = A-B-C, I'll take profits above 5089.58 and await pattern development.
#SP500 $SPX Down -5.67%, inline with the sought-after -10% to -14% pullback from the high.
I view current and additional weakness as an opportunity to pare down, and or protect, and or eliminate (tactical trader) short positions.
Wave 3 is likely COMPLETE into today's sell-off low = 4966.04! IF so, THEN we must now allow for the largest pullback in both price and time, since peaking in wave '2' at 5211.78 on April 11th.
If the wave '3' low is in place, then wave '4' should not carry above 5063 / 5079 / 5091 +/-, and MUST not carry above bear RISK = 5138.70.
Once wave '4' is deemed complete, I expect further downside in wave '5', into next attractions = 4850 +/-.
@AndrewP99271781 Thank you Andrew. Yes. IF we see a new 5th wave low, I will assume it completes wave 'A' of A-B-C for diagonal wave '4' as per my daily chart.