We will still be covering weather east of the Mississippi! Hoping to expand potentially into new areas to provide better and more up to date info on any weather happening at the time in the Eastern US. We thank you all for your support and hope you continue to enjoy our content.
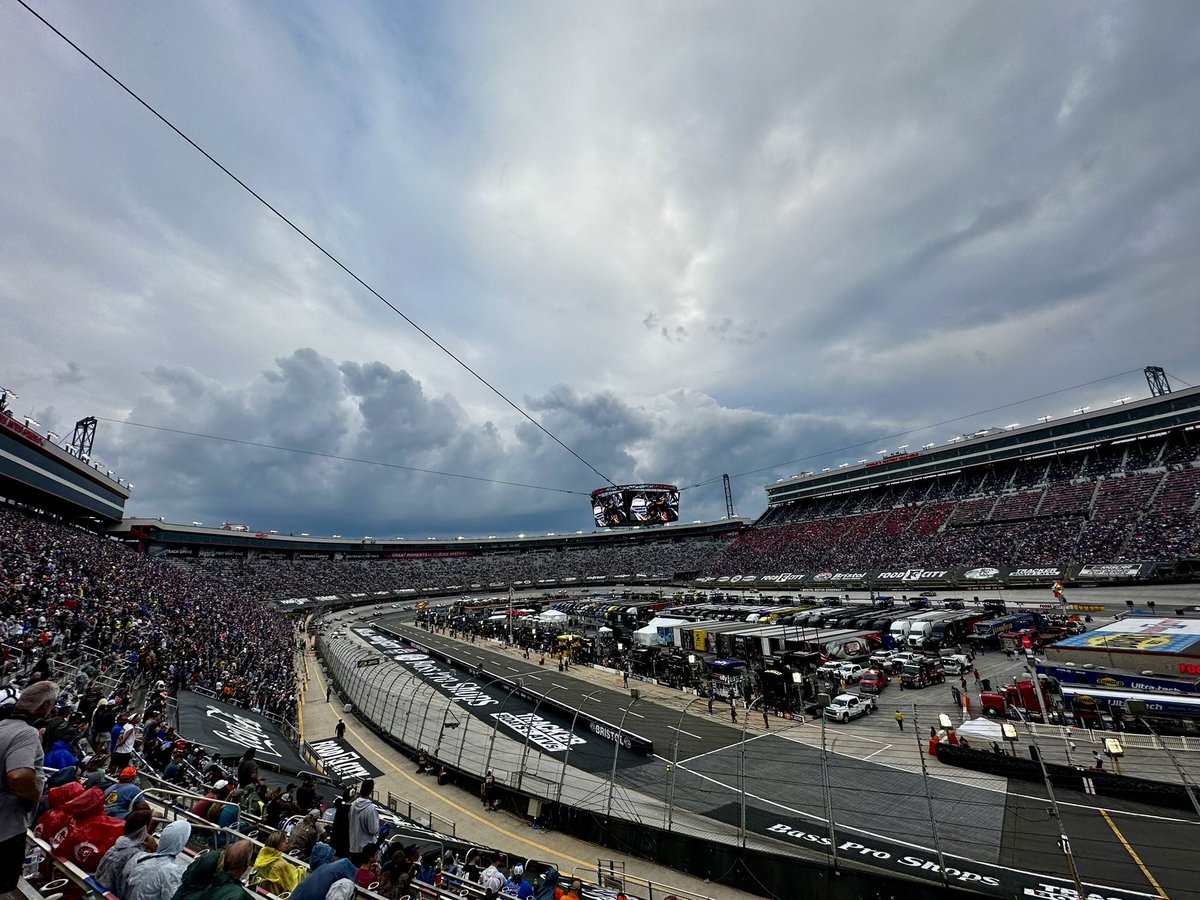
It’s Race Day At Bristol Motor Speedway. It’s Bristol Baby!
Who’s going to the race tonight? Let’s see those hands! ✋
Stay up to date with NASCARWX coverage, including:
• NASCAR Cup Series
• Race Weekend Forecasts
• Track Activity Schedule
• Track Weather Meter
If you’re at the track, camping, traveling to Bristol, or following along from home, NASCARWX has you covered.
Your race weekend information: ⬇️
https://t.co/ICRqtGQh1X
#NASCAR #NASCARWeather #NASCARWX
BRISTOL MOTOR SPEEDWAY RACE WEEKEND INFORMATION (Early Look)
Stay ahead of changing conditions with NASCARWX coverage, including:
• NASCAR Cup Series
• O’Reilly Auto Parts Series
• NASCAR CRAFTSMAN Truck Series
• ARCA Menards Series
• Race Weekend Forecasts
• Track Activity Schedule
• Track Weather Meter
• Live Radar Links
Race fans, campers, travelers, and teams NASCARWX has you covered.
Your race weekend information ⬇️
https://t.co/ICRqtGQh1X
#NASCAR #NASCARWeather #nascarwx
We should be able to get the races in this weekend, but a few storms could cause delays. The main concern is Saturday’s dangerous heat. If you’re attending or part of a race team, stay hydrated and keep cool. We’ll continue monitoring the latest forecast. #nascarweather#nascar
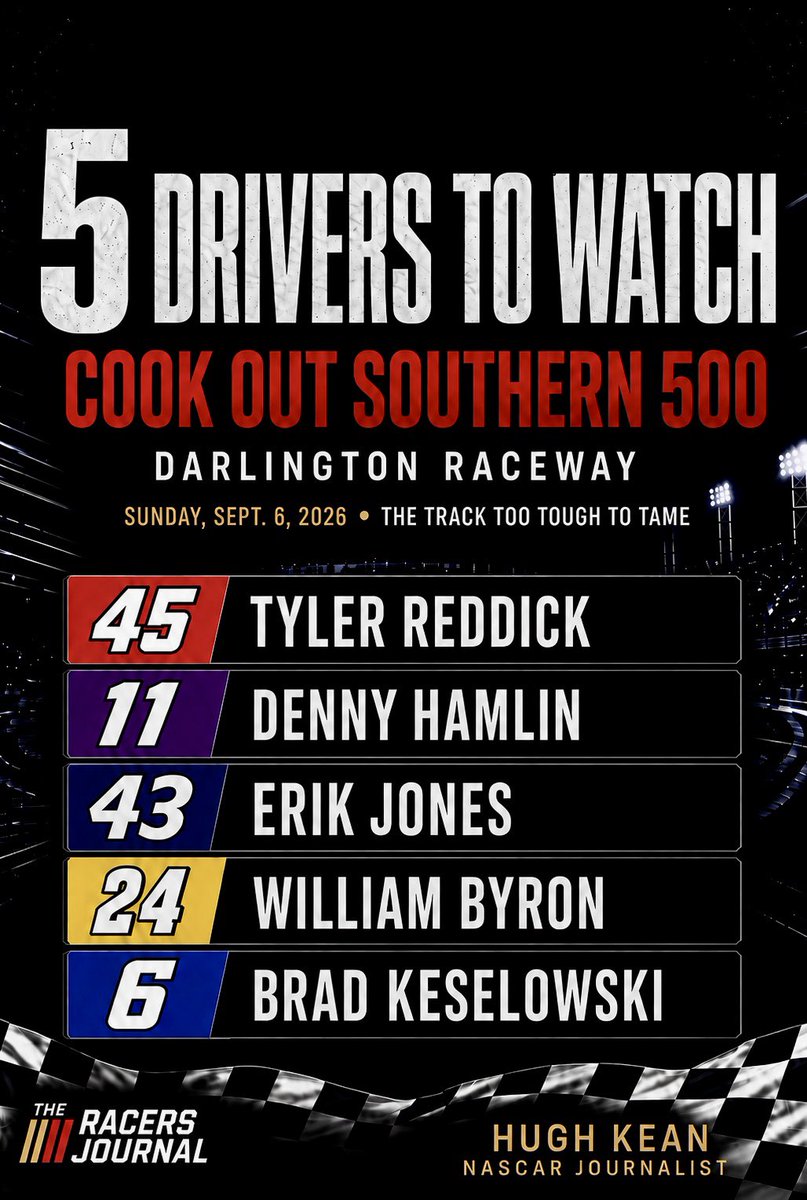
Scotty Powell, Joe Piette Jr, and Hugh Kean break down five drivers to watch heading into the Cook Out Southern 500 at Darlington Raceway.
Who are you watching? Drop your picks in the comments! 🏁
#nascarpicks#nascar
Darlington Race Weekend Information
Stay ahead of changing conditions with race weekend coverage, including:
• NASCAR Cup Series
• O’Reilly Auto Parts Series
• Race Weekend Forecasts
• Area Forecast Discussions
• Track Activity Schedule
• Live Radar Links
• Track Weather Meter
Whether you’re a race fan, camper, traveler, or part of a race team, NASCARWX keeps you informed on the conditions that matter. All Information is manually entered for you!
Your race weekend Information ⬇️
https://t.co/ICRqtGQh1X
#NASCAR #NASCARWeather #NASCARWX
Typical summertime Daytona pattern! We’ll be watching the radar closely this afternoon, but the potential for a washout remains very low. Overall, it’s shaping up to be a great night for racing! #nascar#nascarnews#nascarweather#flwx#cokezero400
COKE ZERO 400 INFORMATION
Stay ahead of changing conditions with race weekend coverage, including:
• NASCAR Cup Series
• Race Weekend Forecasts
• Area Forecast Discussions
• Track Activity Schedule
• Live Radar Links
• Track Weather Meter
Whether you’re a race fan, camper, traveler, or part of a race team, NASCARWX keeps you informed on the conditions that matter.
Your race weekend ⬇️
https://t.co/ICRqtGQh1X
#NASCAR #NASCARWeather #Daytona #DaytonaInternationalSpeedway #NASCARWX #cokezero400
Monitoring a shower as it slowly moves into the vicinity of @DAYTONA. At this time, there are no concerns for the race being canceled or postponed. At worst, this would likely result in a brief weather delay. We’ll continue to monitor conditions closely.
#nascar#nascarweather #flwx
ENSO-neutral is most likely through the late Northern Hemisphere summer 2025 (56% chance in August-October). Thereafter, chances of #LaNina conditions increase into the fall and winter 2025-26, but remain comparable to #ENSO-neutral. https://t.co/5zlzaZ1aZx
We need to explore the claim that "Three once-in-a-lifetime flooding events this last week" is exceptional. I would argue that it's not.
Annual Recurrence Intervals (ARIs) for flooding are *badly* misunderstood. I'm seeing many headlines about multiple 1-in-1000 year events, without an understanding of what that statistically means.
Hopefully this can help clarify:
ARI's are probabilistic, and location dependent. They can be calculated for individual water gauge stations, or individual grid cells on a map.
For example:
- A 1-in-100 year event means that there's a 1% chance of a flood to that level every year, at that exact location.
- A 1-in-1000 year event means that there's a 0.1% chance of a flood to that level every year, at that exact location.
These ARIs do NOT represent the flood probabilities of a region or the whole country. It is ONLY for the exact gauge station or grid cell.
Take North Carolina and the flooding at Chapel Hill last week. Some grid cells per NWS MMRS exceeded the 1-in-1000 ARI for rainfall totals in 24hrs. This means that *for that city block* in Chapel Hill, that much rainfall only had a 0.1% chance of occurring that year. This does NOT mean that the whole state of North Carolina has a 0.1% chance of that rainfall amount. If you look at a broad region, the %s are much, much higher.
Let's look at the larger regions.
There are approximately 11,000 water level gauge stations in the United States. Because there are so many, there's actually a 99.99833% chance* that at least one station will reach the 1-1000 ARI somewhere in the country in a year. Broken down further into weeks, there's a 19.07% chance* that somewhere in the country will reach the 1-1000 ARI in a given week.
*assuming independent operation, and no seasonality.
To summarize: there is a 20% chance that *somewhere* in the country will see a 1-in-1000 event in any given week.
If you apply the same math to the ~500 gauges in North Carolina, there's ~40% chance that somewhere in the state will see a 1-in-1000 event in any given year.
These are EXTREMELY approximate calculations. In real statistical assessments, variables of station relationships (non-independent gauges along the same river systems) and seasonality (summer is warmer and rainier) need to be added. My point is simply this: 1-in-1000 year events across the country are MUCH MORE LIKELY than once every thousand years. It is STATISTICALLY LIKELY to have a number of them in a year, or even a week in the summer.
Very basic math via the local AI is attached below so you can check my work. Again, I'm not trying to make any concrete scientific claims here, or point out exact regional probabilities. I just want to help people understand that, while unfortunate, three 1-in-1000 year events in a week is not as extreme as it may seem.