#FluorescenceFriday
Stunning live imaging of lymphatic & blood vessels in a zebrafish larva "Whole Trunk" from Dr. Rudra Nayan Das's Vascular Diversity Lab (SNIoE Delhi-NCR), captured by Rajan Singh & Rudra Nayan Das at SNIoE's CIF using a Nikon A1R MP Confocal (DST-FIST Funded).
📢 India BioImaging is pleased to share an exciting opportunity for microscopy professionals! 📢
🔬 IISER Berhampur is hiring a Microscopy Facility Manager!
🏛️ Institute: IISER Berhampur
💰 Salary: ₹32,000 - ₹35,000/month
📆 Duration: 4 years (Review after 1 year)
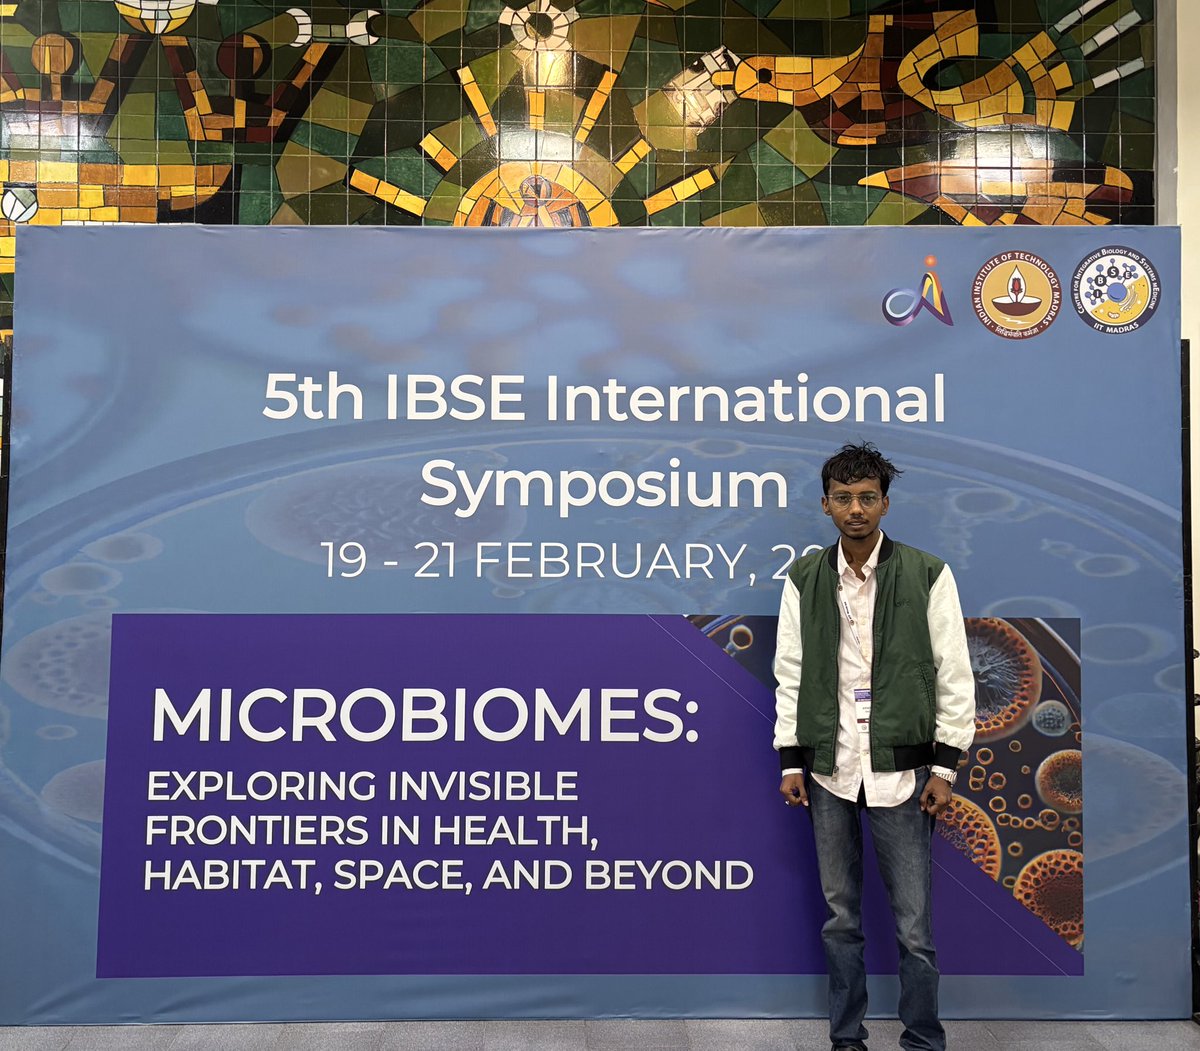
Presented my PhD work on functional inticracy between nitrogen enrichment and organic carbon storage of Indian Sundarbans through lens of genomics and stable isotope at 5th IBSE Symposium @IBSE_IITM@ITMERG1. Thanks @BhadPunyasloke@Anweghosh for the support.
1/ Meet the five new members of the eLife Board of Directors 👇
Today, we welcome Dinesh Natesan, Kamran Naim, Fiona Watt, Huda Zoghbi and Krishnaswamy VijayRaghavan 🎉
https://t.co/0Anm7WCwsz
Psssst! Just a reminder: Registration for the 15th Edition of the #OpticalMicroscopyImaging for #Biosciences Course closes on February 16!
Secure your spot now and dive into cutting-edge #FLIM techniques with us!
📍 ForMore info & registration https://t.co/bRGZokRGIl
@ALM_i3S
Exciting News!
We’re thrilled to launch the official India BioImaging (IBI) X account!
🔬 IBI is a growing community dedicated to advancing bioimaging technologies, training & collaboration across India. Since 2012, we've been connecting top imaging facilities, 1/2
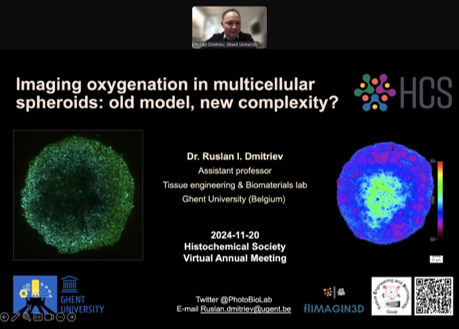
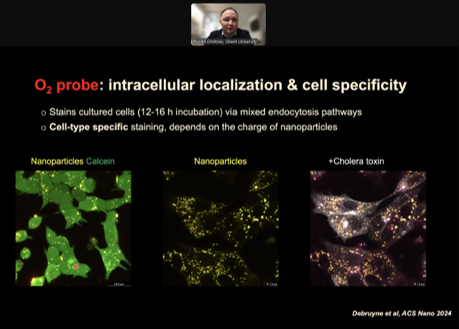
Congrats @PhotoBioLab Ruslan Dmitriev on the early career award from @histochemnews The Histochemical Society! it was great to see you present on your work on #spheroids and #oxygen imaging and #FLIM!
Understanding the difference between Standard Deviation (SD) and Standard Error (SE) is crucial for accurate data interpretation. SD measures the variability within your data, indicating how spread out the individual data points are from the mean.
In contrast, SE measures the uncertainty around the sample mean as an estimate of the population mean. It reflects the precision of the mean, with SE decreasing as the sample size increases, making your estimate more reliable.
The relationship between SD and SE is given by the formula: SE = SD / √(sample size). While SD remains relatively constant with larger samples, SE diminishes, highlighting the reduced uncertainty in the mean estimate.
A common mistake in research is using the “±” notation without specifying whether it refers to SD or SE, leading to potential misinterpretation of the data. Clear distinction is essential for transparency and accuracy in reporting.
Key Takeaways:
• Use SD to describe data variability.
• Use SE to indicate the precision of the mean.
• Always specify which measure you are reporting.
🔬 Are you eager to dive into the world of light microscopy and learn from top-notch microscopists about its essential techniques for life science applications? If that sounds exciting, don’t miss out on this free, in-depth iBiology series! 👉 https://t.co/IgKwGlQKPg
🚨 Job Alert! Please RT 🙏
Fully-funded postdoc positions (4+2 years) available! Join the dynamic, collaborative community @TheCrick with access to top-tier technology platforms and an outstanding postdoc training program.
https://t.co/03Y79cXm0P
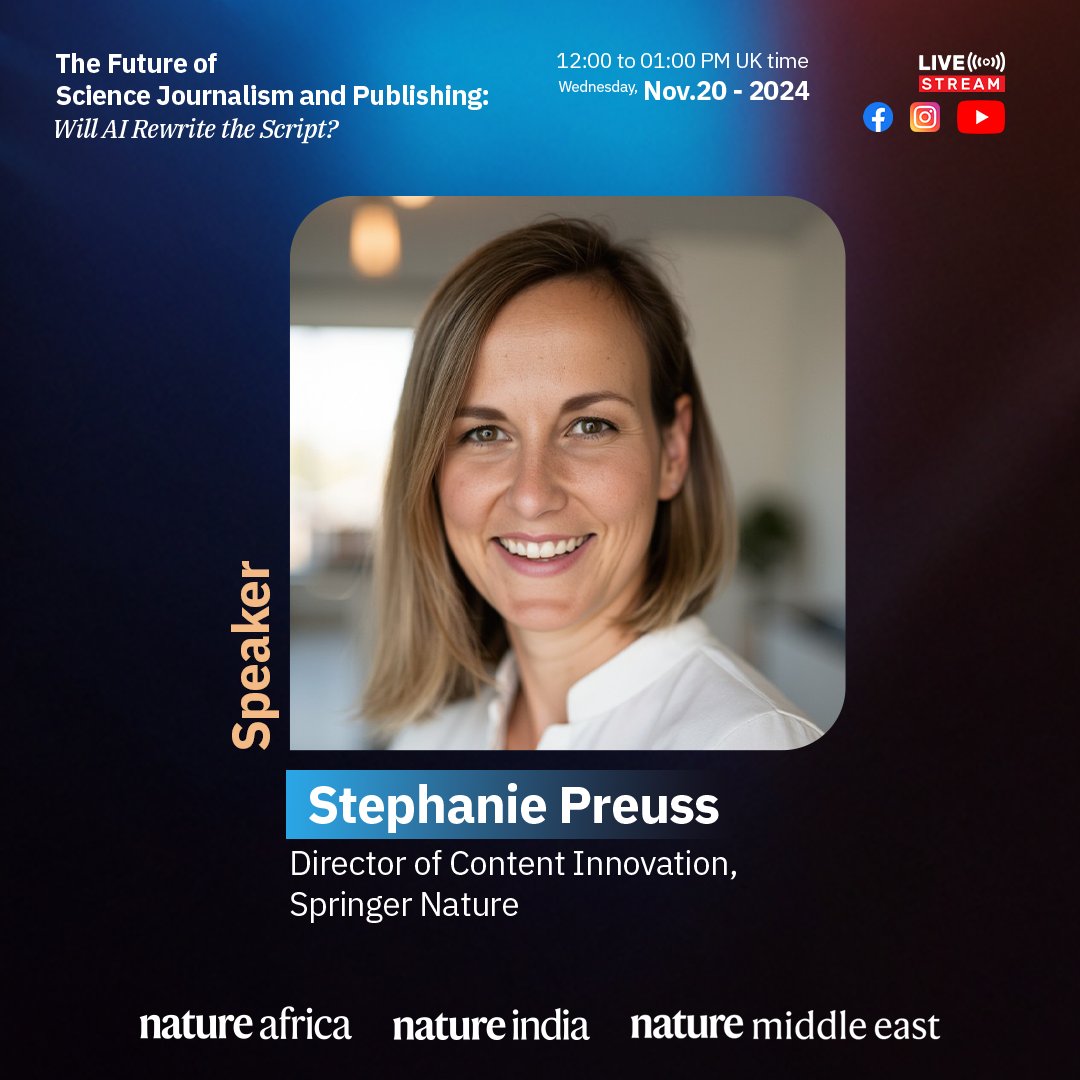
🎙️ Join our experts in "The future of science journalism and publishing: Will AI rewrite the script?" live webinar, as they discuss AI-driven editorial tools, accessibility in research, and more.
📅 Nov. 20 - 2024
🕔 12:00 to 01:00 PM UK time
@natAfrica1@NatMiddleEast