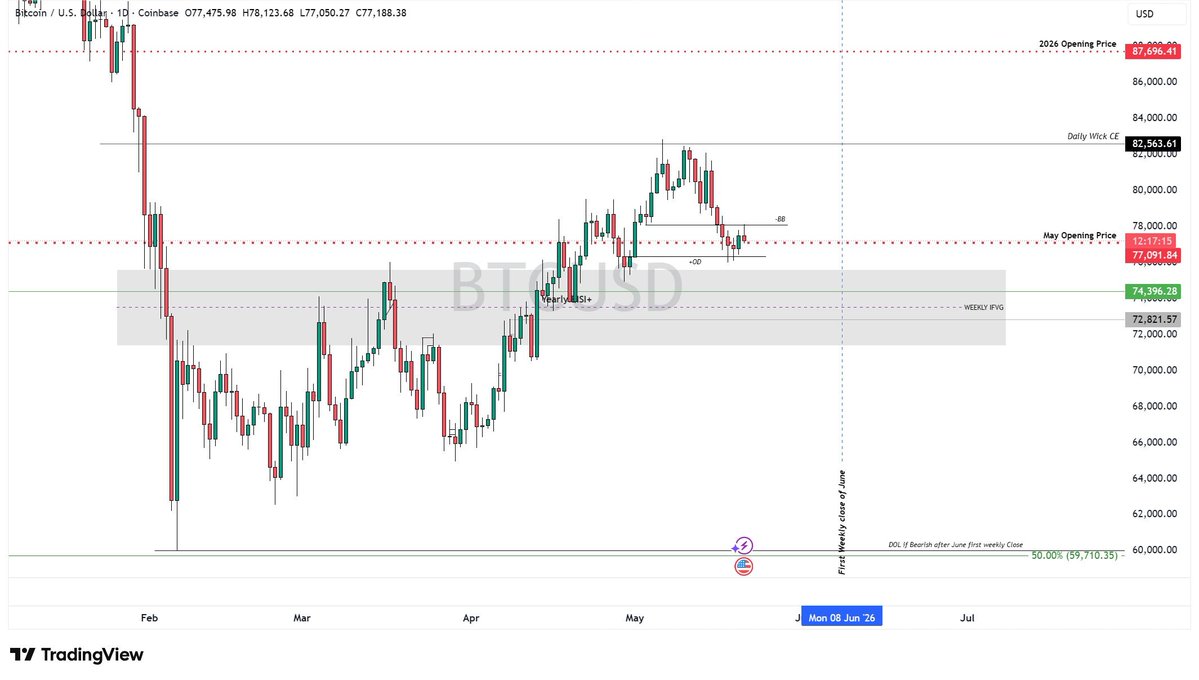
$BTC is finally showing some early signs of recovery. But can it move back above the 87K yearly opening price, or is this simply a retracement before a later move lower to take sell-side liquidity below the February lows?
It’s hard to say given that the current price action has just tapped a premium region on the weekly chart.
So I think it’s safe to say that we’ll likely have a better idea of where this is headed next month. With May very well likely to be bearish in the short-term.
Looking ahead to June,
- I’d watch how the first weekly candle closes relative to May’s opening price plus we already made a weekly bullish inv. SMT with #USDT.D. So a close above it could send us toward 88K+.
- And a stronger close below May Opening, then the more likely we’ll see a move that erases all of April and May’s gains which continues the hunt for sell-side liquidity below 60K.
1 day left.
@4aibsc
That’s it.
Final Run is about to close, and this is literally the last window to move your position.
2X points are still live rankings can still shift but not for long.
After this no catching up.
I’ve been consistent every day… not about to stop now.
If you’re still thinking about it, you’re already late.
https://t.co/MZFbuA33DF
We soon will be integrating social media APIs to catch events that traditional mapping can't.
Here's what that will actually do for your route. 🎯
When there's a rally, festival, or VIP movement - people post about it on Twitter, Instagram, local news feeds.
Our AI scans these in real-time and flags potential traffic disruptions before they show up on traditional maps.
By the time traditional maps know about the road closure from the rally, we've already rerouted you because we caught the social media chatter 20 minutes earlier.
This approach is faster than waiting for official traffic updates.
Your city talks about what's happening in real-timw we just plan to listen to it and route accordingly. 🗺️
The geospatial analytics market is projected to hit $262 billion by 2032, growing at 14.4% annually.
@PathPulse_AI is capturing that market by collecting data no one else has.
70,000+ drivers across 25 countries, 3 million kilometers mapped, 3.91 billion images processed.
We're turning that into intelligence governments and enterprises can actually benefit from - violation detection, infrastructure monitoring, enforcement data, hazard analytics.
The market opportunity is massive.
We're already executing on it with proven traction, paying customers, and a network that grows stronger every day.
This is infrastructure-scale impact happening in real time.
Perpetual futures advertise: No expiry! Trade forever!
Reality: pay or receive funding rate every 8 hours based on position.
Positive funding: longs pay shorts. Negative funding: shorts pay longs.
Sounds balanced until you see funding rates hit 100%+ annualized during volatility.
You're long, paying 0.1% every 8 hours = 109% annually.
Position up 15%, paid 20% in funding.
Net: -5%.
Made money on trade, lost money to funding mechanics.
Platforms profit from funding rate churn.
Users trade against each other, platform collects fees + liquidation revenue.
Funding rate supposed to balance longs/shorts.
Actually: mechanism to extract value from both sides.
At @DigiMaaya we're transparent about funding costs - show annualized rate before position opening, not hidden in fine print discovered when paying.
Should funding rates have caps? Is 200% annualized reasonable? When does "balancing mechanism" become "hidden fee"?
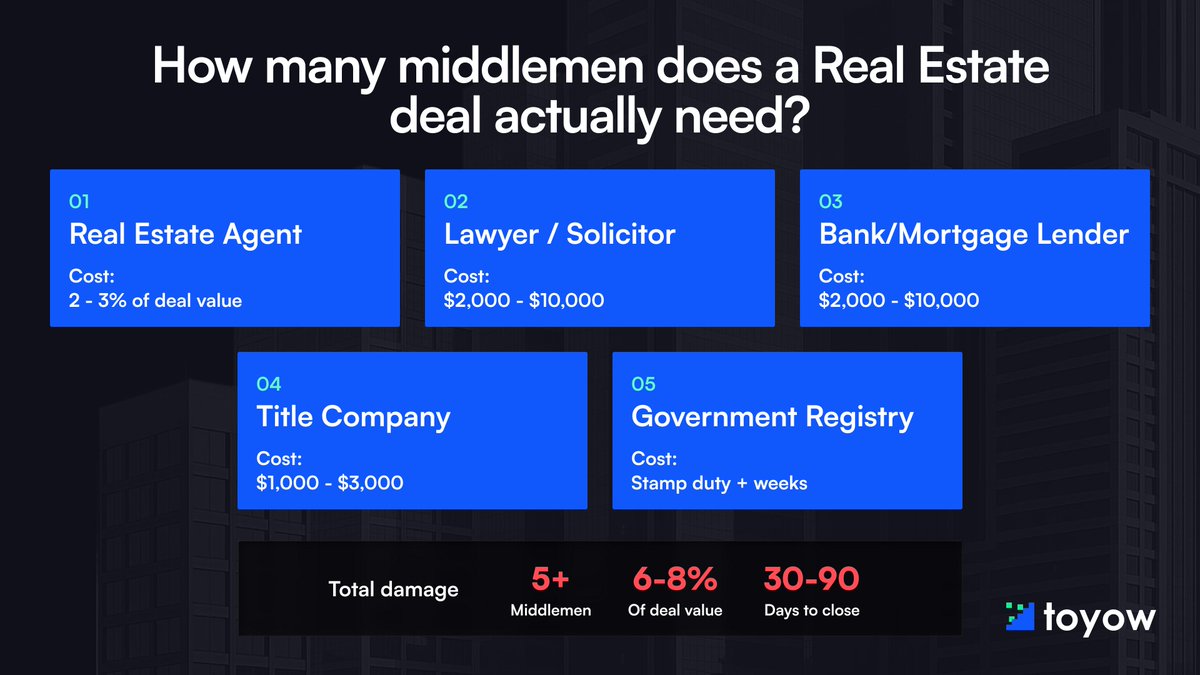
just in case you were wondering why tokenization matters.
5+ middlemen stand between you and owning a real estate investment and every single one charges you.
tokenization fixes this ✊