A month of trading using a new strategy. It's too early to draw conclusions, but the first results are already there. Moreover, as you use it, errors and points for improvement are visible.
The strategy of trading according to the trend, respectively, is to wait for the trend to form and enter the correction. Therefore, first you need to determine the trend, using 1. Wave analysis + cycles, as well as a slightly modified Ichimoku indicator + MACD. Such an analysis is given in a closed section (for subscribers) and, in principle, allows you to more or less understand the medium-term direction. For reinforcement, the analysis of important levels and figures of those is used. analysis and some other indicators 2. When the trend is clear, indicators for finding entry points are used. I don 't publish them .
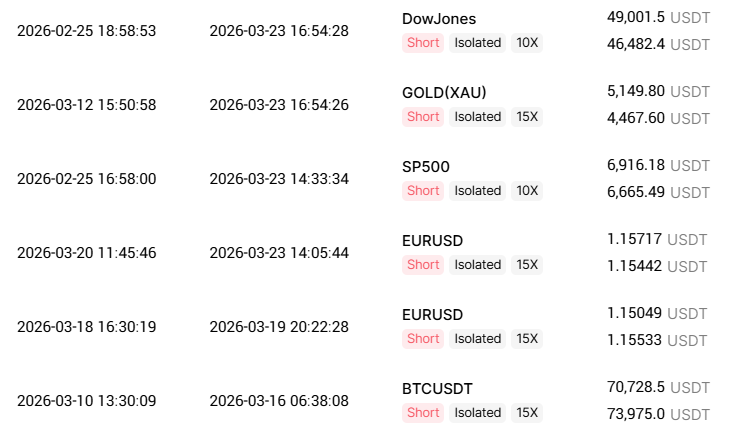
The results are as follows: (the opening/closing dates and the opening/closing price are indicated. )
There were mistakes that I missed the oil. But that was at the very beginning of testing. Also early crypt shorts. Nevertheless, large shorts, in several stages, #gold and #DJ compensated for all the disadvantages and brought them into a good plus. Now the reasons why it was not possible to trade better are clear, and they can be eliminated.
#btc #eurusd #trading
Wealthy investors are heavily positioned in stocks.
Equities now make up 65% of total assets among high-net-worth individuals, marking the highest allocation since December 2021.
This share has climbed 7 percentage points since 2023 and is now only slightly below the 66% peak seen during the 2021 meme stock boom.
For context, equity exposure dropped to 54% during the 2020 pandemic low, while the long-term average stands near 57%.
Meanwhile, cash allocations have fallen to just 10%, the lowest level since September 2018.
High-net-worth investors now hold only 18% of their capital in bonds.
Risk appetite among wealthy investors appears extremely elevated.
The US 30-year Treasury yield is once again challenging the 5.0% level.
On Monday morning, the yield briefly moved above that threshold, reaching 5.03% — a level that has served as a key pressure point for markets over the past two years.
At around 5%, Treasuries become increasingly attractive relative to stocks, drawing capital away from equities while also pushing up borrowing costs for mortgages, corporate debt, and the US government itself.
This level has already been tested twice — in late 2023 and early 2025 — but yields failed to remain above 5% both times. In each case, the S&P 500 came under pressure as yields approached or moved through that zone.
A sustained breakout above 5.0%, especially a move beyond the 2023 high near 5.17%, would send yields into a range not seen in almost 20 years.
The message from the bond market is clear: equities may not be able to ignore this warning much longer.
The U.S. Economic Conditions Index has fallen to its lowest level in roughly 70 years.
Even compared with past crises, the current reading looks extremely weak.
This is another signal that serious problems are building in the U.S. economy.
The U.S. stock market looks extremely overvalued.
The number of large-cap stocks with a P/S ratio above 10 and annual price gains of more than 100% has jumped to around 175 — the highest level since the 2021 meme-stock mania.
Excluding 2021, this is the highest reading since the Dot-Com Bubble burst in 2000.
Even more importantly, the combined market value of these stocks has climbed to a record $2.5 trillion, now accounting for roughly 25% of the entire Russell 3000 market cap.
That share is the highest on record — even above the Dot-Com Bubble peak of around 20%.
The last two times this indicator reached similar extremes, sharp market corrections followed.
The market isn’t just expensive.
It’s Dot-Com Bubble expensive.
This chart is a reminder that liquidity often leads the stock market. US liquidity, shifted forward by 4 months, is once again acting as a leading guide for the S&P 500. Right now, it is clear that after a strong rise, liquidity is starting to turn lower.For the market, this is a signal to be cautious: when a leading indicator begins to weaken, it becomes increasingly difficult to sustain the rally.
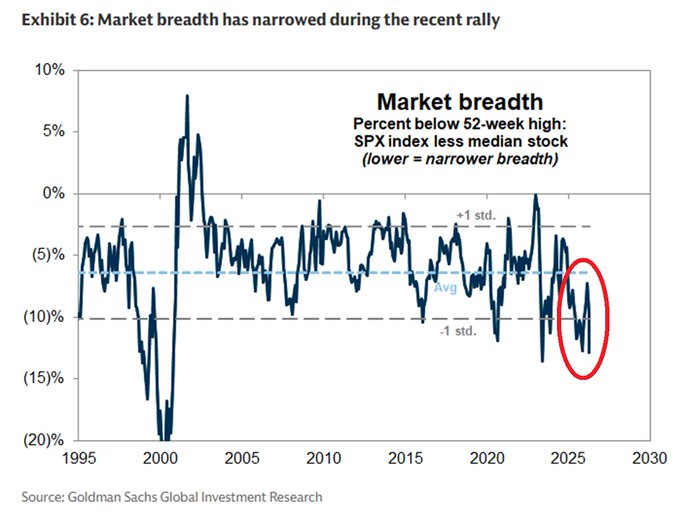
S&P 500 market breadth is currently EXTREMELY WEAK:
The S&P 500 market breadth indicator has fallen to nearly -13%, putting it close to its lowest levels since the 2000 dot-com bubble.
That is also well below the long-term average of around -6%.
Market breadth shows how close the S&P 500 index is to its 52-week high relative to the median stock within the index.
When the reading turns deeply negative, it means the index itself is still trading near its highs, while the average stock remains well below its own peak.
This confirms that the recent gains in the S&P 500 have been driven by only a small group of mega-cap stocks, rather than by broad participation across the index.
A stock market rally without breadth is a rally without real conviction.
Institutions are loading up on call options in a big way.
The latest weekly call/put direction ratio just hit its strongest positive reading in the chart, signaling a sharp swing toward upside bets.
Smart money is getting more aggressive. Bulls are pressing.
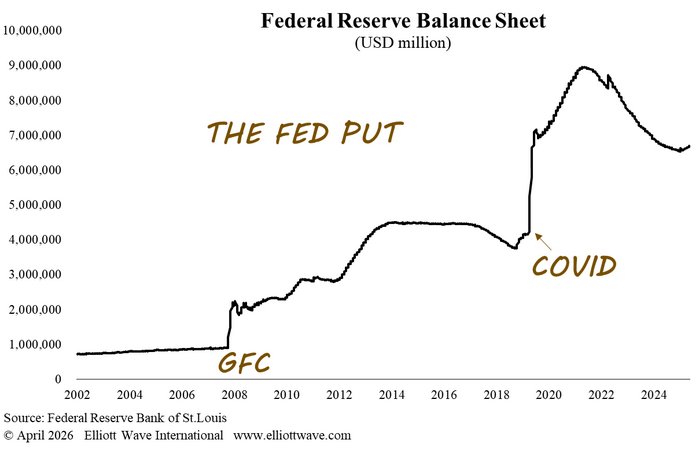
The Fed’s balance sheet surged during the Great Financial Crisis and again during Covid, as it printed money to buy bonds. It reached a peak of nearly $9 trillion in 2022. Since then, the Fed has been trying to shrink it gradually by allowing maturing bonds to roll off without reinvestment. But over the past few months, the balance sheet has started expanding again.
Job openings have plunged since 2022, while the S&P 500 has nearly doubled. That kind of disconnect is far from normal. We saw similar divergences ahead of the 2008 and 2020 downturns, but this time the gap has been widening for four years.
The gap between Wall Street and the real U.S. economy has never been wider.
U.S. consumer sentiment has fallen to 47.6 points, the lowest level on record. At the same time, the S&P 500 is trading just 3% below its all-time high.
Since the 2020 pandemic, consumer sentiment has collapsed by 50%, while the S&P 500 has rallied 205% over the same period.
Inflation, soaring housing costs, and a weakening labor market are putting increasing pressure on ordinary American households. Yet the stock market continues to ignore that weakness.
The problem is that such a divergence rarely lasts forever. Sooner or later, financial markets tend to catch up with the real economy.
If pressure on consumers and the labor market continues to build, the next move may not be a recovery in sentiment, but a decline in equities as markets begin to reflect worsening fundamentals.
That is why the current resilience in the indexes may turn out to be not a sign of strength, but a delayed reaction.
US Consumer Sentiment Crashes to All-Time LowThe University of Michigan Consumer Sentiment Index plunged to 47.6 in April 2026.This is the lowest reading on record since the survey began in 1952 — worse than during the 1970s oil shocks, the 2008-2009 Great Recession, COVID-19, and the 2022 inflation peak (previous low was ~50 in June 2022).Main driver: the war with Iran and surging gas prices above $4 per gallon.Consumer spending makes up ~70% of the US economy. This level of pessimism is a serious red flag. Final April reading comes later this month. #US #Economy #ConsumerSentiment #UMich
The 10Y–2Y yield curve continues to grind lower, but the nature of the flattening has shifted from “bear” flattening, driven by rising short-end rates, to “bull” flattening, driven by stronger demand for long-duration bonds. That suggests the bond market is becoming increasingly cautious on the US growth outlook, even as the Fed continues to stick to a higher-for-longer policy stance.
In other words, the curve is signaling that the fight against inflation is now starting to weigh on economic growth, which argues for reducing risk exposure rather than trying to squeeze out the last bit of upside.
Investors are parking capital in cash at one of the fastest paces in history.
This is a clear sign of a sharp drop in risk appetite: the market is moving into defensive positioning, locking in profits, and favoring liquidity over risk assets amid rising macroeconomic uncertainty.
Blue Owl Capital, once the poster child of the private credit boom, has hit a record low.The stock dropped 1.4% on Monday to close at $8.45, breaking below its previous trough from late 2022. It is now down 68% from its all-time high.The company has recorded losses for eight consecutive months and just suffered its steepest quarterly decline in history.Adding to the pressure, short interest in the stock reached a record high in early March. Investors are increasingly using Blue Owl as a convenient proxy to bet against the entire $1.8–2.0 trillion private credit market.The selloff intensified after the firm was forced to cap redemptions at 5% across two of its funds amid a surge in withdrawal requests. Its technology-focused fund alone saw redemption demands exceed 15% last quarter.The question is no longer whether private credit is facing stress — but how widely and deeply the pain will spread.
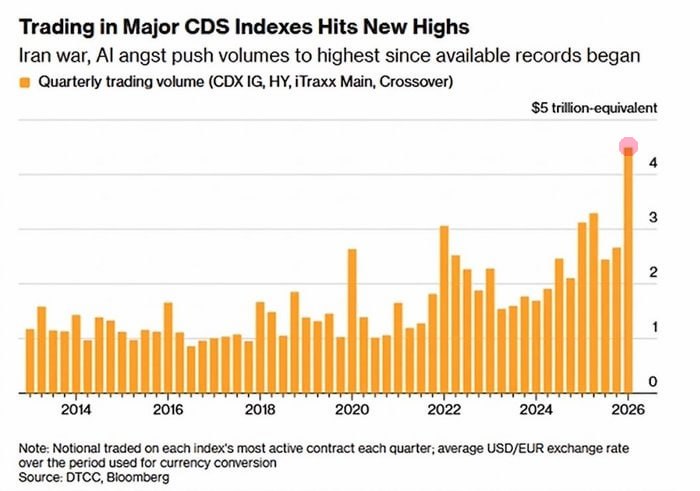
CDS trading volumes (default insurance) on US corporate debt hit record highs.Traders are actively hedging against rising default risks in the corporate sector — BBG (Bloomberg)
Inflation doesn’t arrive as one sudden shock — it moves in cycles. Each retreat creates the illusion that the worst is over, only for a new wave of price pressure to return even harder.
That is why inflation is so destructive: it wears people down psychologically, lulls them into complacency, and then strikes again when confidence starts to rebuild.
In every major inflationary era, those who recognized the pattern early were able to protect their capital and make extraordinary gains. Those who misread it as a temporary problem often paid for that mistake with devastating losses.
Trading volumes in CDS — credit default swaps used as insurance against defaults — on U.S. corporate debt are hitting record highs.
Traders are increasingly rushing to hedge against growing default risks in the corporate sector, signaling rising concern over the credit outlook in the U.S. economy, Bloomberg reports.