Equity4Growth Driven by data. Backed by SEBI. Curated by a SEBI-Registered Research Analyst, it brings you research-backed insights, technical chart setups.
#Banknifty
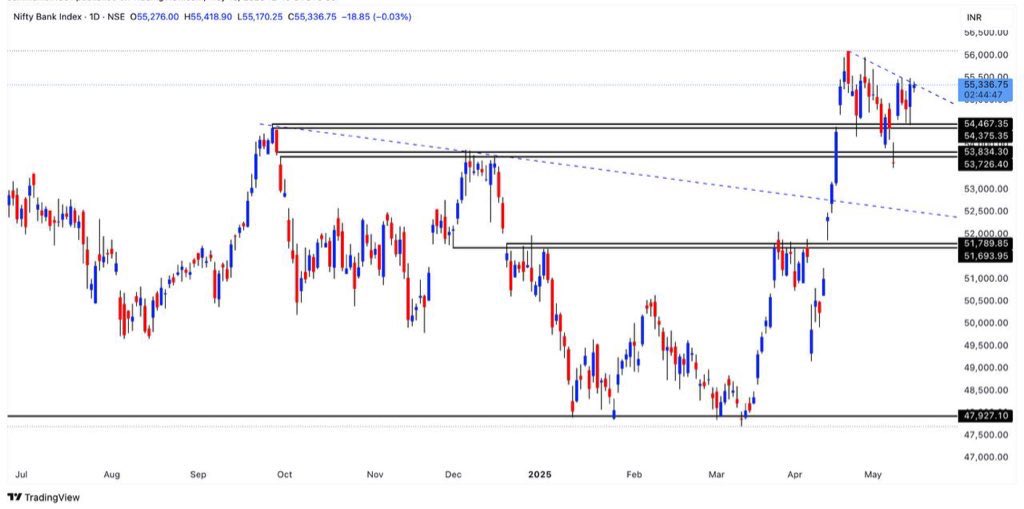
Resistance: 55,500 (breakout point of descending triangle)
Support : 54,375 – 53,726 (previous resistance now acting as support)
Major Support Below: 51,800 – 51,700
As long as price sustains above the 53,800–54,000 demand zone, the structure is bullish
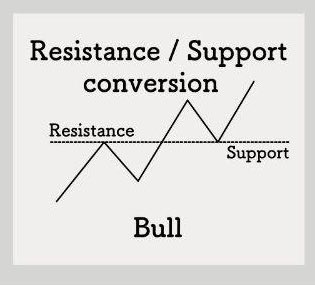
8. Support/Resistance Flip (Bullish Signal)
Old resistance becomes new support after a breakout.
Retest and bounce from the zone = strong continuation signal.
Entry: Retest bounce
Let’s decode 8 powerful chart patterns every trader must know.✅
These are widely used in technical analysis and can give a clear edge when spotted early.
Bookmark this thread!
1/n
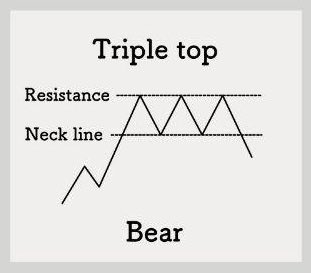
Triple Top (Bearish Reversal)
Opposite of triple bottom.
Three failed attempts to cross resistance signal selling pressure.
Break below neckline = downside confirmation.
Stock:
#UJJIVAN SFB (Weekly Chart Analysis)
Price has given a strong breakout above 40.50 levels after weeks of consolidation near 32–34 support zone.
Recommendation: Buy on dips between 40.50–41.00
Target 1: 58
Target 2: 67
Stoploss: 33.75 (on weekly closing basis)
$NALCO – Multi-Year Breakout Alert
15 years of resistance broken cleanly at ₹135.
Retesting the breakout zone now.
This is where long-term wealth is built.
Accumulate smartly, think big.
#NALCO#Breakout#StockMarketIndia#TechnicalAnalysis