Exciting news — Market Map has been nominated for @TheWebbyAwards in the Best Data Visualization category!
This means it's one of the five best data vis projects submitted, hooray 🎉
https://t.co/D06JLpuP1q
Cosmograph is still the only web-based framework capable of visualizing network graphs and ML embeddings with 1+ million points and way more than a million links.
More about the release here: https://t.co/ewVdmy9huU
Finally launching 🪐 Cosmograph 2.0!
Work with larger datasets, use SQL, open Parquet files, save & share your graphs, integrate with Python or React, ...
All thanks to open source tools like DuckDB, Mosaic, SQLRooms and our https://t.co/YC6q2hDewo
→ https://t.co/yBSx36PTQX
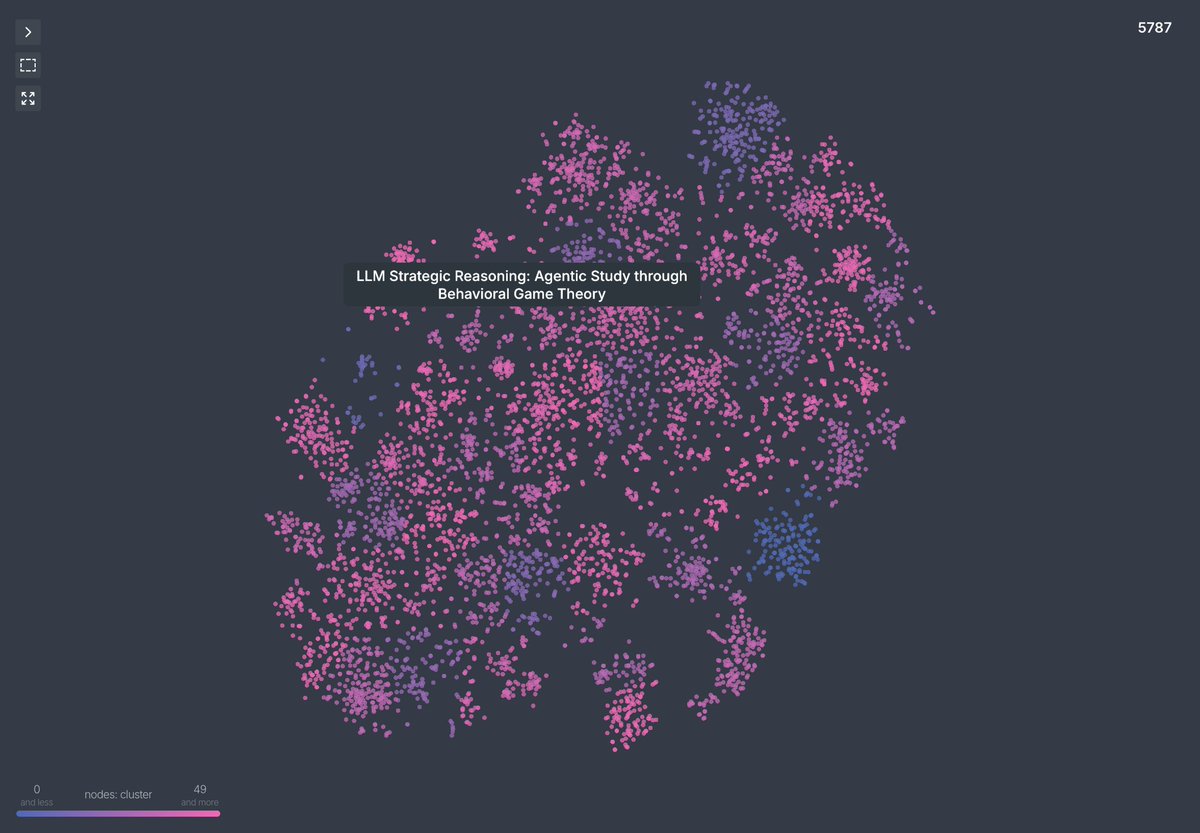
Explore the landscape of 5787 (!) @NeurIPSConf'25 papers.
→ https://t.co/s0AzTGC5pz
- Embeddings (of titles + abstracts) with Qwen3-Embedding-8B
- 2D projection with t-SNE
- Visualization and search over titles, abstracts, keywords, or authors with Cosmograph
Unovis 1.6 is here, lots of updates!
New components:
- Treemap (thanks to @currankelleher for this long-awaited contribution)
- Plotline & Plotband (thx @50rayn)
- Rollin Pin Legend (thx @Devgru)
- Revamped Timeline, which can now render Gantt charts
https://t.co/Tml0026pEF
I never thought that this small experimental library could grow to be among such titans of high-performance visualization tools as https://t.co/FrlzXrQslv and https://t.co/fBEPJR8Rih. It's a real honor!
Blog: https://t.co/WpltKWZYr3
GitHub: https://t.co/6IFGaw4Gsv
Big news for https://t.co/YC6q2hDewo — the core layout and rendering library behind https://t.co/yBSx36PTQX — it is going completely open source (MIT) and joining the OpenJS Foundation @openjsf ✨
https://t.co/YC6q2hDewo was created to overcome bottlenecks when working with huge network graphs and machine learning embeddings.
Version 2.0 comes with a significant performance boost over the previous version and implements new features like point dragging and clustering.
@DennisAdriaans@nuxt_js Many of the components clearly come from Unovis https://t.co/v91NtM9bvB, for which @zernonia had kindly contributed the Vue integration.
A mention would be appreciated 🙂
✴︎ Rectangular Selection – Select points of interest and use them in your analysis;
✴︎ Play/Pause Force Graph Simulation – Freeze node positions when needed;
✴︎ ... and more
Check out this colab if you want to give it a try:
https://t.co/epTcW8PJlg
Last year we released 🪐 Cosmograph Python Widget and have the first round of updates!
✴︎ Interactive Timeline – If your data has a temporal dimension, select a time range to highlight relevant points;
🧵
I’ve just realized it’s Unovis’ 2nd birthday today 🥳
It’s amazing to see how much the project has grown—it now has 20K weekly downloads on NPM. Half of the users are @vuejs developers, thanks to the integration contributed by @zernonia.
Huge thanks to the community!
🎄 A little Christmas present from Unovis!
We're announcing Unovis 1.5, featuring @solid_js support, compatibility with React 19 and Angular 19, and numerous improvements to existing components.
https://t.co/ZMM03rDAlj
Keep reading for the main highlights 🧵
@phil_renaud@AskNewsApp I don't know the exact logic, but it looks like the terms that appear in multiple articles get connected.
I don't think the edge strength is being used here. We've added the support to the Cosmograph library but not into the app. We are working on a big update.
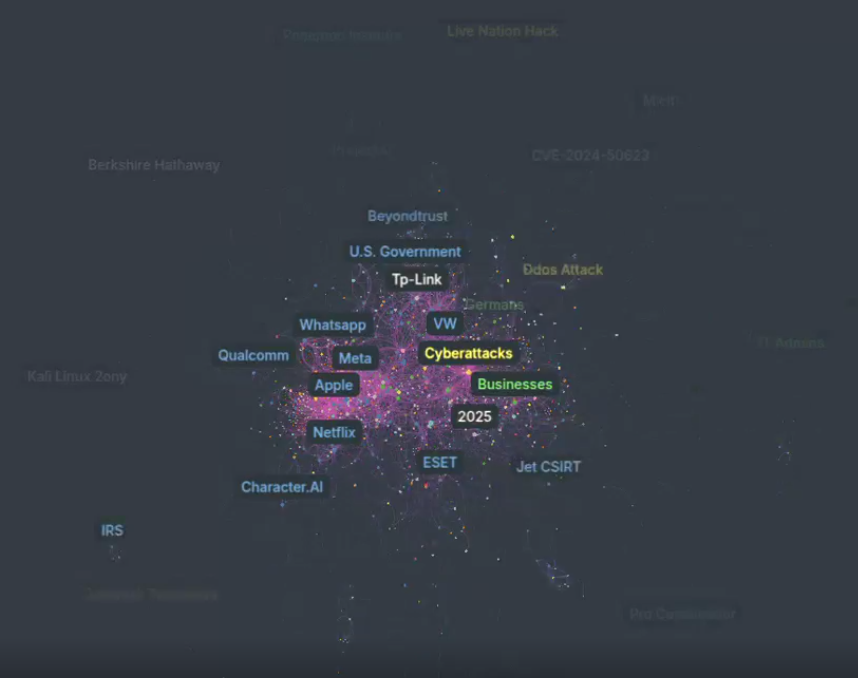
A month's worth of news visualized as a network graph by @AskNewsApp & 🪐 Cosmograph.
I really like looking at how topics change over time. A bit noisy, but it still gives you understanding of what events have happened and how they are connected.
Physics simulation is the most enjoyable part of creative coding / data vis (at least for me). It brings so much joy to the dev process.
(Working on a node clustering algorithm for https//cosmograph.app)