ESA Analytics: Geologic Data and Analysis
Smarter Oil & Gas Insights Start Here!
Transform how you scout plays, evaluate acreage, and plan your projects.
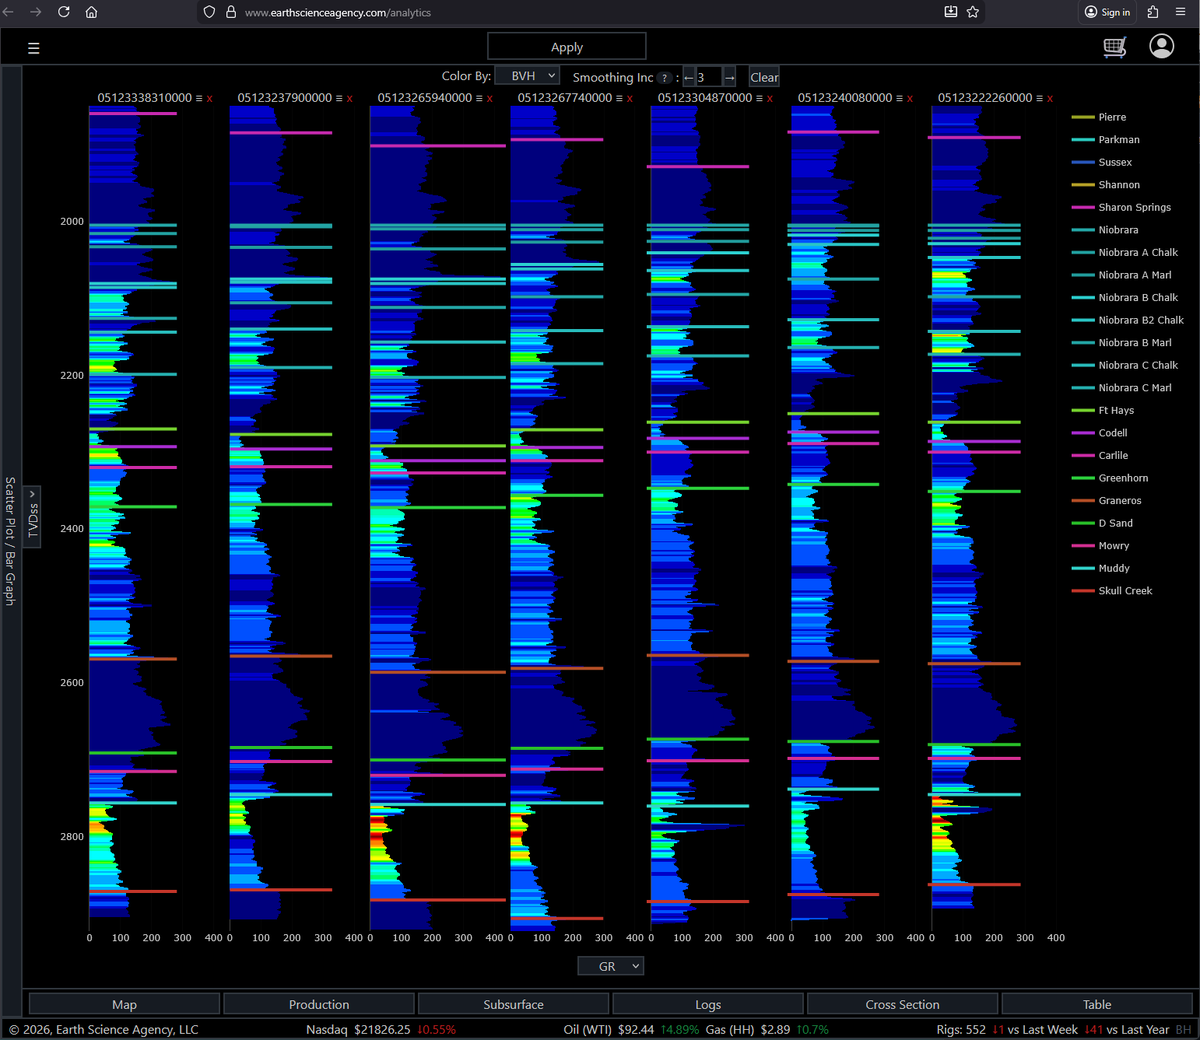
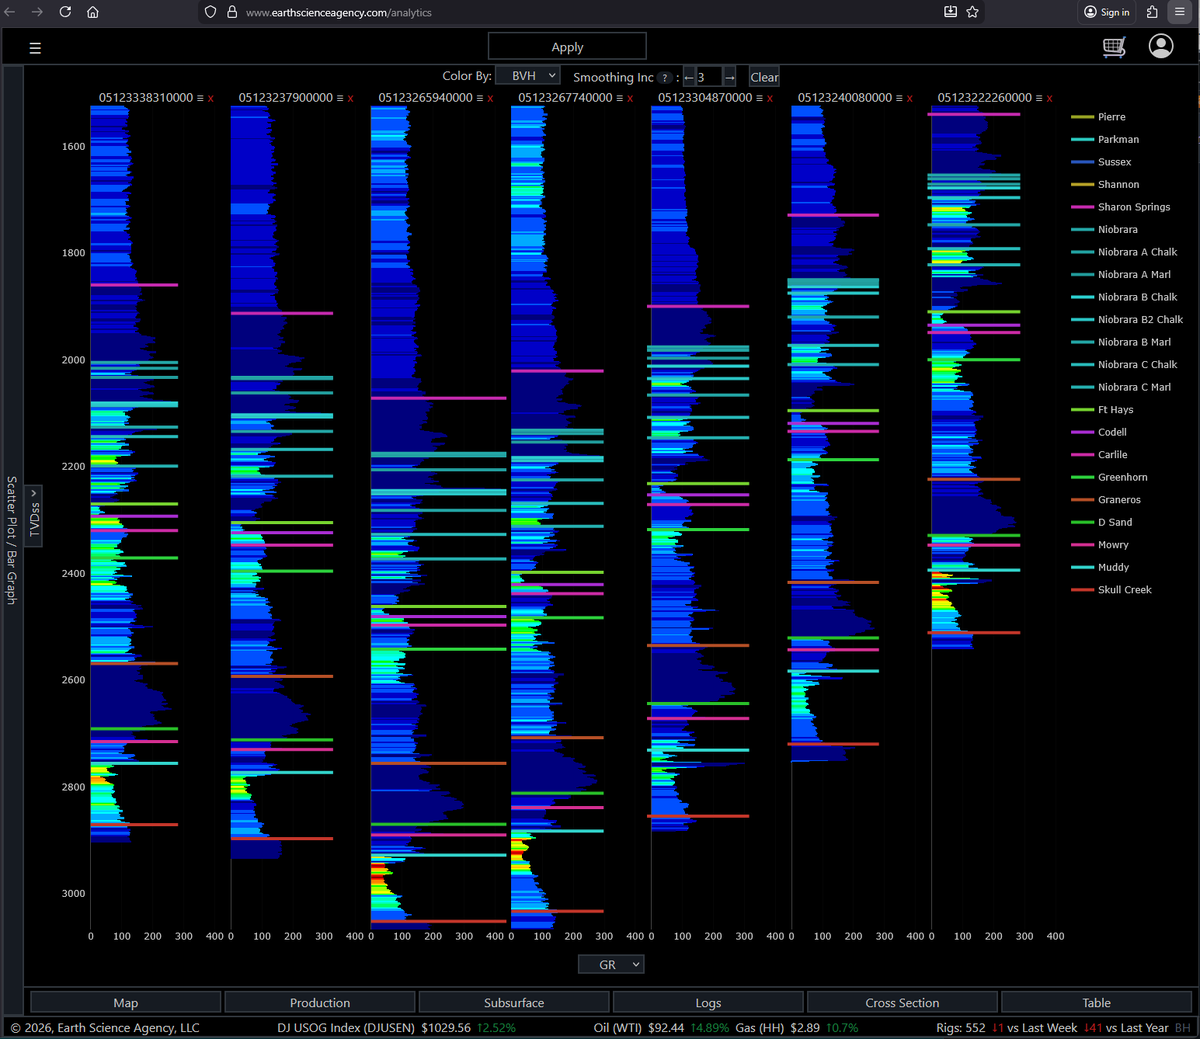
Cleaning up DJ Basin cross sections in minutes.
7 wells | Wattenberg Field
GR colored by BVH (red = high)
Niobrara & Codell variability stands out immediately.
Built-in data + interactive tools → faster decisions.
https://t.co/aUAYnQOKlU
DM me for a demo.
#oilandgas#djbasin
ESA Analytics introduces the first Community Top Picker. Pick a formation top once and it becomes part of a shared dataset the entire industry can build on.
https://t.co/aUAYnQOKlU
#OilAndGas#Geology#Subsurface#Geoscience
Registration for CAMRO's 9th Annual Conference is open!
Wednesday, June 17, - Thursday, June 18, 2026
University of Denver Sturm College of Law | Denver, CO
Register today!
https://t.co/kS0Olvm9QV
Big week for ESA Analytics.
Automated declines on every well in Colorado — each with a built-in 30-year production forecast tied to an interactive economics engine.
Production → Revenue → Cashflow → IRR / NPV
https://t.co/aUAYnQOKlU
Koloma is drilling directly into one of the most dramatic gravity anomalies in the US — the Midcontinent Rift, which cuts straight through Iowa — in search of commercially viable natural hydrogen.
Explore for youself:
https://t.co/aUAYnQOKlU
#esaanalytics#hydrogen
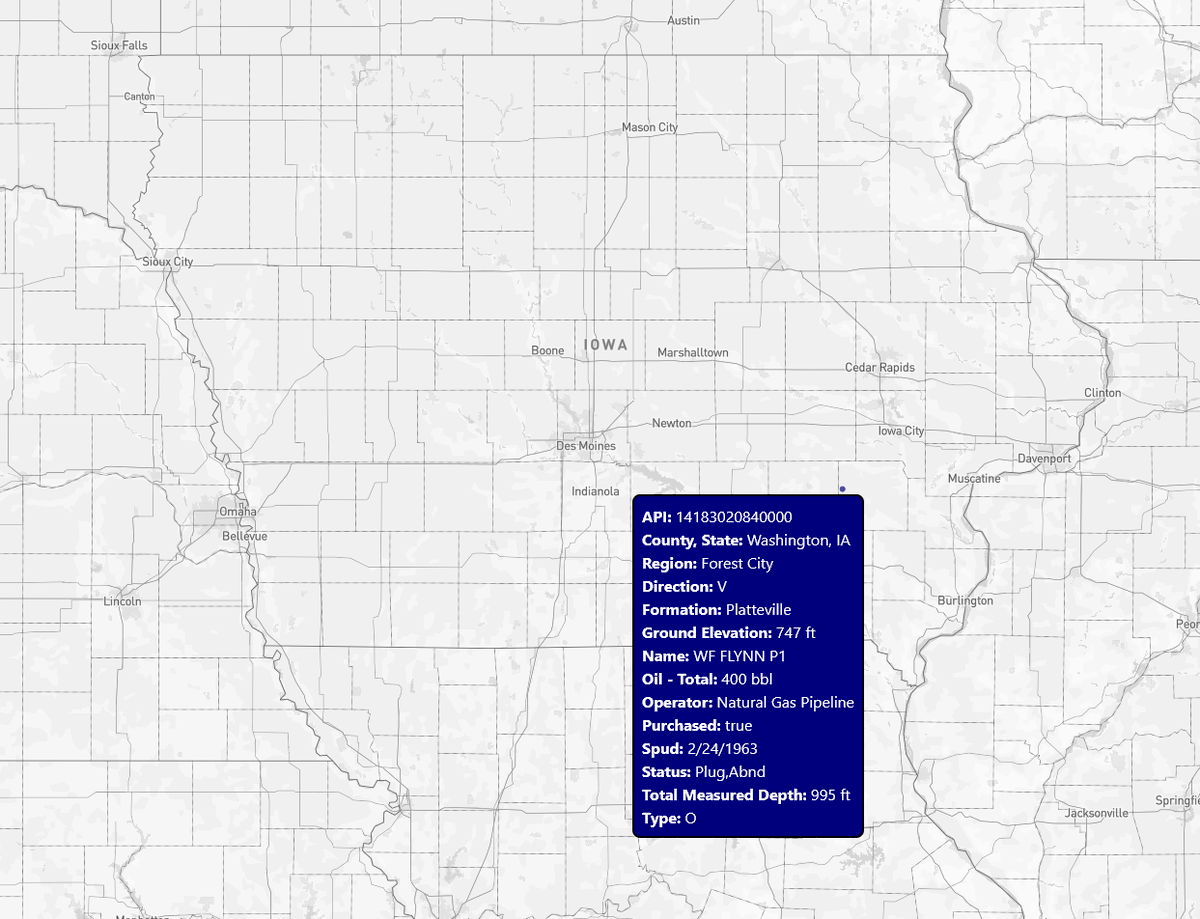
The WF Flynn P1 is the only producing oil well in Iowa's history. Located in Washington County, it produced 400 barrels in 1963. At least 135 exploratory wells were drilled in this state and resulted in dry holes or non-commercial findings.
https://t.co/aUAYnQOKlU
#oilandgas
This week: adding automated decline curves in ESA Analytics. Every producing well in the US — modeled directly from oil and gas production history.
Next step: adding user-controlled inputs to refine EUR and NPV inside the app.
https://t.co/aUAYnQOKlU
#oilandgas#declinecurves
DJ Basin laterals viewed through Oil 1-Year per Foot (365-day oil normalized by lateral length).
Normalizing by length and time removes bias and helps isolate geology, spacing, and completions.
Explore it here
https://t.co/aUAYnQOcwm
#OilAndGas#DJBasin#Colorado#ESAnalytics
More new features daily! Cursor hover functions, new map services, and you better believe we're still translating data daily!
Check this out: https://t.co/mj35oobYC9
#ESAAnalytics#OilAndGas#Energy#EnergyTech
Faults and Earthquake Epicenters toggled, zoomed in on the state of Oklahoma.
We are unearthing trends and patterns with every new function. Can you see any? See more here:
👉 https://t.co/mj35oobYC9 👈
#ESAAnalytics#OilAndGas#Energy#EnergyTech
The Niobrara Formation is more spatially extensive than most people realize. This map shows depth to Niobrara from subsurface boreholes to surface outcrops.
Seeing it all together provides a lot of insight, and it looks pretty cool
https://t.co/aUAYnQOKlU
#oilandgas
Basement Depth is a fantastic new feature, and here's a photo showing off the national map. It's like a heat map for the sedimentary thickness.
You should see what we're up to: https://t.co/mj35oobYC9
#ESAAnalytics#OilAndGas#Energy#EnergyTech