Our in-house parent selection toolkit is now everyone's!
Haplotype-based breeding can maximise long-term genetic gain, but the workflows have been a barrier.
Our ambition with HapSelect: democratise localGEBV and AI-guided parent selection for the whole community
Sensitivity to stress changes throughout soybean growth, bringing different risks at each stage. Many can be reduced with good management practices. Get the facts on key risks, best practices, and common misconceptions about the soybean growth cycle: https://t.co/uVUd0WFH29 #SoyCheckoff
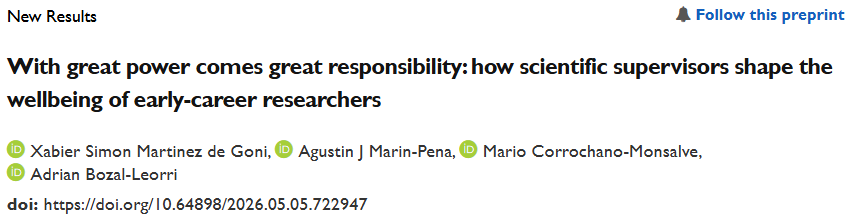
Most early-career researchers enter academia because of passion for science. Many leave because of supervision. Our study (2,604 responses, 65 countries) suggests that supervisory practices strongly shape mental health and retention in academia.
Preprint:
https://t.co/Fs1FGdKK9H
Legumes - what do you want to know? 🌱
To help guide GRDC investment in pulse research in WA over the next five years, @GGA_WA is seeking input for the 2026 Grain Legume Grower Survey 👇
https://t.co/wmIuX3K1lg
@theGRDC
Plants can’t escape the heat—but they can adapt 🌱
Salk scientists have discovered a built-in cellular “thermostat” that helps plant roots sense temperature changes and adjust their growth in real time. Instead of making new proteins, plants rapidly activate existing ones—allowing roots to keep growing and access water and nutrients even in fluctuating conditions.
Why it matters: Understanding how plants respond to environmental stress could help scientists develop crops that stay resilient as temperatures rise.
Learn more: https://t.co/PRr9HGs3vj
#PlantBiology #ClimateScience #FoodSecurity #SalkInstitute
I completed my PhD in 2001, and began at my current univ as an Assistant Prof the same year. I'm now a Full Prof with an endowed chair
To this day, I get an occasional phone call from one of my grad school profs - usually just to check on how my career is going. It's fabulous
@MNSoybean trials compared over 60 giant ragweed and waterhemp control options in a soybean-corn rotation: https://t.co/IkOjJ6lF9W. See more #SoyResearch: https://t.co/94ffD578I3. #SoyCheckoff
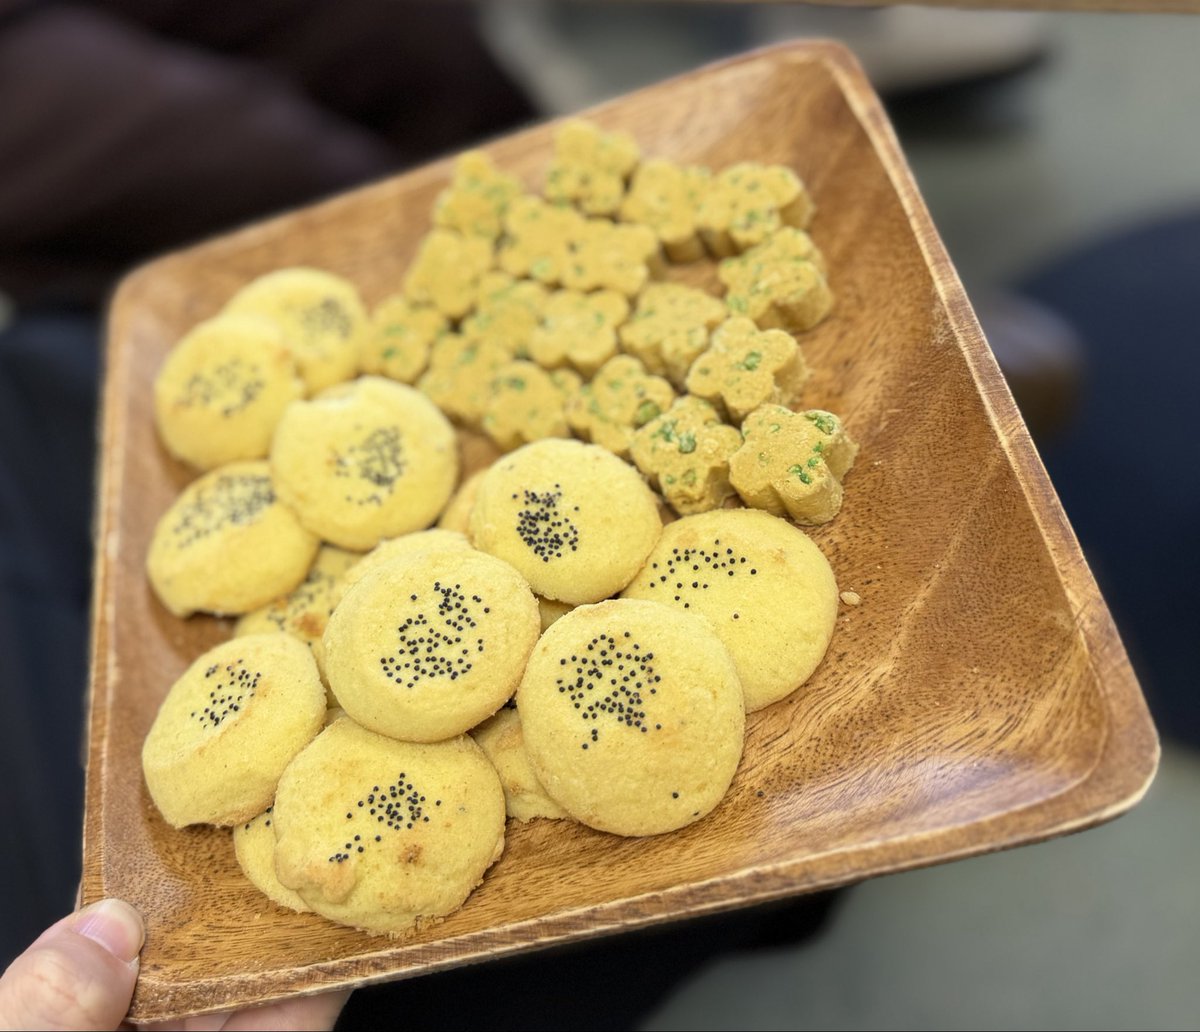
We’re celebrating the Persian new year, based on the calendar developed in the 11th c by the renowned Persian mathematician and astronomer Omar Khayyam 🪐
Happy new year and best wishes of peace and prosperity!
Running a research lab is about leading people.
I created a free toolkit on the human side of lab leadership—covering hiring, mentoring, conflict navigation, lab culture, and performance management.
Open access: https://t.co/fr3dDnsJAi
#TeamScience#AcademicLeadership
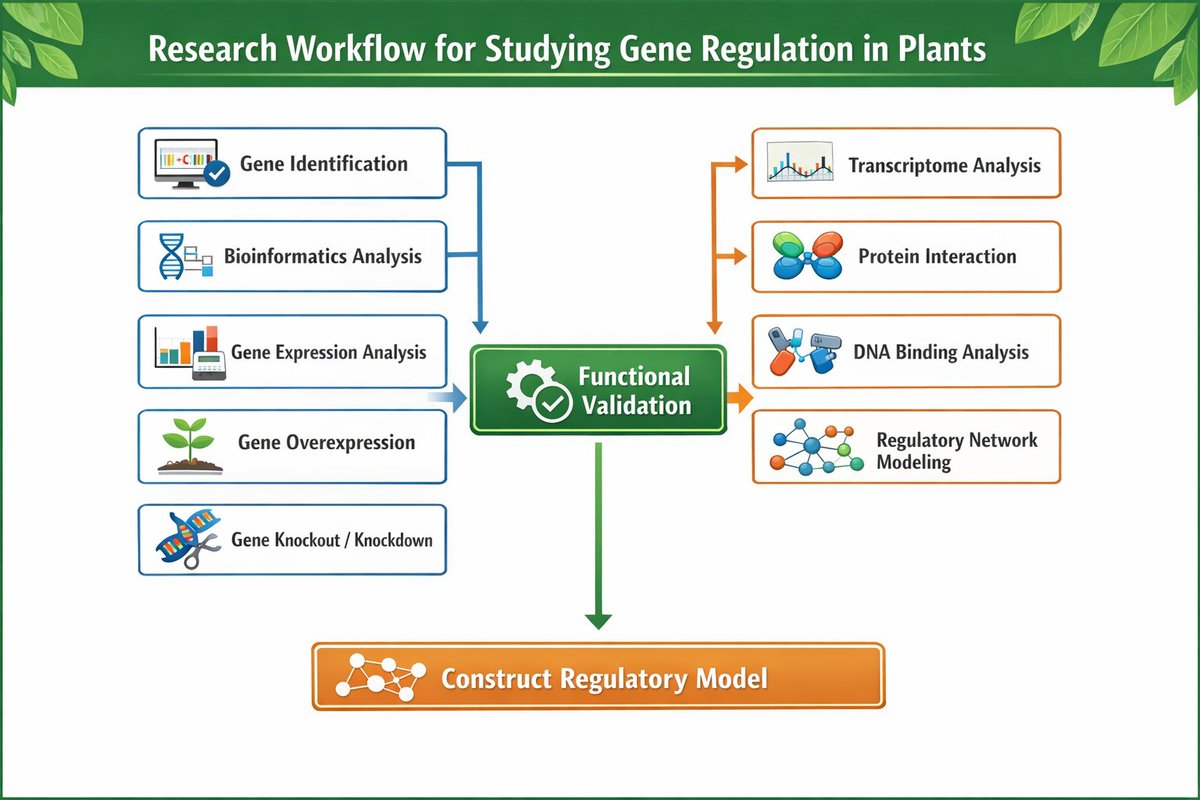
🌱 Studying plant gene function?
This article introduces a practical workflow for exploring gene regulation in plants.If interested, take a look or save for later!
🔗 https://t.co/rG7wwz0M77
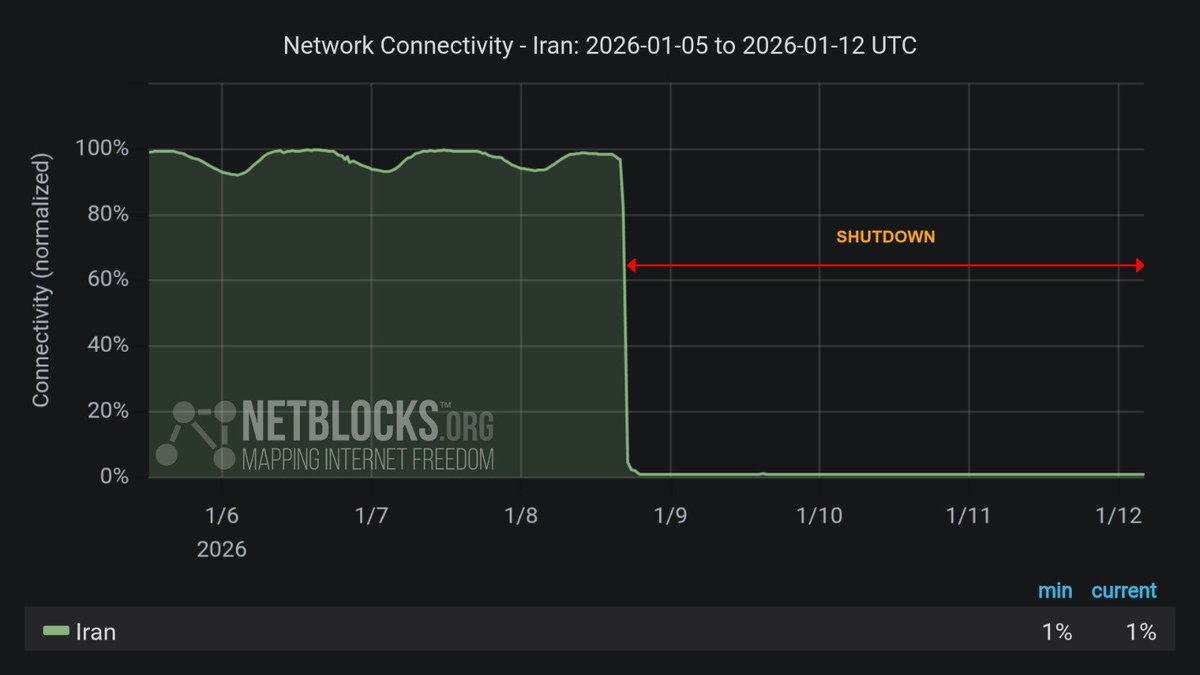
⚠️ Update: As #Iran wakes up to a new day, metrics show the national internet blackout is past the 84 hour mark.
Years of digital censorship research point to these workarounds:
📻 Shortwave/HAM radio
📶 Cell towers at borders
📡 Starlink terminals
🛰️ Direct-to-Cell satellite
ANOVA (Analysis of Variance) is a powerful statistical method used to compare the means of two or more groups. It helps to determine if there are significant differences among the group means. When applied correctly, ANOVA can provide clear insights into the variations within your data.
✔️ Uncover Hidden Patterns: ANOVA allows you to detect differences in group means, helping you understand the underlying patterns in your data.
✔️ Informed Decision-Making: By identifying significant differences, ANOVA supports more informed decisions based on data analysis.
✔️ Efficiency in Testing: ANOVA can test multiple groups simultaneously, saving time and reducing the risk of Type I errors.
❌ Misinterpretation Risk: If assumptions like normality or homogeneity of variances are not met, ANOVA results may be misleading.
❌ Complexity in Large Data Sets: Handling large data sets or multiple variables can complicate ANOVA, requiring careful management to avoid errors.
🔹 R: Use the aov() function for performing ANOVA, and ggplot2 for creating insightful visualizations like density plots to represent the distribution of groups.
🔹 Python: Utilize the statsmodels package to conduct ANOVA and seaborn or matplotlib for creating density plots and other visual aids.
In the attached visualization, a density plot is shown based on three groups (A, B, and C). Such a density by group plot is a useful complement to ANOVA as it enhances your understanding of the group distributions and the assumptions underlying the analysis. In this example, the plot shows different variances among the groups, suggesting we should assess if ANOVA is appropriate or if its assumptions are violated.
For those interested in diving deeper into Statistical Methods, including ANOVA, check out my online course on Statistical Methods in R. This course covers this and many other related topics in detail.
Click this link for detailed information: https://t.co/7YQCRDKSPO
#database #Python #RStats #DataAnalytics
FRONTIERS IN PLANT SCIENCE
Legumes for Global Food Security, Volume III
This Research Topic is currently accepting articles.
Manuscript Summary Submission Deadline 30 May 2026
Manuscript Submission Deadline 29 September 2026
https://t.co/thvvdUmj02
@tom_warken40864
More unsolicited advice for early career researchers:
8. Just do it!
Just keep moving, keep taking initiative, and good things will follow. It’s the only sensible way to spend our limited time on this planet and value life. Nothing great ever came from sitting on the sidelines—you don’t score goals by watching the match (apologies for the football metaphor). Get on the pitch and make things happen. https://t.co/jay3bJ0c5G
🔍BOKU University team in #LegumeGeneration uses digital phenotyping to spot tiny soybean differences our eyes can’t see — revealing drought tolerance, nitrogen fixation, pigment levels & growth.
💡This helps breeders select stronger, more resilient varieties.
#legumebreeding
We found genetic regions in mungbean that create a dilemma:
They make mungbean more productive, but reduce productivity of the following wheat crop.
Classic evolutionary trade-off playing out in agriculture. 🧵
FULLY MOBILE phenotyping at APPN @UQ_News!
Our new PhenoMobile puts 3 LiDARs, 3 RGB cameras, thermal camera & spectrometer right over crops for hi-res, hi-throughput measurement of plant structures, features, traits and responses. See https://t.co/kWPQcskAdX
#NCRISimpact
Creating publication-ready plots in R is easier than ever with ggpubr. This extension for ggplot2 simplifies the process of generating clean and professional graphics, especially for exploratory data analysis and reporting.
The attached visual, which I created using ggpubr, demonstrates its versatility. It includes a density plot with group comparisons (upper right), a boxplot with statistical significance annotations (lower left), and a grouped bar chart (lower right). These examples showcase how ggpubr helps streamline the creation of informative and visually appealing plots, perfect for presentations and publications.
If you’d like to learn how to create publication-ready visualizations with ggpubr and other tools, join my online course, Data Visualization in R Using ggplot2 & Friends. In this course, you’ll learn how to design polished graphics like these step-by-step!
More info: https://t.co/ztlEzoEDWv
#ggplot2 #R4DS #RStats #Python #tidyverse #DataViz #statisticsclass #DataVisualization #Rpackage