Some lovely UDP performance improvements in .NET 8, to add to my series.
Cover image says it all really.
@scalablecory, @davidfowl
https://t.co/O6EscN8DE5
@JollyShopland Smuggling the Actions Cache GH token out through a PR, and then using that to poison cache used for builds for the main branch's commits is pretty clever, ngl.
Today, we're making Error Tracking by @BetterStackHQ generally available.
Sentry-compatible. AI-native. At 1/6th the price. Here's why we built it, and how to get the most out of it.
What's wrong with error tracking today?
Most teams use Sentry. It's solid! But at scale, the bills get brutal. Just 100M exceptions with 90 day lookback? ~$30,000 on Sentry. We charge ~$5,000 for the exact same thing. The math isn't subtle.
And so most teams still end up sampling. Which means missing the exact exception that caused the outage.
The bigger problem: errors are orphaned data. Your exception lands in Sentry. Your logs are in Datadog. Your traces are somewhere else. Root cause analysis becomes a multi-tab archaeology project at 3 am.
We built error tracking natively inside Better Stack: the same platform where your logs, traces, metrics, uptime checks, and on-call schedules already live. Errors are just another signal. They belong together.
The part that changes how your team works: Our AI SRE doesn't just surface errors. It fixes them. See a new exception? One click.
The AI SRE analyzes the full context, from stack traces, environment variables, browser sessions, related logs and recent deploys, and opens a pull request. Not a ticket. Not a summary. A pull request with the fix.
This is what happens when error tracking is fully integrated with the rest of your observability stack instead of bolted on separately. The AI has everything it needs to actually act.
The migration is trivial:
1. Keep your existing Sentry SDK. Don't touch a single line of instrumentation code.
2. Point the DSN at Better Stack.
3. Done. Errors flow in. Your dashboards work. Your alerts work.
4. New exception appears. Click "Fix with AI SRE." Pull request lands in your repo.
5. Review, merge, close. That's the whole workflow.
The AI angle is real, not a marketing badge.
LLMs are genuinely good at fixing bugs if they have full context. The reason AI coding assistants sometimes frustrate engineers is incomplete information, not the model.
We solve that by giving the AI SRE your entire telemetry stack as context. Stack traces, logs, traces, service maps, previous incidents and much more. All of it, in one place, at the moment it matters.
Observability tools are only useful if you actually ingest all your data. At current prices of other tools, most teams can't afford to. Now you can, and your AI SRE can actually do something about it.
Today, we're introducing eBPF-based OpenTelemetry tracing alongside a remotely controlled Better Stack Collector. eBPF is ready for prime time. Here's the playbook for adopting it.
What's eBPF?
"extended Berkeley Packet Filter" is a Linux kernel technology that lets you run sandboxed programs inside the kernel safely and efficiently. Thanks to eBPF, you can now instrument your clusters with OpenTelemetry without changing any application code 🤯
The eBPF ecosystem has matured significantly over the past few months and many Better Stack customers are already using it in production.
Until now, deploying eBPF to production has been tricky. We're simplifying it today by bundling the best of the open source eBPF sensors into a single remotely controlled Better Stack collector you can deploy with a single command.
Better Stack collector gives you granular control over what exactly gets instrumented. Get the service map of your cluster, RED metrics for individual services, see network flows, and aggregate your application and system logs out of the box. Without changing any code.
Observability tools are only useful if you actually ingest all relevant data. Today, we're making that simpler and more convenient than ever.
The eBPF OpenTelemetry playbook™ = "Do the easy thing before doing the hard thing"
1. In your staging environment.
2. Deploy the eBPF collector into your distributed cluster.
3. In 98% of cases: Declare victory, your app is now instrumented.
4. In 2% of cases: You notice a particular service has slowed down. For example, the CPU utilization on a high-throughput Redis instance handling millions of operations per second got noticeably higher. Better be safe, so you disable eBPF for this single instance while keeping it enabled for the other 98% of services.
5. If needed, use the OpenTelemetry SDK auto-instrumentation to instrument the last 2% of applications.
Most teams today still start with step 5. If you're revisiting your observability stack, I encourage you to give eBPF a chance: it has matured significantly and is better than you might expect.
Better Stack encourages combining OpenTelemetry traces from the OTel SDK, eBPF, and your frontend. That's the only way to get the clearest picture of what's actually happening in your application.
Want to chat eBPF? Catch me at KubeCon in Amsterdam next week!
What do you do when you’re in Amsterdam? You get on a boat!
March 24, 8:30 PM. We’re hosting a private canal cruise for the cloud native crowd.
Cold beers. Dutch snacks. Zero agenda.
Join the Better Stack crew for a night on the water! Link to RSVP below ↓
Don’t visit our booth. Unless, of course, your observability bill is starting to cost more than your infrastructure. Sound familiar? Let us show you a better way at KubeCon + CloudNativeCon 2026. Stop by booth 892 to meet the team, see the platform in action, and experience our AI SRE firsthand.
I'm proud for @BetterStackHQ to sponsor @vuejs 🔥 @evanyou, the creator of Vue.js, is also the guest of the latest episode of the Better Stack podcast. Give it a listen, it's a great one! Link in a thread
@jurajmasar@BetterStackHQ It's honestly still wild to point AI SRE at an incident and say "what caused this", I look away, and I come back to an answer. 🔥
Great to spend more time building, less time reviewing logs and dashboards.
(there's a great demo from @JollyShopland : https://t.co/dv4ZoGBEuy)
@GeoffreyHuntley@AnthropicAI I'm absolutely not an AI minmaxer, but
Opus 4.5 for me is basically; research subagent, plan and refine in main, then spin out sub-agents as much as possible to avoid burning context and the compaction, it feels like 4.5 forgets key goals less when the original is more "recent".
@GeoffreyHuntley@AnthropicAI I know how to create performant code, and how to spec it; opus can execute.
Example, rust-based cloudflare worker, knew what I wanted to build, and how I wanted to optimise it, but I don't need to be a rust expert anymore.
@GeoffreyHuntley I've been trying coding with various models since opus 3 I think, and it was a bit tough to start, but @AnthropicAI opus 4.5 is kinda wild.
It's kinda like an accelerant for ideas, language agnostic.
React is great...
Until it's full page, re-renders start to impact your site's performance.
Luckily, React Scan by @aidenybai is here to help automatically spot these issues and make your site faster 🚀
Here's our latest video going through exactly how it works.
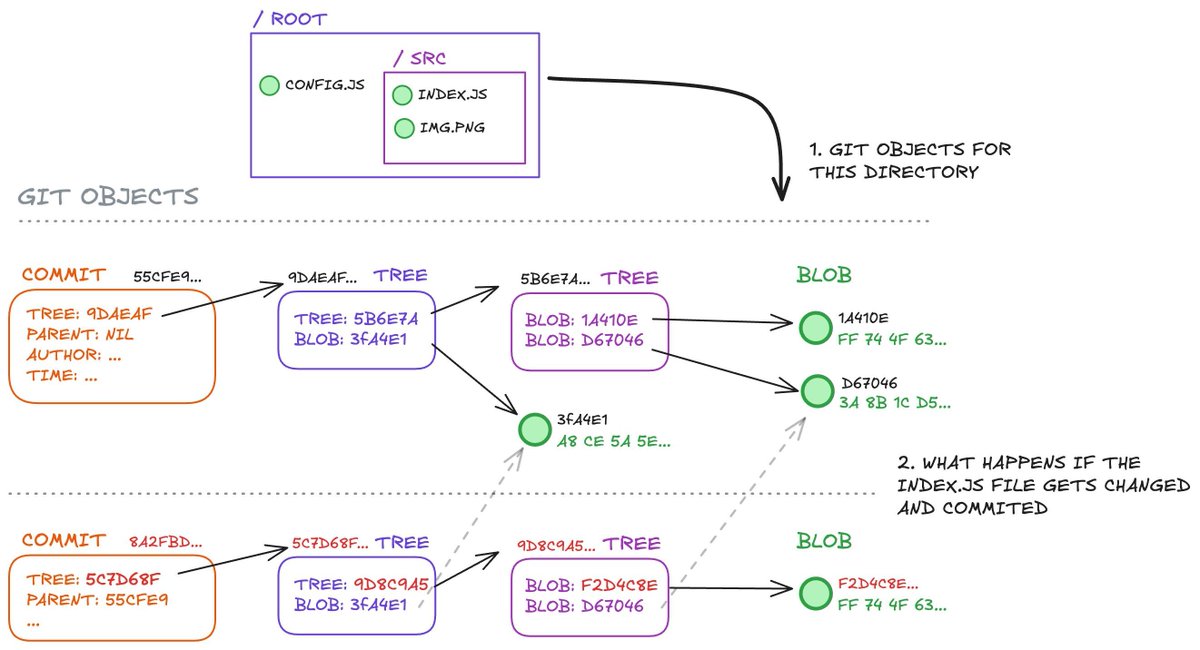
GitHub supports over 200 programming languages and has over 330 million repositories. But it has a big problem.
It stores almost 19 petabytes of data which is lot. And much of that data is unreachable; it's just taking up space unnecessarily.
But with some clever engineering, the team were able reduce the size of specific projects by more than 90%.
How? We've written a 5-minute article with all the details.
https://t.co/Yc5yAHqoqV