New Features in PITWALL V0.15.0!
Now offering PDF exports for analysis pages—seamlessly integrate your data with AI for enhanced strategic insights!
Below is a demonstration sample:
[March 16, 2025] - 🇦🇺 Melbourne GP | Race Strategy Debrief
🏎️ Circuit Dynamics & Overtaking Potential
According to the latest Circuit Data, the primary overtaking opportunities at Albert Park remain concentrated in the T1, T3, and T11 zones (highlighted in green). Historical data reveals significant volatility; the Position $\Delta$ totaled 144 overtakes between 2022 and 2025, with a peak of 128 in 2023, signaling immense potential for aggressive offensive strategies.
Furthermore, Melbourne features one of the shortest Pit Loss windows on the calendar:
Green Flag: 19.3s
VSC/Safety Car: 7.3s
This low "entry cost" significantly reduces the risk of extra pit stops, favoring multi-stop strategies if tire degradation spikes.
🌡️ Environmental Factors & Long-Run Analysis
During FP2, track temperatures cooled significantly, dropping from 44°C to 38°C.
Raw Deg & Stints: Leading contenders (VER, NOR, LEC) focused on the Medium Compound for long-run simulations. Data suggests that as track temperatures stabilized, tire performance became increasingly predictable.
Track Evolution: Grip levels improved rapidly. FP2Q projections indicate massive qualifying gains, with Verstappen (VER) expected to find up to 2.634s in lap time improvement.
🛠️ Team Setup & Performance Synthesis
McLaren (NOR/PIA): Lando Norris has set the benchmark for low-drag efficiency, topping the Max Speed charts at 337 km/h. While Oscar Piastri showed impressive Exit Speed out of T2, he currently trails Norris in straight-line performance.
Red Bull (VER/TSU): Max Verstappen dominates the Speed/Acceleration scatter plots, showcasing a perfect balance between mechanical grip and top-end power. Yuki Tsunoda is the "dark horse" of the session; his predicted improvement ($\Delta$ FP2) sits at -2.051s, making him a major threat for a top-6 qualifying position.
Ferrari (LEC/HAM): Both drivers are running high-braking-performance setups. Charles Leclerc leads the field in Ideal Lap (1:15.439) and Sector Delta, demonstrating total dominance in the technical S3. Lewis Hamilton remains close, showing exceptional stability under heavy braking.
📊 Key Strategic Insights
Safety Car Probability: With 13 Safety Car deployments over the last 4 years, the probability is extremely high. Strategy teams must remain agile to capitalize on the "cheap" 7.3s pit window.
Braking Consistency: George Russell and Charles Leclerc recorded the lowest CV% (Coefficient of Variation) in heavy braking zones, indicating high driver confidence. Conversely, while Norris is fast, his braking data shows higher volatility, which could be a factor during wheel-to-wheel combat.
Want access to full telemetry charts and real-time strategy simulations?
Visit: https://t.co/jQogXeFhZs
🏎️ 2025 Australian GP FP2 Analysis is LIVE!
We’ve seamlessly integrated PITWALL core data into a new web-based format! Now you can quickly review key telemetry and strategic insights from the Australian GP FP2 directly in your browser.
🔗 Check out the full report here:https://t.co/yWW4fFCQWg
Ready for the February Pre-Season Testing? We’ll be dropping even more in-depth data reports soon. Stay tuned! 🏁
#F1 #AustralianGP #DataAnalysis #PITWALL #F1Telemetry #Motorsport
Live Time Feature
The system reads downloaded or online F1 official timing data (including positions, laptimes, telemetry, weather, etc.) and plays it back sequentially based on timestamps.
This updates all connected analysis modules in sync, as if the race were happening in real-time.
#F1 #F1Tech #F1data #F1live
The Surprise Leader: Who is Really the 2025 King of Starts?
almost all drivers fall within a razor-thin window of 2.572s to 2.699s at 0-50km/h
https://t.co/oL153E9Ktr
The new F1 Pro is live!
✨ New: Live Timing Replay – Compare driver performance at any point in the race.
✨ New Interface – A more intuitive layout to track status instantly.
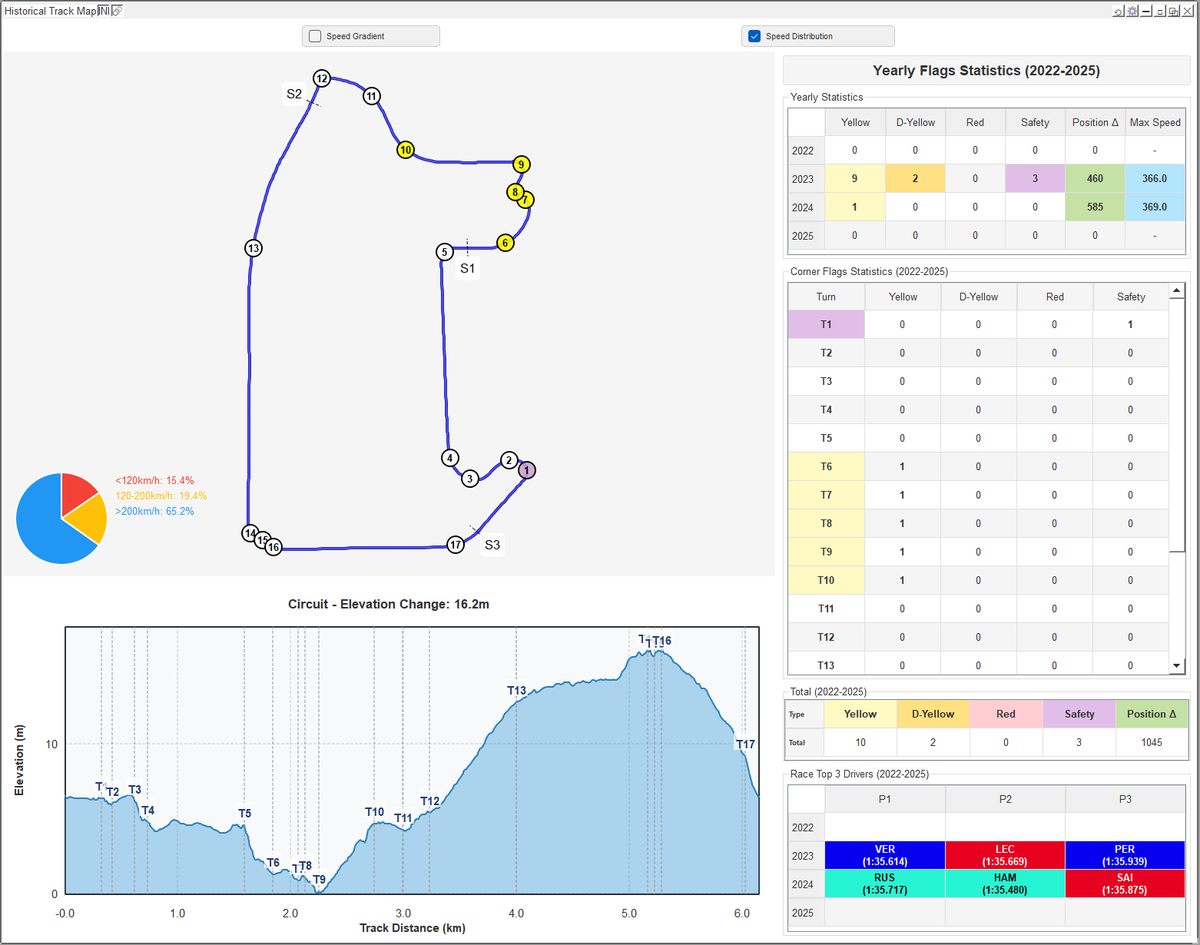
4️⃣ Elevation Profile
Full track elevation map showing climbs, drops, peaks, and valleys—useful for linking terrain with incident patterns (e.g., more yellows on downhill entries).
V0.8.0 Update – Historical Circuit Analysis
The new module brings multi-year circuit insights together in one place:
🟡 Flag Statistics (Yellow/Double Yellow/Red/SC)
🔄 Position Change Analysis
🏁 Top-3 Finish History
📉 Elevation Profile & Track Geometry
🔥 Can Max do it again in 2025?
From P11 to P1, just like his legendary 2024 Brazil rain masterclass.
If the skies open up at Interlagos — we might witness another Verstappen storm. 🌧️🏆
#F1#BrazilGP#Verstappen#RainMaster
F1-TelemetryStation-Pro V0.4.0 Released!
🆕 Major Updates:
✅ Complete S1/S2/S3 sector display for ideal lap analysis
✅ Time-axis mode for all telemetry charts
✅ New dedicated time difference analysis module
✅ Welcome dashboard with standings & weather
#F1#DataAnalysis


![f1tspro's tweet photo. New Features in PITWALL V0.15.0!
Now offering PDF exports for analysis pages—seamlessly integrate your data with AI for enhanced strategic insights!
Below is a demonstration sample:
[March 16, 2025] - 🇦🇺 Melbourne GP | Race Strategy Debrief
🏎️ Circuit Dynamics & Overtaking Potential
According to the latest Circuit Data, the primary overtaking opportunities at Albert Park remain concentrated in the T1, T3, and T11 zones (highlighted in green). Historical data reveals significant volatility; the Position $\Delta$ totaled 144 overtakes between 2022 and 2025, with a peak of 128 in 2023, signaling immense potential for aggressive offensive strategies.
Furthermore, Melbourne features one of the shortest Pit Loss windows on the calendar:
Green Flag: 19.3s
VSC/Safety Car: 7.3s
This low "entry cost" significantly reduces the risk of extra pit stops, favoring multi-stop strategies if tire degradation spikes.
🌡️ Environmental Factors & Long-Run Analysis
During FP2, track temperatures cooled significantly, dropping from 44°C to 38°C.
Raw Deg & Stints: Leading contenders (VER, NOR, LEC) focused on the Medium Compound for long-run simulations. Data suggests that as track temperatures stabilized, tire performance became increasingly predictable.
Track Evolution: Grip levels improved rapidly. FP2Q projections indicate massive qualifying gains, with Verstappen (VER) expected to find up to 2.634s in lap time improvement.
🛠️ Team Setup & Performance Synthesis
McLaren (NOR/PIA): Lando Norris has set the benchmark for low-drag efficiency, topping the Max Speed charts at 337 km/h. While Oscar Piastri showed impressive Exit Speed out of T2, he currently trails Norris in straight-line performance.
Red Bull (VER/TSU): Max Verstappen dominates the Speed/Acceleration scatter plots, showcasing a perfect balance between mechanical grip and top-end power. Yuki Tsunoda is the "dark horse" of the session; his predicted improvement ($\Delta$ FP2) sits at -2.051s, making him a major threat for a top-6 qualifying position.
Ferrari (LEC/HAM): Both drivers are running high-braking-performance setups. Charles Leclerc leads the field in Ideal Lap (1:15.439) and Sector Delta, demonstrating total dominance in the technical S3. Lewis Hamilton remains close, showing exceptional stability under heavy braking.
📊 Key Strategic Insights
Safety Car Probability: With 13 Safety Car deployments over the last 4 years, the probability is extremely high. Strategy teams must remain agile to capitalize on the "cheap" 7.3s pit window.
Braking Consistency: George Russell and Charles Leclerc recorded the lowest CV% (Coefficient of Variation) in heavy braking zones, indicating high driver confidence. Conversely, while Norris is fast, his braking data shows higher volatility, which could be a factor during wheel-to-wheel combat.
Want access to full telemetry charts and real-time strategy simulations?
Visit: https://t.co/jQogXeFhZs](https://pbs.twimg.com/media/G-y5WQRbcAANtpu.png)