Gold appears to be forming a significant bottom here.
We are seeing all the right signs.
I know it’s still early, but remember:
Bull markets are born on pessimism, grow on skepticism, mature on optimism, and die on euphoria…
Act accordingly.
https://t.co/atIcTmyEVR
$SILVER
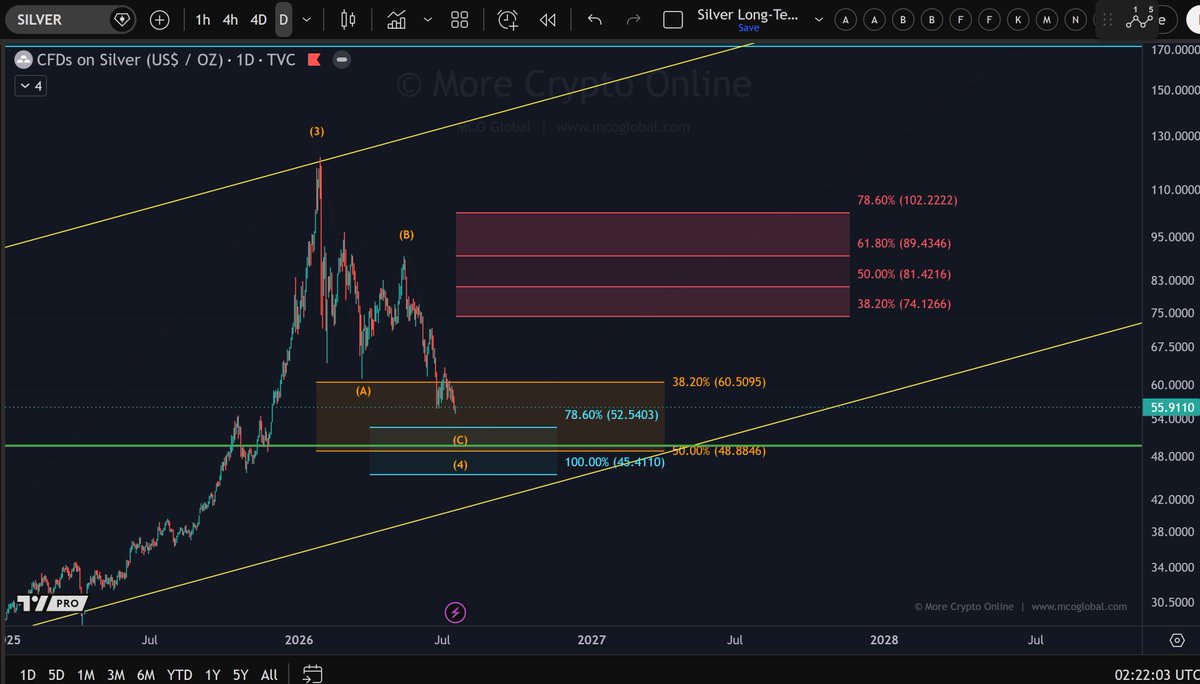
Silver's wave (4) correction that started in January is getting long in the tooth.
Another dip toward $52-$49 remains possible, but that zone could also be where the correction finally ends and wave (5) begins.
Break above $63.30 and the low might already be in. Targets above are $74-$103.
Silver making everyone suffer exactly as long as it needs to.
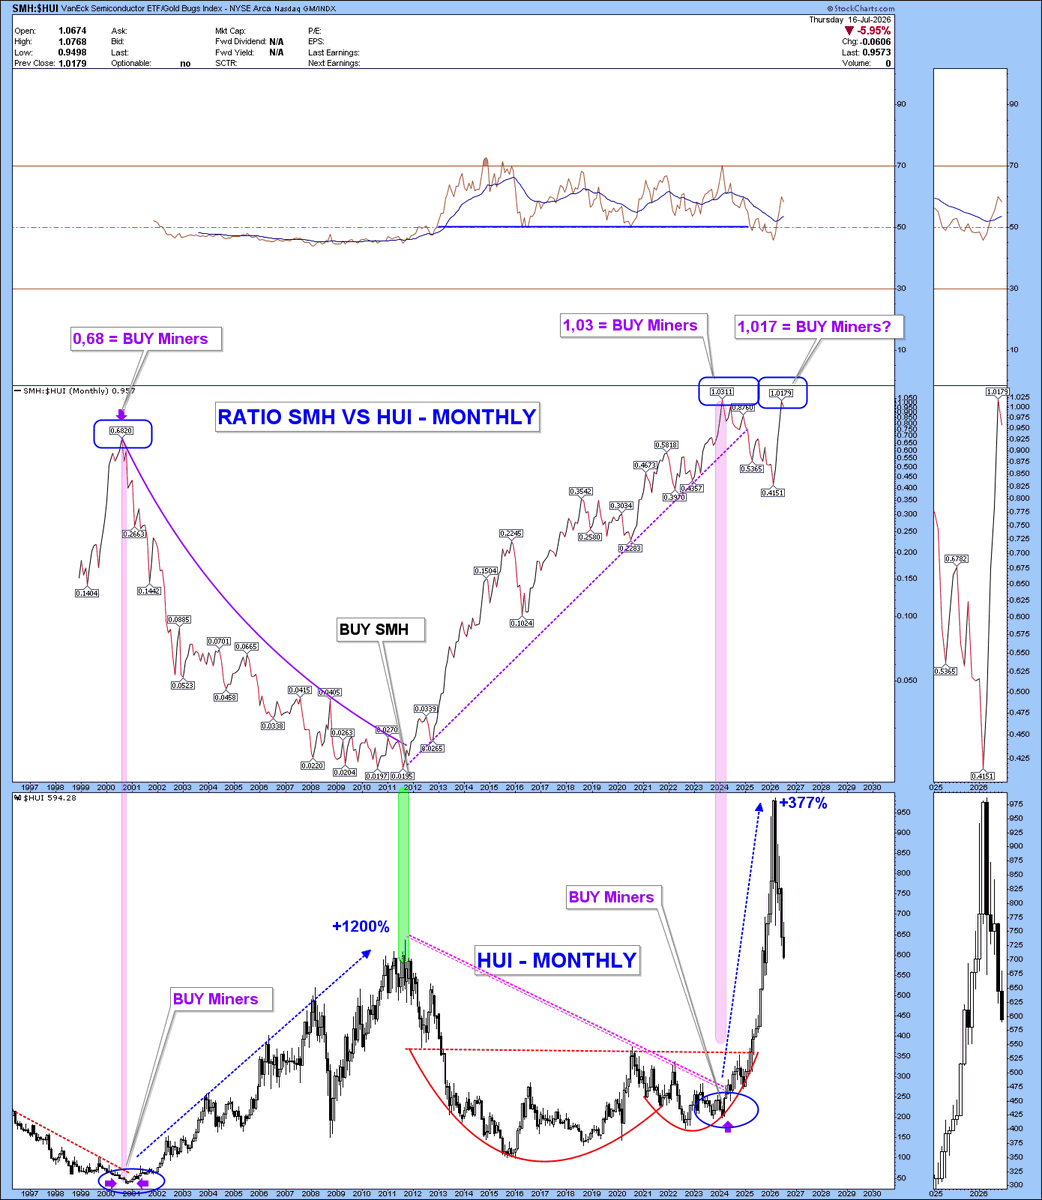
$SMH $GDX $SOX $HUI This is only the third time the $HUI/$SMH ratio has reached such an extreme level. In the past, it marked an outstanding BUY opportunity for gold miners. After a brutal correction, it looks like the opportunity may be right in front of us once again.
Will you wait, or will you seize it?
Read more on my blog: https://t.co/q9f8zTAdWF
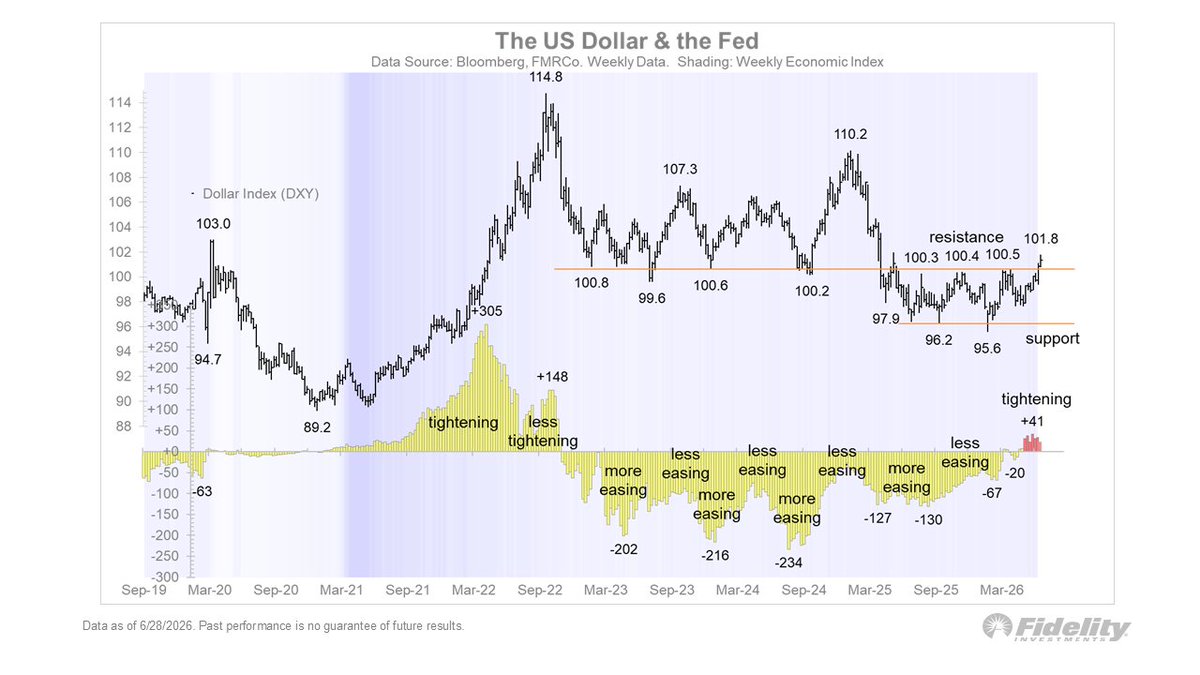
That central bank hawkishness is also lifting the US dollar, as expectations mount that the Fed will have to undo the last few rate cuts. This looks like a clear breakout from a long base.
Gold -- forming a bottom over the next 4 - 6 weeks. Likely lows in the $3,900 range (just to scare people below $4,000). From there, a nice tradable rally back toward $5,000.
We plan to trade this move. I take these trades infrequently, but with a 77% win rate and an avg. gain of 91%, that's fine with me.
Watch for sentiment to get extremely low over the next 4 - 6 weeks in the PM space just before the launch. You have been warned.
FREE PODCAST WITH DEEPER ANALYSIS:
https://t.co/9hdZpjhYms
Better businesses at lower prices.
One of the biggest mistakes investors make is allowing price action to dictate their view of fundamentals rather than the other way around.
Even after the recent pullback in metal prices, miners continue to generate margins that would have seemed extraordinary just a few years ago.
Yet many of these companies are trading as if the economics of the business have materially deteriorated.
They haven't.
https://t.co/uEgAcJ9Yh3
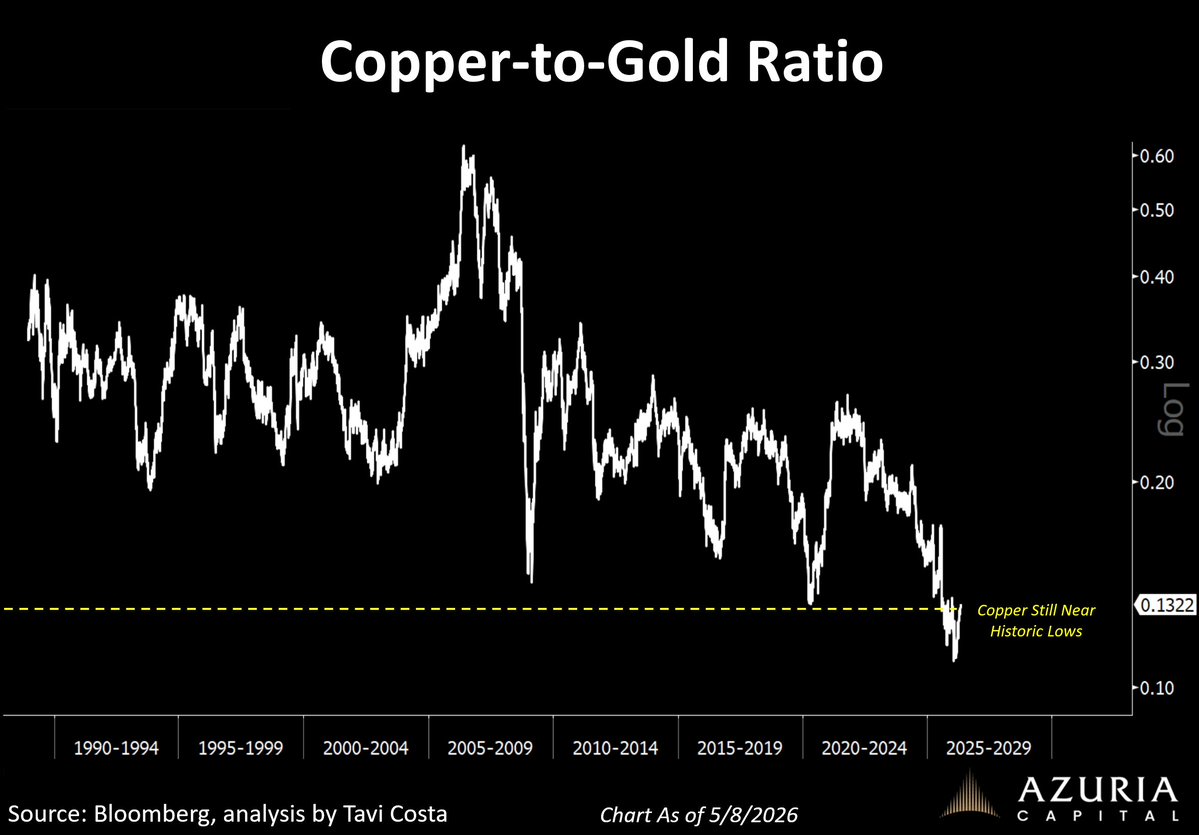
It’s wild to see copper hitting record highs while still trading near historical lows when priced in gold terms.
The copper-to-gold ratio remains nearly 80% below its 2006 peak.
More importantly:
Periods where copper became this cheap relative to gold have historically not lasted very long.
https://t.co/86d6uRE1X4
A new era for the mining industry.
Miners are generating roughly 7x what they did at the peak of the last cycle.
I’m old enough to remember when this space was considered “uninvestable” by the so-called experts.
Game on.
https://t.co/ssIdeKrny6
Hay un gráfico que casi nadie mira, y que explica mejor que cualquier otra cosa por qué el S&P 500 es una trampa.
Se llama US Stock Fundamental Index.
Es el índice que mide la estructura real del mercado americano. No el precio. La salud de los activos que están abajo.
Y cuando lo ponés al lado del S&P 500, aparece algo incómodo.
El precio del S&P sigue subiendo.
Máximos históricos. Titulares eufóricos. Todos felices.
Pero el índice fundamental lleva meses en cero. En algunos puntos, ya en terreno negativo.
¿Qué significa esto? Que el precio está subiendo sin fundamentales que lo sostengan.
No es crecimiento. Es impresión de dinero más un poco de euforia.
Es como comprar aire. Aire que huele bien, pero es efímero.
Y no es la primera vez que pasa.
Si mirás el gráfico hacia atrás, cada vez que el índice fundamental tocó cero o bajó a negativo mientras el precio seguía subiendo, vino una caída fuerte.
Año 2000. Fundamental deteriorándose, precio en máximos. Después, el NASDAQ cayó 78%.
Año 2008. Mismo patrón. Fundamental en rojo, precio todavía subiendo. Después, la crisis financiera se llevó el 50% del S&P.
Año 2020. La divergencia se repitió. Después vino el crash del COVID.
Hoy el índice fundamental está en niveles peores que antes del 2000 y comparables con los puntos previos a 2008.
¿Significa que el S&P va a caer mañana? No necesariamente.
La Fed imprimiendo $40 mil millones por mes puede sostener el precio más tiempo del que parece razonable.
La plata tiene que ir a algún lado, y de momento está yendo a las acciones.
Pero una cosa es que el precio suba. Otra es que el activo esté sano.
El S&P hoy es un activo enfermo que parece saludable porque lo están inflando artificialmente.
Y acá viene la parte que importa.
Cuando comparás el S&P contra los mercados emergentes y lo evaluás contra el dólar index, el cuadro es todavía peor.
El S&P medido en emergentes está en niveles de sobrevaluación que superan la burbuja del año 2000.
El dólar index viene bajando. Cuando ese retardo se cierre, la reversión del ratio puede ser de hasta 60%.
Eso es lo que el gráfico está gritando.
Entonces la pregunta deja de ser "¿va a subir o bajar el S&P?".
La pregunta real es:
Cuando el capital se dé cuenta de que está comprando precio sin fundamentos, ¿a dónde va a rotar?
La historia tiene una respuesta clara: a lo real, a lo tangible, a lo que está barato.
Commodities en piso histórico contra el S&P. Metales preciosos rompiendo momentum.
Mercados emergentes con ciclo de manufactura positivo.
Latinoamérica empezando un ciclo estructural al alza.
El capital no desaparece. Rota.
Y el que entiende hacia dónde está rotando antes de que sea obvio, no necesita adivinar el techo del S&P.
Solo necesita estar parado del lado correcto del ciclo.
Si te interesaria saber mas sobre esto prepare una masterclass - “Ganale al S&P500 en tiempos de incertidumbre” el lunes 27 de Abril.
Voy a explicarles mi vision de porque creo que invertir en Wall Street en estos momentos es un gran error financiero y en donde deberias estar mirando para posicionarte mejor con tu portafolio.
Responde la palabra “CUPO” y te envio el link de registro al privado
🚨The CEO of a major European energy giant just publicly called to bring Russian gas back.
The same weekend, 600 fuel stations ran dry in Italy.
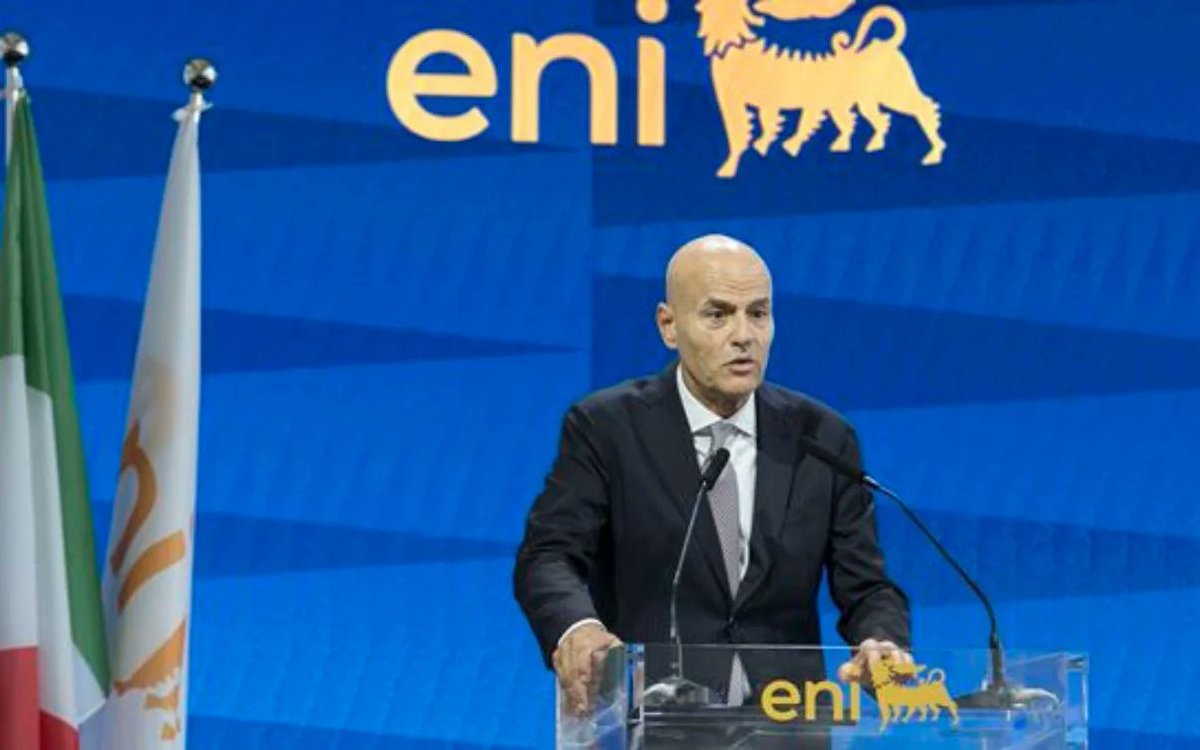
Claudio Descalzi CEO of Eni, Italy's state backed energy giant, re-elected for a record 5th term stepped onto a public stage and said what no European energy boss had dared say until now.
"It is necessary to suspend the ban on 20 billion cubic meters of Russian gas set for January 1st, 2027."
Here's what he actually said 👇
⛽ "The problem is not prices. It's volumes."
Scarcity has arrived. This is no longer about inflation.
🚗 "600 fuel stations ran out of diesel that's our fault for keeping prices too low."
This is already happening on Italian streets. Not in a spreadsheet.
🔋 "Renewables cannot replace gas. Gas gives the grid its flexibility."
A direct rebuttal to the ideology from the man who runs Italy's biggest energy company.
✈️ "Europe imports 35% of its aviation fuel. We need to understand how to source it and at what price."
💸 "If industry pays a fortune for energy AND gets hit with carbon taxes, we risk social stability."
This is not energy policy language. This is a warning.
🧠 "One cannot be radical and dogmatic. In extraordinary situations, common sense must prevail."
Now connect the dots 🔗
🇶🇦 QatarEnergy declared force majeure on LNG contracts Italy was among the affected.
🇯🇵 Japan authorised emergency coal to replace lost Gulf LNG.
🛢️ bp slashed its green budget by 90% and pivoted back to hydrocarbons.
🌊 20% of global oil supply is trapped in the Gulf right now.
Descalzi is reading a supply balance... And the maths doesn't work.
Italy lost 20% of its domestic refining capacity over 20 years.
Refineries phased out, converted or shut down.
All in the name of transition.
Descalzi called it exactly what it is:
"We're paying for all the inconsistencies of the last 20 years which extreme conditions have mercilessly exposed."
That sentence is about Europe.
The question is no longer if Europe revisits the Russian gas timeline.
It's who admits it first at policy level and how much damage piles up before they do⏳
Want to understand what comes next for energy and markets?
Read my latest article, link 👇
https://t.co/oBY1MSCmpW
BREAKING:
🇸🇦 Saudi Arabia fully restores East-West oil pipeline, bypassing the Strait of Hormuz and pumping 7,000,000 barrels per day.
Saudi Arabia says it needs no more strait of Hormuz.
SILVER
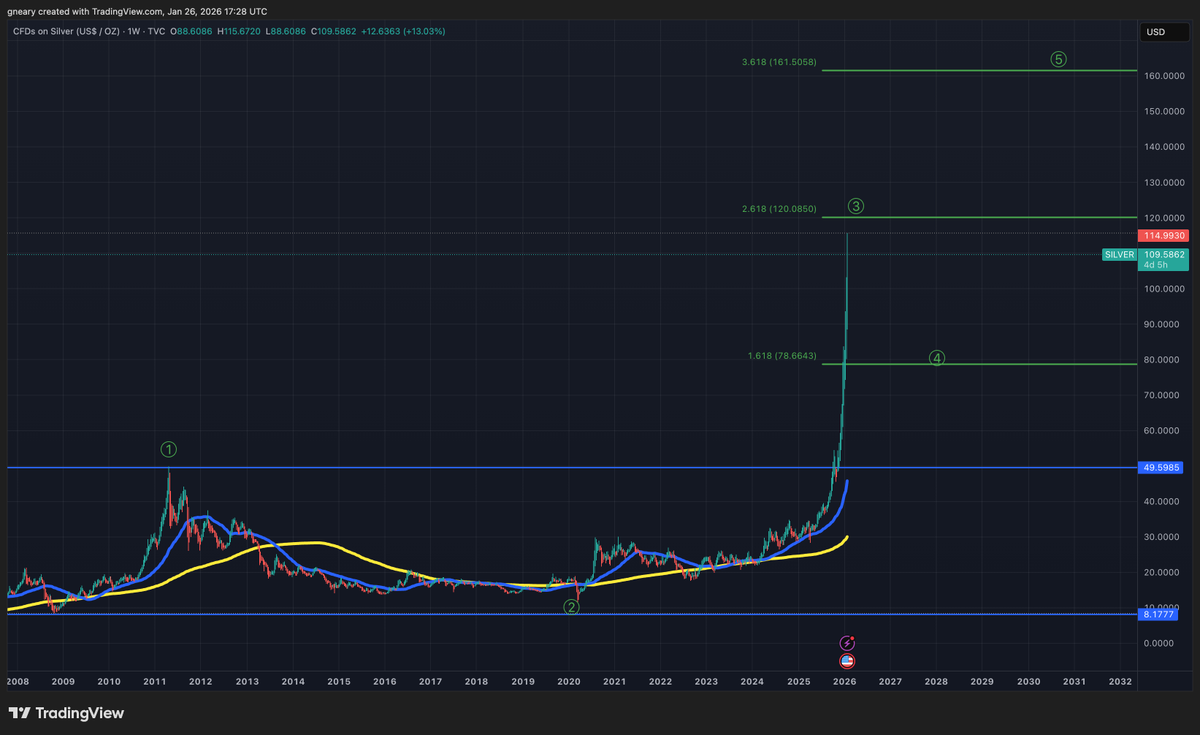
I shared this chart on the 26th of Jan, that Silver would hit $120 and complete Wave 3 and pull back to the $70's for Wave 4 next
4 Day's later Silver topped out at $121 and is now at $74.
Parabolic moves toward strong Fib resistance levels mean you sell, which we did.
Now Silver is attractive again.
Déjà vu.
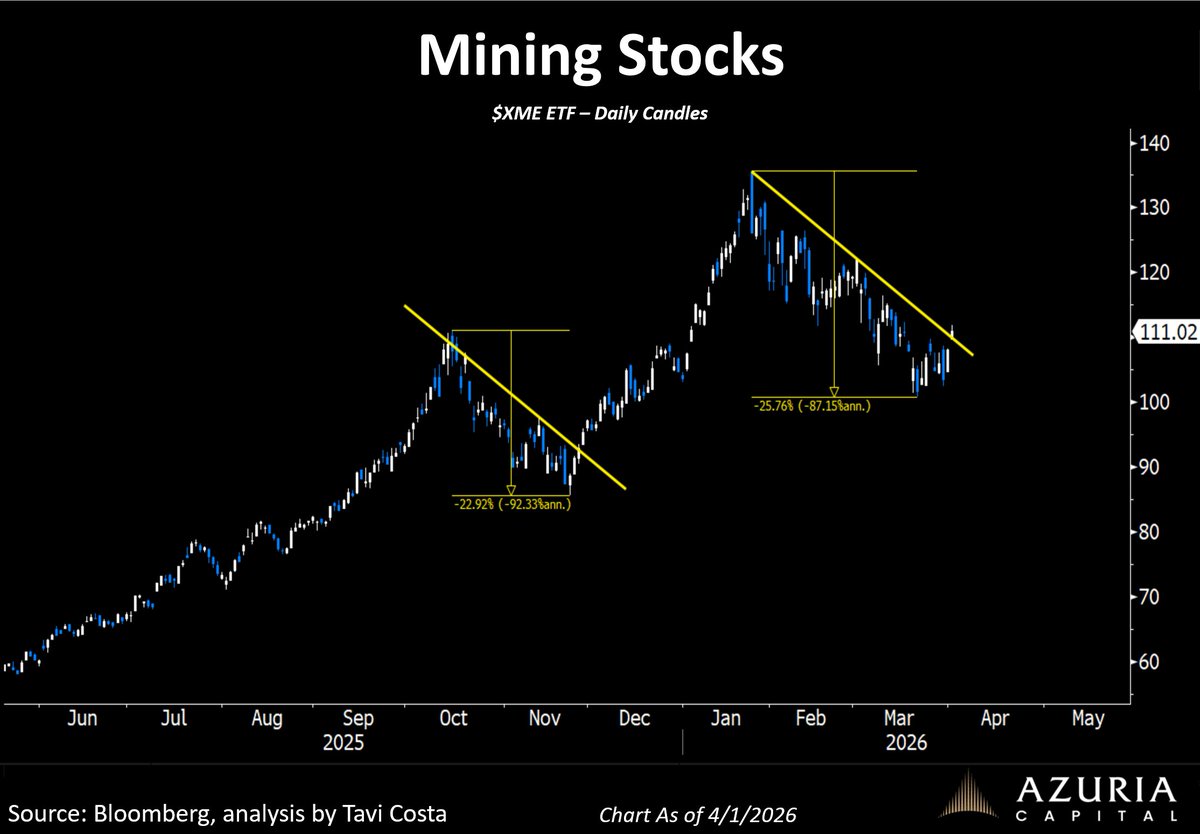
Mining stocks breaking out again after a 25% correction.
Secular bull markets don’t move in a straight line — they come with multiple pullbacks.
Stay focused on the bigger picture, or volatility will shake you out.
https://t.co/a090girBmr