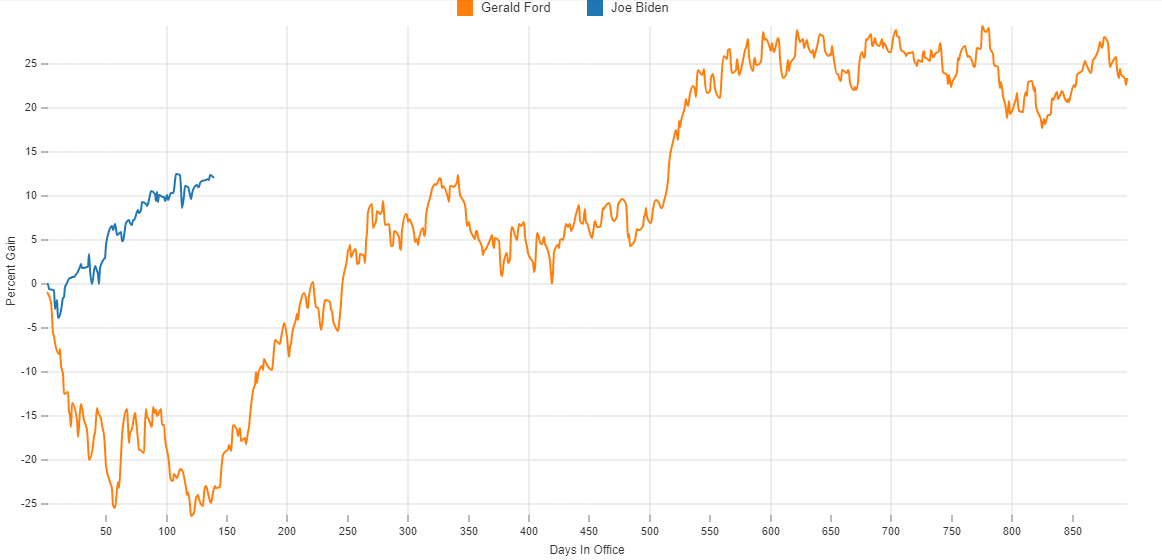
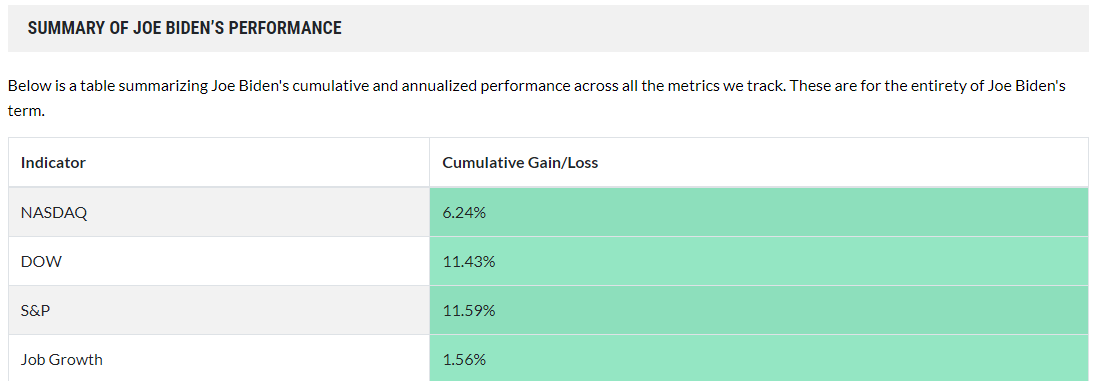
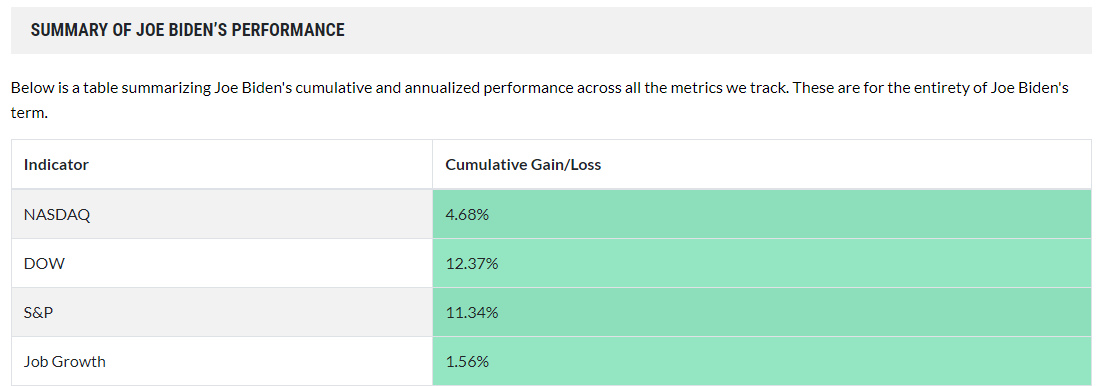
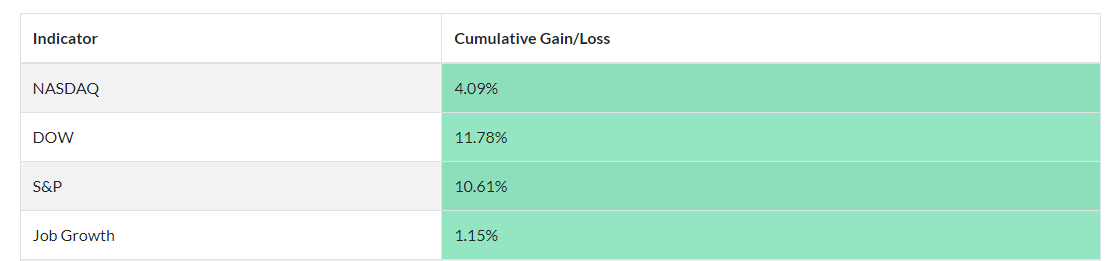
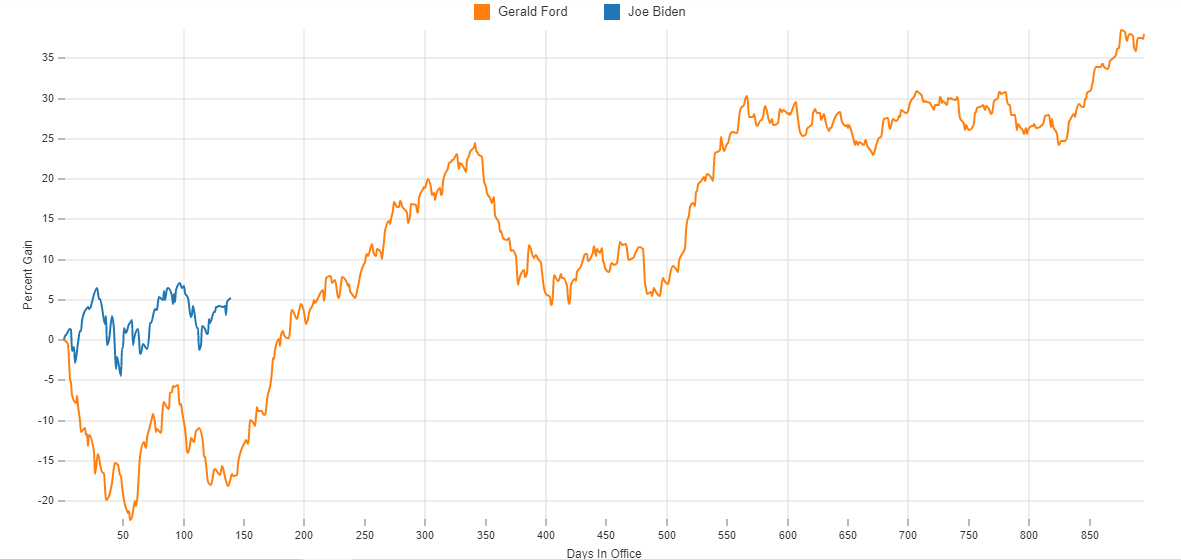
As we finish off our look at the presidencies of Joe Biden and Gerald Ford we turn our attention to the #Dow Jones stock index.
Once again, it is #Biden who is doing better in the early stages of his presidency than #Ford did.
See more on our website: https://t.co/Tl6SFw40pt
6/10/21 update:
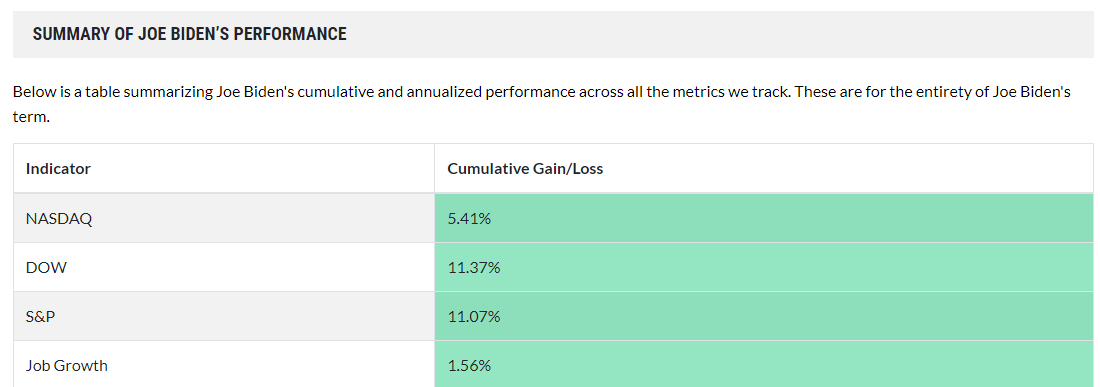
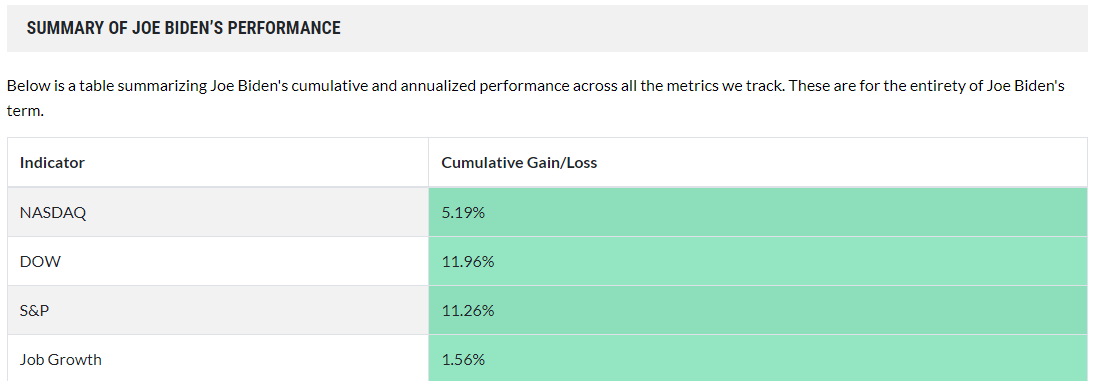
President Joe Biden has improved his position compared to Donald Trump on all 3 indexes.
After 142 days of presidency:
#Nasdaq: +5.8% #Trump (-0.8%)
#Dow: +3.6% #Biden (+0.0%)
S&P 500: +4.2% Biden (+0.5%)
See more in today's full report: https://t.co/UYCHg1Pnj2
This morning we take a look at how the early stage of Joe Biden's presidency compares with Gerald Ford's time in office.
The graph shows #jobs growth for the pair and we can see that #Biden is well ahead of #Ford.
Compare more presidents on our website: https://t.co/O5Gx9xoGDk
6/9/21 update:
It was a mixed day for President Biden in his #stockmarket comparison with Donald Trump.
After 141 days of presidency:
#Nasdaq: +6.6% #Trump (-2.0%)
#Dow: +3.6% #Biden (-0.9%)
S&P 500: +3.7% Biden (-0.1%)
See more in today's full report: https://t.co/p9IpNS1tu5
Today we take a look at President Biden's record on the #Nasdaq stock index compared with Republican Gerald Ford.
The graph shows that the Nasdaq has performed better at the start of Biden's presidency than it did under Ford's.
See more on our website: https://t.co/Tl6SFvMp0T
6/8/21 update:
Biden has lost a little ground to Donald Trump on all 3 indexes since yesterday.
After 140 days of presidency:
#Nasdaq: +8.6% #Trump (+0.1%)
#Dow Jones: +4.5% #Biden (-0.2%)
S&P 500: +3.8% Biden (-0.0%)
See more in today's full report: https://t.co/JYPD4h6HJM
US jobs growth picked up again in May following what were widely regarded as disappointing April figures as 559,000 #jobs were added.
#Biden has had a better start to his presidency on this metric than both Donald #Trump and Barack #Obama.
https://t.co/63Gck87VwV
Yesterday, we looked at jobs growth under Ronald Reagan and George W Bush. Today we take a look at how the Dow Jones performed under the pair.
Reagan, once again, emerges as a clear winner.
Compare more presidents on our website: https://t.co/O5Gx9xoGDk
6/7/21 update:
There hasn't been much change in the #StockMarket comparison between Donald Trump and President Joe Biden.
#Nasdaq: +8.5% #Trump (-0.6%)
#Dow: +4.7% #Biden (-0.2%)
S&P 500: +3.8% Biden (+0.2%)
To start the week, let's take a look at how George W Bush and Ronald Reagan stack up.
The graph shows the #jobs growth rate for the pair. It is plain to see that #Reagan (blue line) has a far superior record to #Bush.
See more Bush v Reagan metrics: https://t.co/8og0Svgxru
6/4/21 update:
All 3 stocks indexes made gains on Friday, meaning that President Biden has improved his position in comparison with Donald Trump.
#Nasdaq: +9.1% #Trump (-1.6%)
#Dow: +4.9% #Biden (+0.6%)
S&P 500: +3.6% Biden (+1.0%)
See more: https://t.co/K4t9RPCrEl
You may be wondering why we use % gain rather than points gain when reporting stock market data.
If you are our explainer says:
"Percentages make it easy to understand and compare how significant the movement in the market is."
Read more: https://t.co/XwB07ACkaQ
6/3/21 update:
President Joe Biden has lost further ground in his comparison with Donald Trump.
After 135 days of presidency:
#Nasdaq: +10.7% #Trump (+1.1%)
#Dow Jones: +4.3% #Biden (-0.1%)
S&P 500: +2.6% Biden (-0.4%)
See today's full report: https://t.co/jFciPnuT2s
To conclude our look at the presidencies of Richard #Nixon and Gerald #Ford we take a look at perhaps the most important metric of all: #jobs#growth
The pair are almost level at the end point of Ford's presidency
Compare more presidents on our website: https://t.co/O5Gx9xoGDk
6/2/21 update:
President Biden has lost further ground in his stock market comparison with Donald Trump.
After 134 days of presidency:
#Nasdaq: +9.6% #Trump (+0.9%)
#Dow: +4.4% #Biden (-0.2%)
S&P 500: +3.0% Biden (-0.3%)
See more in today's report: https://t.co/gxbCHrqiiV
As we continue our look at how the economy fared under President Nixon and President Ford, today we turn our attention to the S&P 500 #stock index.
We can see that Ford emerges well ahead.
See more #Nixon v #Ford on our website: https://t.co/J3Fxy8YR93
6/1/21 update:
Joe Biden has lost a bit of ground in his stock market comparison with Donald Trump.
#Nasdaq: +8.7% #Trump (+0.8%)
#Dow: +4.6% #Biden (-0.2%)
S&P 500: +3.3% Biden (-0.7%)
See the full report: https://t.co/QRZD5XPQC9
As we continue our look at presidents Gerald Ford and Richard Nixon, it's the turn of GDP growth.
The graph shows that #GDP grew faster under #Ford than under Nixon, but that #Nixon saw GDP increase by more overall.
Compare more presidents: https://t.co/O5Gx9xoGDk
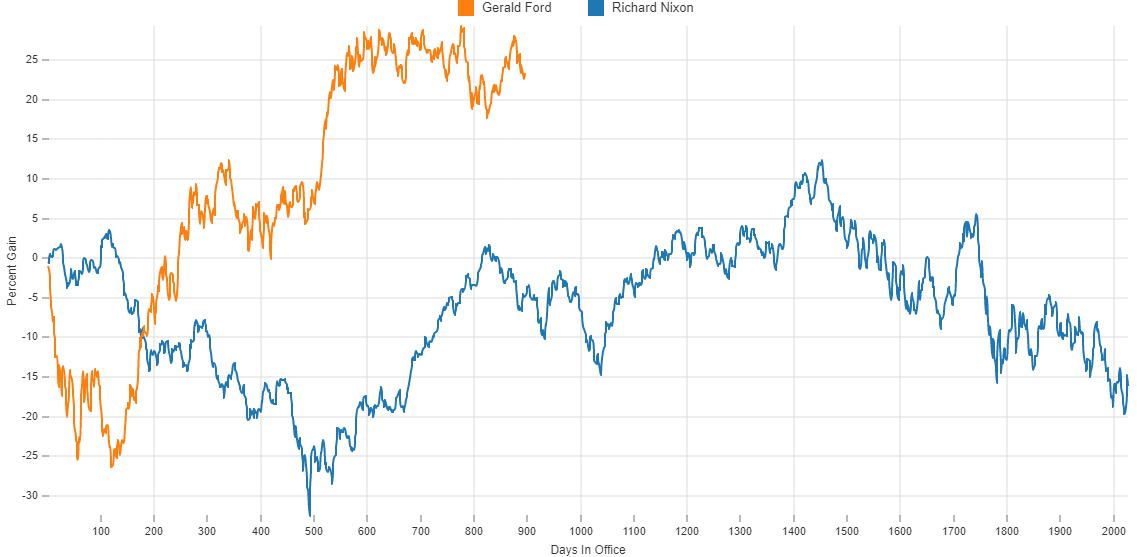
We're going to have a look at the presidencies of Richard Nixon and Gerald Ford this week. Today, we compare how the #Dow performed under the pair. Ford, as we can see from the graph does rather better.
You can see more #Ford v #Nixon here: https://t.co/J3Fxy8YR93
What is the ideal #GDP#growth rate?
That's a question we have a look at today. Our explainer on the subject says:
"The ideal GDP growth rate depends on the country and its economic expansion cycle."
Read more: https://t.co/FktDWbUsTm