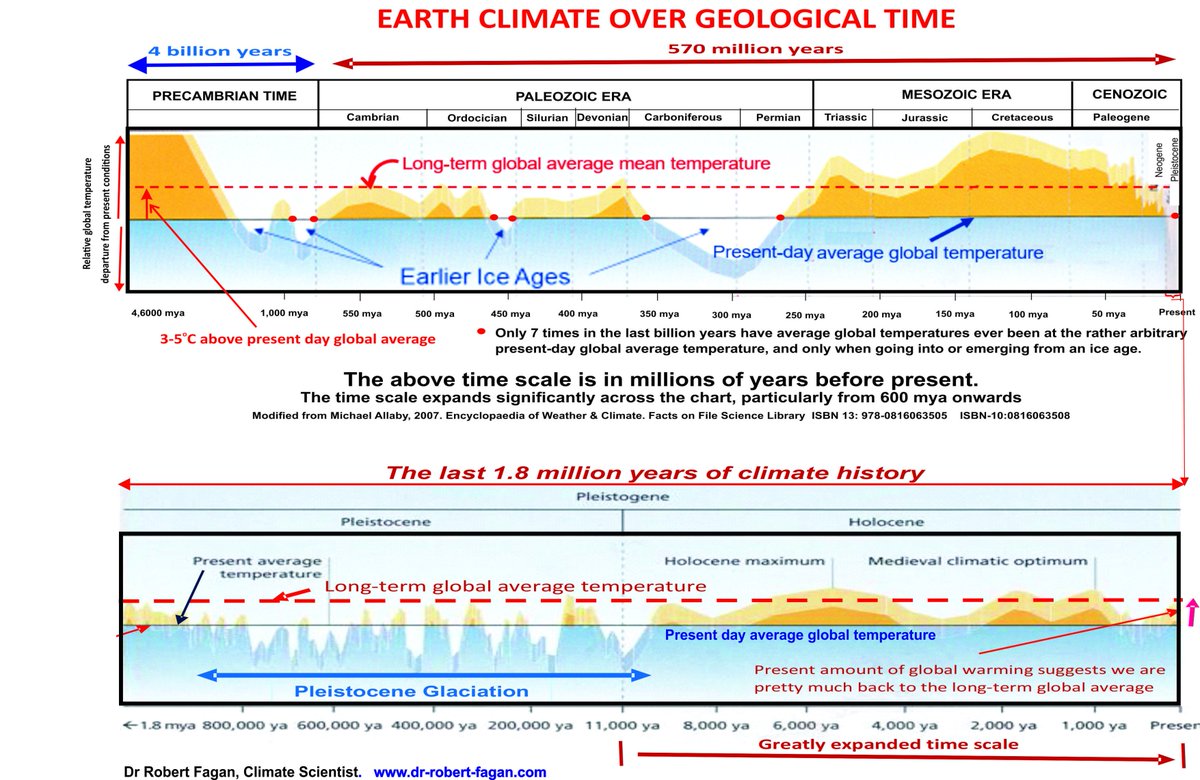
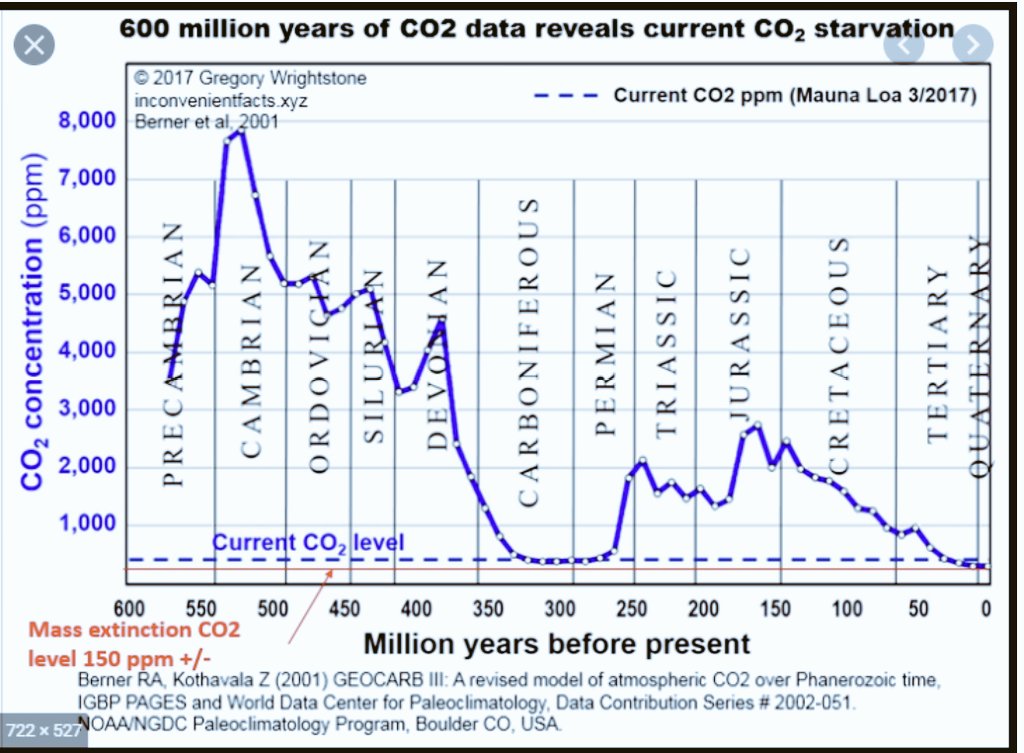
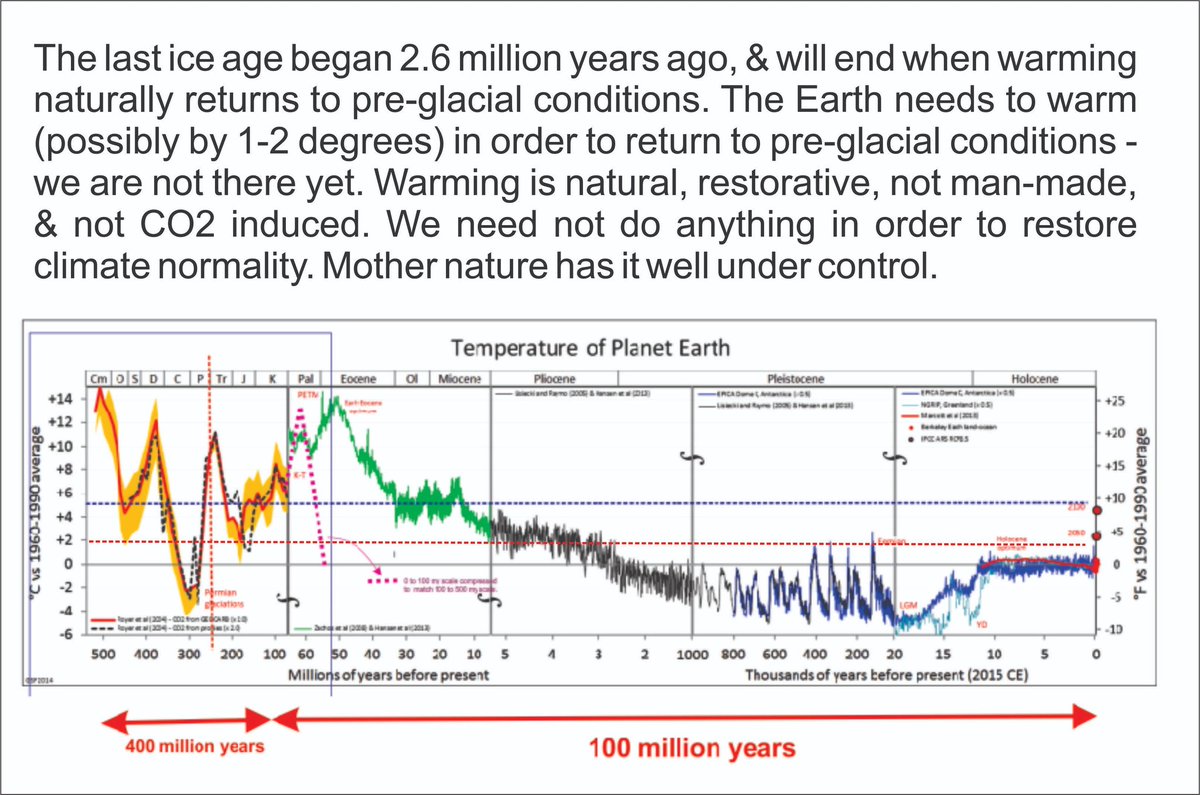
If the preferred global mean temperature for the Earth is considered to be 15 degrees centigrade , why has this temperature only very rarely been achieved in the last one billion years (see red dots in chart below), and only then when when entering or emerging from ice ages.
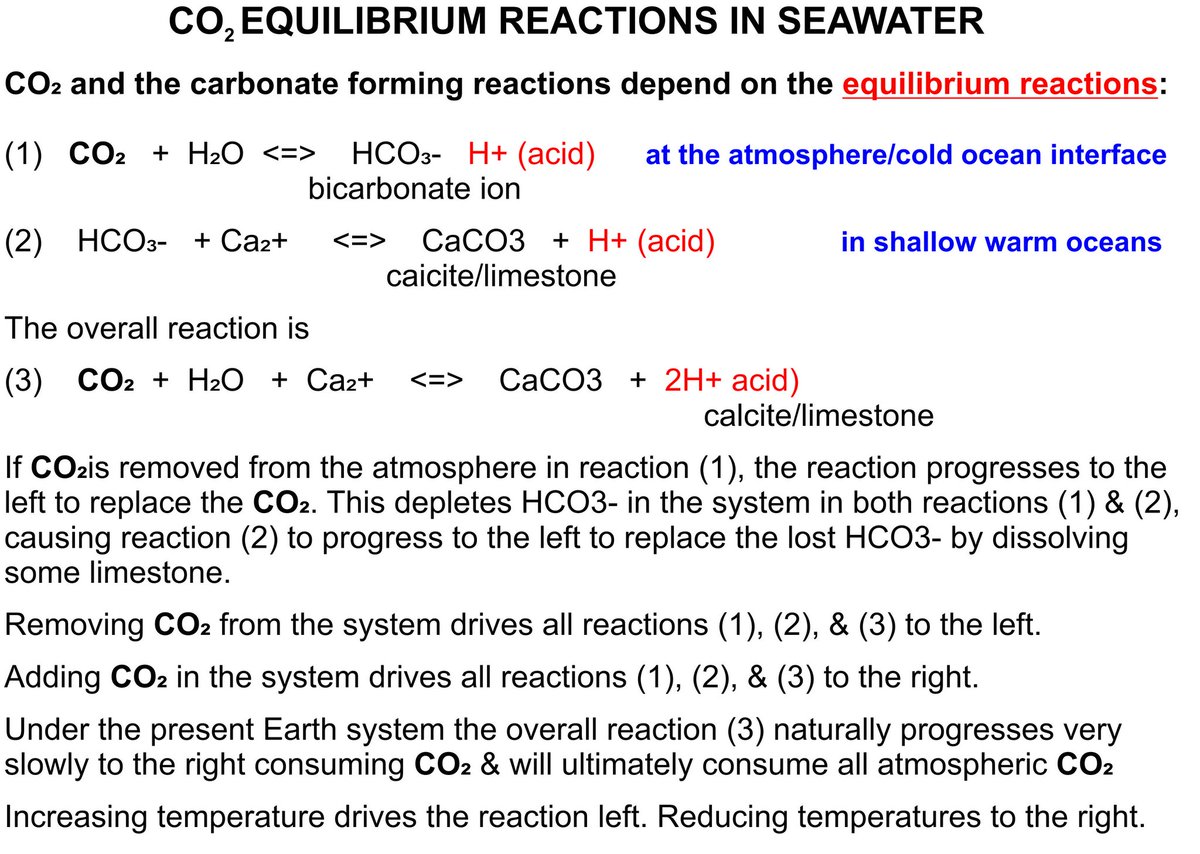
@HetabK@PeterDClack CO2 is being continually depleated because CO2 is more soluble in the ocean as bicarbonate than stable in the atmosphere as CO2.
The early atmosphere was over 90% CO2 in the Early Archaean & will eventually be becompletely converted to limestones (50% CO2 by weight).
@Dog4Running@PrezLives2022 Quite right. Something so complicated involving so many compliant people would almost inevitably come adrift & be discovered. The result would be serious reputational damage & jail time. Who would risk this?
@jemmm85517813@ChrisMartzWX The stable form of carbon is CO2 or cabonates in oxidising conditions, elemental carbon in neutral conditions, methane in reducing conditions, & organic forms of carbon in living organisms. Depending on the local environment carbon will convert to the appropriate stable form.
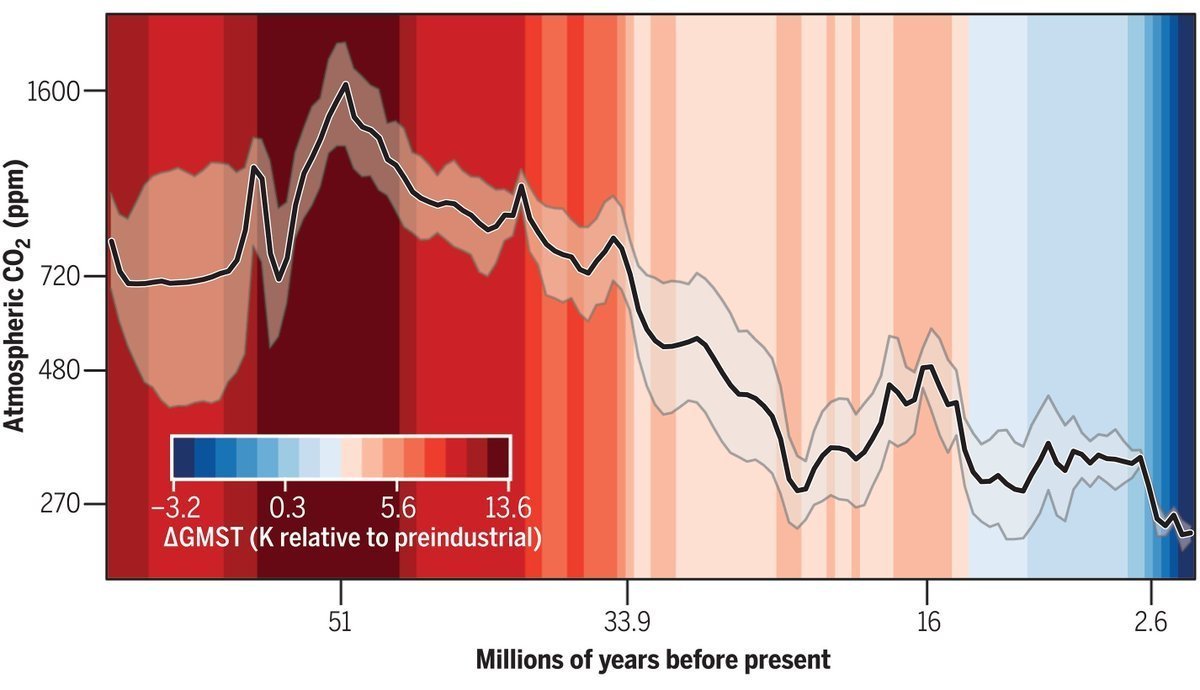
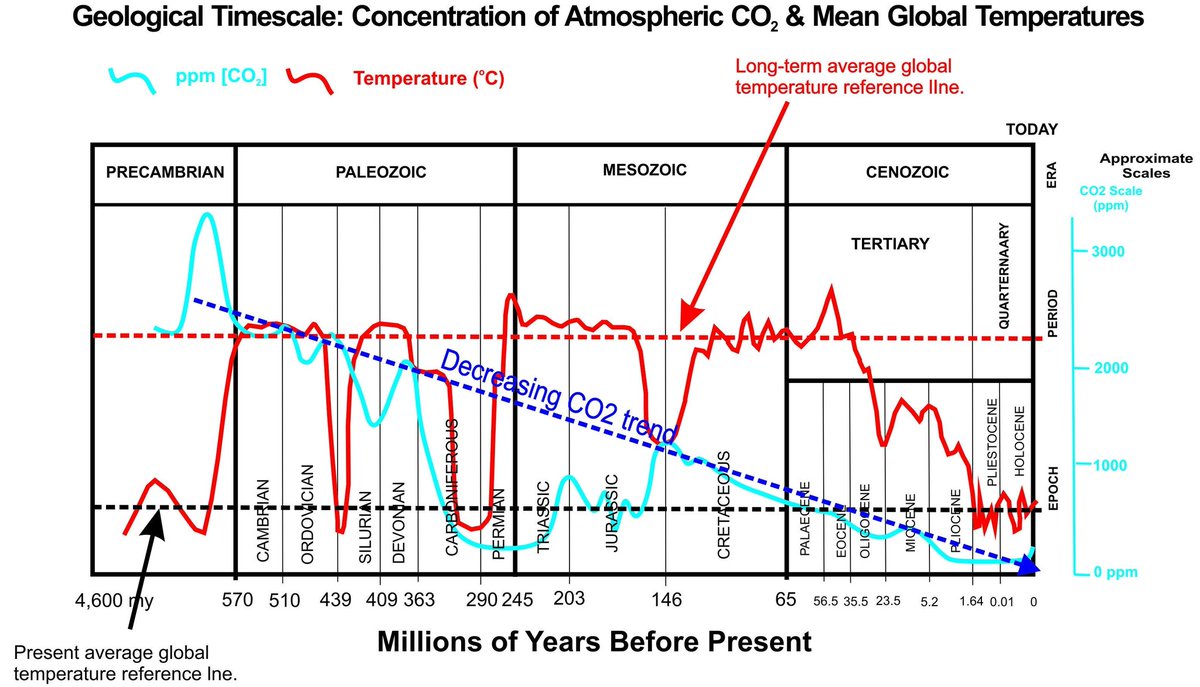
@Ceist8@TWTThisIsNow@catandman The two CO2 charts depicted below are virtually the same for the same time interval depicted. If Nasif Nahle is a crank with zero expertise then he is doing a remarkable job.
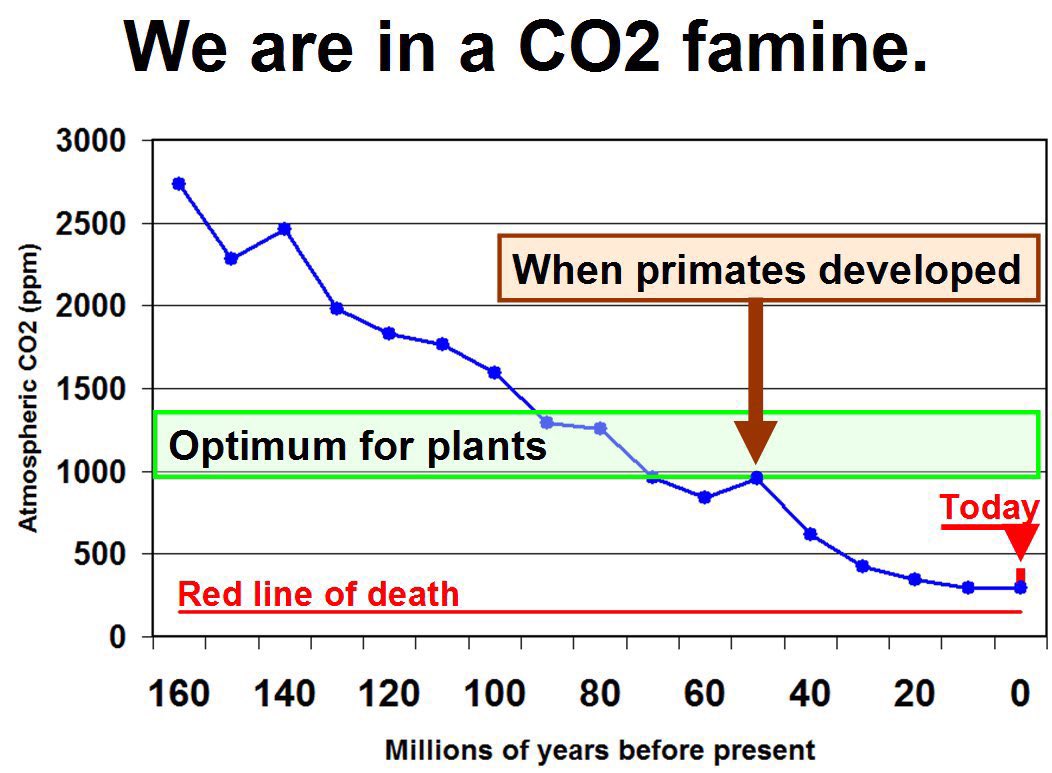
@cookin_bakin@goddek 1000 ppm CO2 was normal & optimum for plants until the inevitable drain of CO2 into the ocean dropped below 1000 ppm. The industrial revolution put more back into the atmosphere. Ultimately it will all disappear into the ocean as HCO3- then as limestone CaCO3 (44% CO2 by weight).
@RepRickShepherd@goddek 1. The main nutrient that plants provide is carbon.
2. The ocean pH is 8.1 which is alkaline. Acid is when pH drops below 7. There is no carbonic acid in the ocean as if there was the pH would be under 7.
3. Rain at pH of 5, acidifies the ocean more than CO2. Ban rainfall.
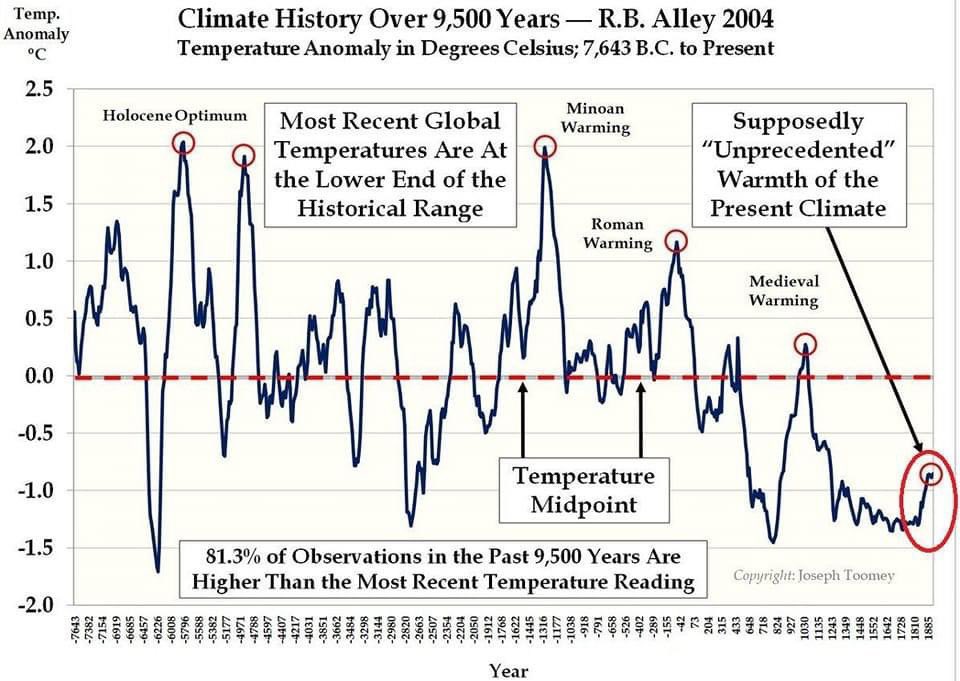
@fishinoz@wideawake_media The rate of temp change is reflected in the slope of the lines. These tend to look remarkably similar. There is no dramatic change in the speed.
@Vecktooor@wideawake_media The rate of the temp change on these charts is reflected in the slope of the lines. The warming & cooling rates look remarkably similar.
@MooYar345@sjyellehS @humanbeingawk Soil carbon is also eventually oxidised back to CO2 & returned to the atmosphere because the stable form of carbon at the Earth's surface is CO2, carbonate ions or living life.
@sjyellehS @humanbeingawk Trees do absorb & store atmospheric CO2 as they grow. However when they die that CO2 is largely returned to the atmosphere as the decaying organic carbon is oxidised back to CO2 in the atmosphere. The CO2 storage is only temporary.
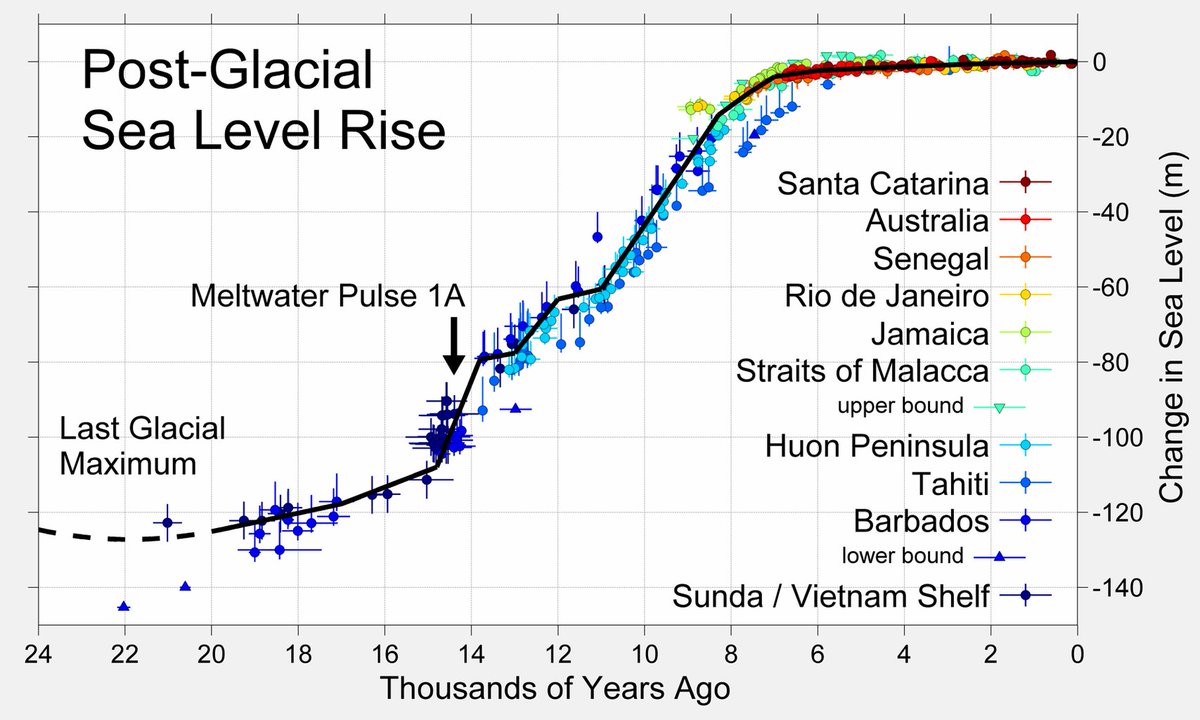
@DaddyWri@ChrisMartzWX This chart of sea level rise shows there has been very little warming resulting in significant polar ice melting in the last 6,000 yr. Assuming 6 m in last 6,000 yr equals 1 mm/yr. In the last 2,000 yrs this seems to have slowed even further & stabilised.
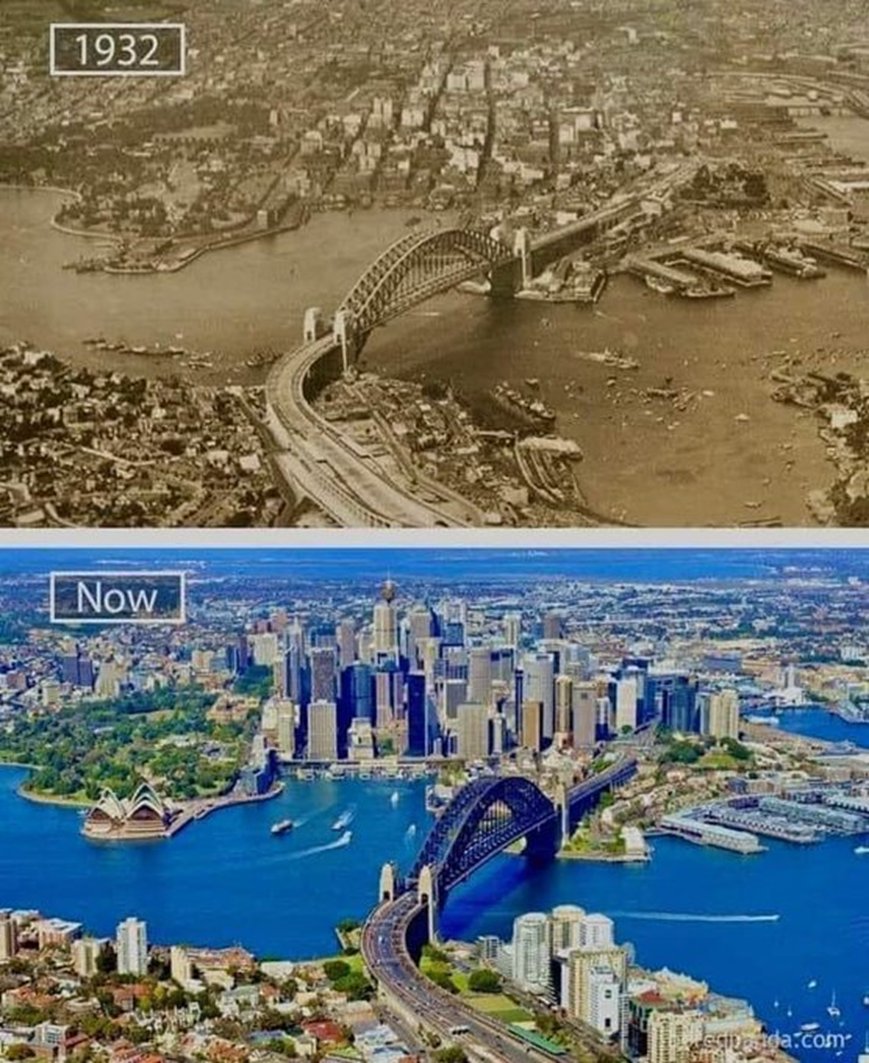
@Alexum1000@ChrisMartzWX Sydney Harbour used to be a river valley extending out to the edge of the continental shelf (an extension of the Paramatta River).
Sea level has risen over 100 metres on the last 10, 000 years, but only a few metres in the last 6,000 years.
@ssrok@ChrisMartzWX There is no perfect temperature for Earth. The longer term average temperature is some 5 degrees C warmer than now & last achieved some 30 million yr ago. See dashed red line. Waming by 2-3 degrees should take us to ideal conditions prior to the onset of the present glaciation.