The Delta Profile my full breakdown.
How I use it to trade expansion on absorption & reversal using large stacks of delta/outlier delta https://t.co/Tiyv1ZuYPg
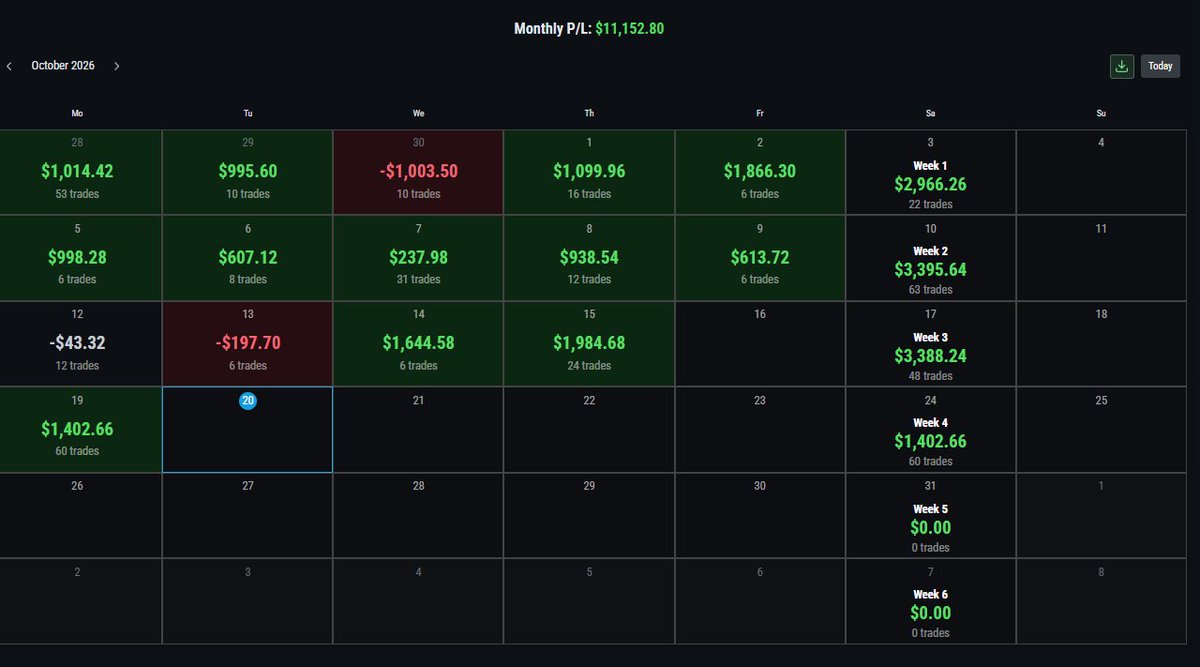
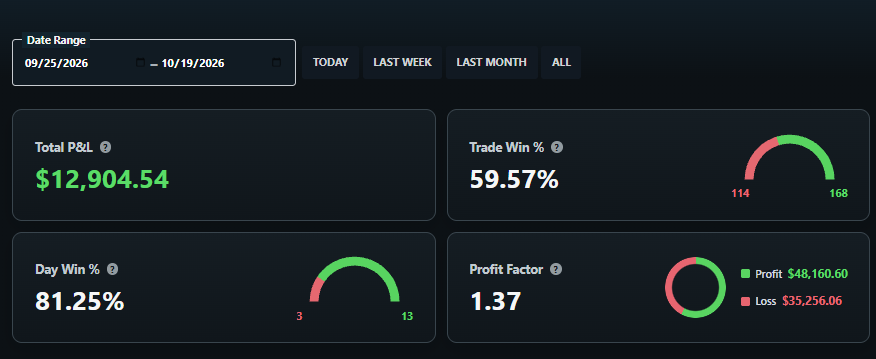
I'm not winning every trade.
I'm getting sliced and diced by the market all the time. But I make sure those slices aren't massive wounds. That's the key.
These trading influencers who act like they win every trade and make a fortune every day are full of crap.
I very often end up taking 1 or 2 losses before catching a solid winning trade that makes much more than the 1 or 2 small losses. You gotta lose to win.
6 footprint patterns and what each one means. Bookmark this before your next session.
None of them are trades on their own. All of them form a setup at a level.
A sharp tail at the high means the auction finished there. A flat top means it didn't.
Excess is a tail of single prints within a session's high or low: price went there and was rejected fast.
It means the auction finished in that direction. A strong opposing participant showed up.
A high with excess is a reference and a high without it is a poor high, and can be treated as a target.
The free @CMEGroup trading sim page may be interesting to people wanting to tap into futures trading.
I usually don't recommend sim trading, but this offers tools and an environment that teaches more than just buying and selling (incl. real options chains & L2 data, risk tools).
Three Observations with Limit/Market Orders
1 ) The more time that is spent away from a level = the more limit orders end up being stacked at a level (assuming all other factors are equal, this makes sense because as more time passes = the market collectively as a whole has more opportunity to go and place orders at a particular price)
2 ) The more limit orders that are stacked at a particular level = the more market orders will be executed once price reaches that level. There is more incentive to execute larger market orders directly into large limit orders because slippage cost is going to be lower.
3 ) The more market orders that are executed = the more volatility I can expect to see come through. Market orders actually move price, so if there is $0 in market orders at a level there will be 0 movement, if there is a huge amount of market orders that come through then there will be a lot of movement.
By combining all 3 of these observations together:
• The more time that is spent from a level = the more limit orders I can expect to be stacked at that level = the more market orders I can expect to see come through once price touches the level = the more violent the reaction I can expect once price reacts to the level.
Being able to set expectations on Volatility before even entering a trade can make everything to do with trade management significantly easier.
🌶️
Every tool on my ES/NQ chart, and exactly how I use it.
People always ask what's on my screen. Here's the full breakdown. Nothing fancy, everything has a job.
Context → Location → Confirmation → Execution 👇
A thread 🧵
Most traders read a footprint imbalance straight across. It's read diagonally.
You compare the ask at one price with the bid one tick below it. That's who traded against whom as price moved up.
If price closes through the zone instead, the buyers there are trapped. That's a different trade.
Introducing dealer-flow GEX.
Most GEX charts guess who bought and who sold based on open interest. On SPY’s front two months, our flow data shows the opposite across 60% of open interest.
JPMorgan has moved its gamma model to flow. UBS uses options-flow analysis to understand dealer positioning.
OpenMarket’s GEX now runs on dealer flow. Every US options trade feeds the model behind your walls and gamma flip.
Real P/L screenshot can still be a misleading advertisement.
Lanto now acknowledges around 800 accounts and roughly $300k in expenses. That is the history people needed alongside the big winners and it is still not fully transparant.
Rough expense figure in the video is still not a complete record of purchases, failed accounts, fees and money actually received.
Explaining the $21k answer as “that day” doesn’t undo the impression the original reply created. And $21k spent on accounts in a single day is itself an extraordinary cost to leave out of the story.
Posting the winning accounts while leaving the failed ones out gives people a distorted picture. I would argue that hiding blown accounts is the same as Photoshopping P/L.
Even if you’re net profitable, I consider that misleading and unethical. This sort of promotion deserves regulatory scrutiny.
The affiliate incentive makes this worse. Promoter can get paid when someone buys an account, even if that buyer never receives a payout. If you earn from referrals, disclose that separately from your trading results.
How many ordinary retail traders can afford hundreds of attempts while waiting for one move to cover everything they’ve spent? That is the gambling mentality this sort of marketing encourages.
Imagine you’re on account 420. You’ve paid for attempt after attempt. You finally catch the move that could recover your fees and leave a profit. Then the firm rejects your payout request.
You’ve already paid the fees. The green P/L doesn’t pay your bills unless the money arrives.
The payout screenshot used in this video itself says “Processing.” Request is not a completed payment.
Show the full account history, what was actually paid in fees, what was actually received, and any affiliate income separately. Over the same period.
Being net profitable doesn’t give anyone a free pass to mislead people buying the product.
My view hasn’t changed: sim prop firms are a cancer on the trading industry. I don’t recommend them to retail traders. Trading should be done through a regulated broker, rather than a sim-prop casino model where one lucky streak is supposed to pay for all the failed attempts. What happens if your payout gets denied?
Take away the affiliate codes and the livestreamed jackpots, and how much demand is really left for these prop firms pretending to be “helping traders”?
And for the livestreamers who think calling price in real time is proof of skill: doing it live doesn’t erase the cost of all the failed attempts.
Around 800 accounts. Roughly $300k in claimed expenses. The video still doesn’t reconcile that total.
Let that sink in before mistaking a livestreamed winner for proof of a repeatable way to trade.
This is your sign to focus on YOUR trading and YOUR risk tolerance.
You’re the one paying for the attempts.
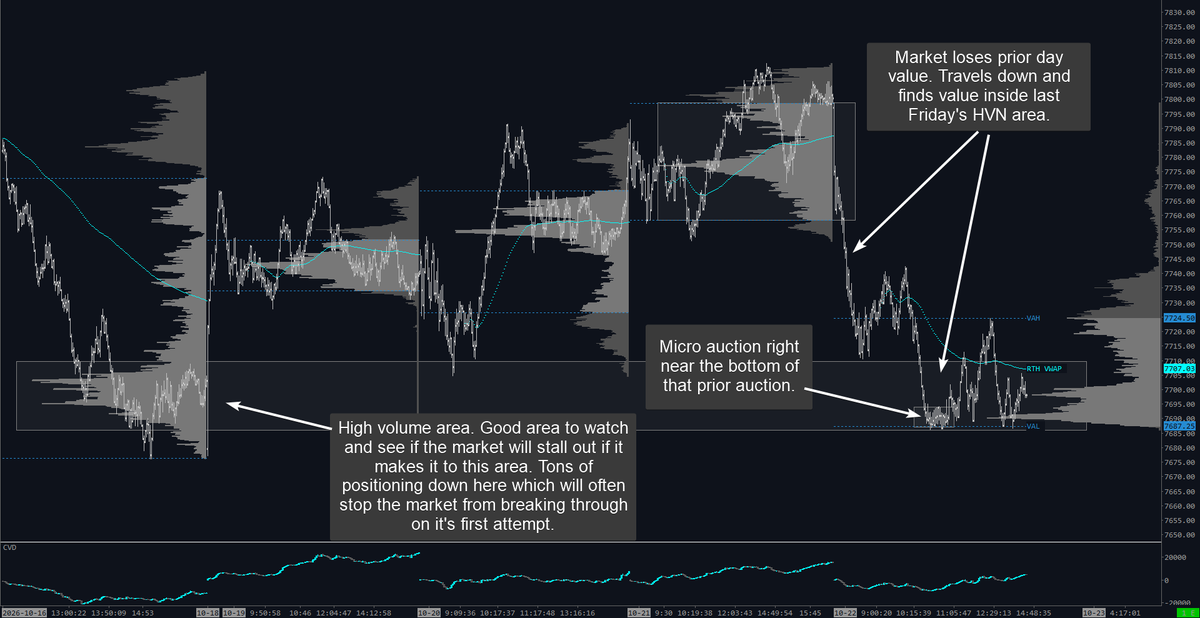
The market often seeks high volume areas from prior sessions after breaking out of recent auctions such as prior day value.
Today, we ended up getting a micro auction (with heavy volume) right near the bottom of Friday's high volume area.
When you see it stall hard like that in a prior auction it's a good spot to consider taking profits on shorts or sit out for a bit as it digests the move down. The market usually won't break through on the first attempt. It usually cools off for a bit first.
This is the path... prop 2 brokerage!! make that money in prop take it to (your) brokerage where you can fuel up your personal brokerage, trade your way however you want in your brokerage
I flipped $140 Prop Accounts to a $6K Payout. Then funneled that $5K (Cashed out $1K) into TopstepX and turned it into $18K in 16 Trading Days on Live Brokerage.
That's $140 of Risk to $19,000.
Being underfunded was never the excuse.
Restart?
$SPY has been stuck in a $2 box for 4 hours.
Not random. Positive gamma. Dealers are long +$791M gamma, so they sell every rip into 770–771 and buy every dip at the 768 put wall.
That's why breakouts keep failing today. I saw this box before it formed.
Every level on this chart came from @GEXEdgeIO
• Pin magnet: 770
• Call wall: 769
• Gamma flip: 768.33
• Put wall: 768
Stop guessing where price will stall.
See where dealers are positioned.
Try $19 👇 https://t.co/rEfgGeknj6
serabut. kau dah tahu prop ada cap (FAQ), kau buat jela berapa yang patut then take the money, ni buat lebih padahal dah tahu berapa je boleh bawa keluar lepastu nak bising.