#Bitcoin/ Stock market – What’s Next?
The Big Sunday Report: All You Need to Know
🚩 TA / LCA / Psychological Breakdown: There is a lot of misinformation and confusion circulating about the current macro environment, the Federal Reserve’s actions, and how they affect both the stock and crypto markets. Let’s clear up these misunderstandings step by step in three parts:
1️⃣ QT vs. QE — What’s Actually Happening:
2️⃣ Misunderstanding #2: “The Fed Printed $50bn
3⃣ Misunderstanding #3: “QE IN 6 MONTHS"
Thank you for reading, make sure to join the Free Telegram channel: https://t.co/zkdgaR6H3c
1️⃣ QT vs. QE — What’s Actually Happening:
There is a lot of misunderstanding and wrong information circulating about the current market situation. First of all, the end of Quantitative Tightening (QT) is not the start of Quantitative Easing (QE). These are two completely different stages in the monetary cycle. QT means the Federal Reserve is reducing liquidity by letting bonds mature without reinvesting, means in other words, the FED collects back its dollars to pressure down inflation, while QE means the Fed is expanding its balance sheet and injecting new liquidity through asset purchases, which in other words mean money printing. Jerome Powell did not announce QE. He announced that QT will officially end on December 1, 2025. Unlike many analysts that claim that QT ended on the date of the FOMC meeting, its one more big misunderstanding! On the FOMC date, it was announced that QT is going to end on 1st of December, not that it already ended, thats a big difference! Until then, the Fed continues to reduce liquidity in the system. Historically, the Fed only begins QE after a liquidity crisis develops, such as in 2008, the 2019 repo crisis, or the 2020 Covid crash. That pattern has never changed, and there is no evidence that it will be different this time.
2️⃣ Misunderstanding #2: “The Fed Printed $50bn:
One major misunderstanding concerns the idea that the Fed “printed” 50 billion dollars last Friday. This is incorrect. What actually happened was a 50 billion dollar liquidity operation through the Fed’s Standing Repo Facility (SRF). These are overnight loans, not permanent injections of cash. The banks that borrowed this money are required to return it the next day, with a small amount of interest. This means there is no new money created and no permanent increase in the money supply. It is only a short-term liquidity bridge, not quantitative easing or money printing.
To understand this better, it is important to know the difference between the regular repo market and the Fed’s Standing Repo Facility. In the regular repo market, banks and institutions lend to each other overnight using Treasury securities as collateral. The SRF, on the other hand, is a direct backstop provided by the Federal Reserve, introduced in 2021 after the 2019 repo market collapse. The SRF allows banks and primary dealers to borrow cash directly from the Fed, up to a limit of 500 billion dollars per day. This does not mean the Fed prints that amount daily. The funds are lent and then repaid the next day, so the Fed’s balance sheet remains unchanged. If daily borrowing ever comes close to that 500 billion cap, it would signal extreme funding stress, likely appearing first in Japanese or European banks that rely heavily on dollar liquidity.
In normal market conditions, SRF usage is around zero to five billion per day. Seeing fifty billion in a single day is a clear sign of stress. The reason banks used the SRF instead of the regular repo market is because liquidity in the private repo market has dried up. Money market funds that once held around 2.2 trillion dollars in the reverse repo facility have been drained to about 14 billion today. Private lenders are short on cash and are charging higher rates, making borrowing expensive. As a result, banks are being forced to use the Fed’s channel, the SRF, to secure short-term liquidity.
Since August and September I have repeatedly pointed out that a liquidity crisis was forming in the repo market, and we are now seeing the first visible signs of that stress. The surge in SRF usage confirms that the system is tightening. The drained reverse repo pool means there is almost no excess liquidity left. The continuation of QT adds more pressure and makes it harder for banks to fund themselves cheaply. We are entering the late phase of QT, where cracks begin to show, and historically this stage always precedes the next policy shift, usually the start of a new QE cycle.
3⃣ Misunderstanding #3: “QE IN 6 MONTHS":
What most people have absolutely no clue about is that the Federal Reserve conducted QT for the first time in its entire history only in 2017, and it ended in disaster, with the 2019 repo market collapse, followed by the COVID crash. Exactly the same setup we’re witnessing right now. QT ran from October 2017 to September 2019, and just six months later, in March 2020, the Fed was forced to launch a massive QE program after the markets collapsed during Covid. That six-month gap happened only once in history, because 2017 was the first QT in the entire history of the FED. The 2020 QE came six months after QT because it was the first and only time the Fed ever stopped tightening. You can’t take that single data point and pretend it’s some kind of average or pattern. The Fed itself is still experimenting, it has never been here before, and even policymakers are operating blind.
The truth is simple: the system is cracking again, liquidity is drying up, and the real crisis hasn’t even started yet. The REPO is the beginning and we will see much worse days ahead, combined with the current goverment shutdown, so Democrats can blame the Republicans and vice versa.
Regarding #Bitcoin my position remains same, fully in USDT and shorts with an average short entry of 119k. Short orders are placed in the region of 117k to accumulate more shorts if market allows to visit
I can’t repeat it more often but joining DrProfit Premium can truly change your life as many testimonies are showing. Join here: https://t.co/4ilNrRrtAu
Trade with DrProfit on BloFin: https://t.co/BfOK8FYGfj
THIS IS NOT FINANCIAL ADVICE BUT EDUCATIONAL CONTENT ONLY. ALL WRITTEN HERE IS MY OPINION AND MY OWN TRADING AND INVESTING STRATEGY
Well conditions must be looking more optimistic if we are seeing a billion dollars being commited for a new launch. It's wild to think that prediction markets can now create buzz within it's own ecosystem. Higher odds = more fomo = more momentum.
Price expectations for #BTC are as follow:
In the short term, the market still shows limited signs of a potential relief scenario, meaning a temporary bounce or dead cat move could occur before the main move which is to the downside, continues. There are three types of trades: short term, mid term, and long term.
While the mid and long term remain clearly bearish, the short term shows the idea of a relief pump, in other words dead cat bounce, in other words a pump that happen before the next big downside move. This was the reason we took profits on our short positions yesterday and re-entered the market through BTC spot.
As of today, however, the data no longer supports that relief scenario. Therefore, I’ve reversed the short-term positioning, sold the BTC spot and re-entered the short side. Nothing has changed in our broader plan. We are in the early phase of a bear market. While short-term dead cat bounces should be considered and traded when worth it, the big picture remains extremely bearish.
Short Term (This Month): Neutral, yesterday slightly bullish rather than bearish, but with new data its back to neutral, we need more data to give the final short term decision. The short-term direction remains data dependent which is not fully available at this point due to the recent big move. This is why the chart shows the potential of a relief pump.
Mid Term (1–3 Months): Bearish. As in our original plan and main analysis since the region of 115-125k, Bitcoin top was reached and we are in the first days of the bear market. Potential dead cat bounces are possible but all in all the mid term price direction goes clearly to the downside
Long Term (3–12 Months): Also as explained in many Tweets weeks ago, the long term scenario remains extremeley bearish. Nothing changes on this fact that the entire macro economy is set for a global earthquake, and its very close. Closer than most of people believe
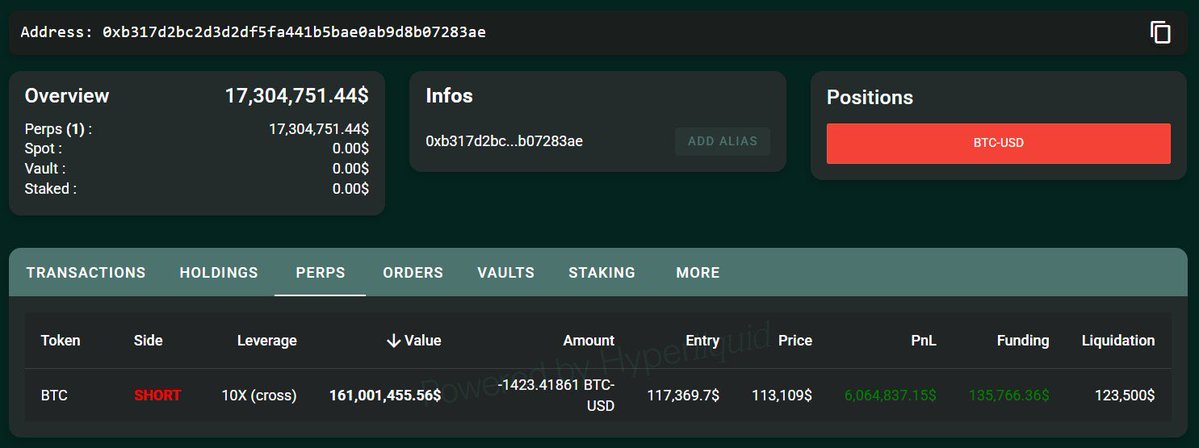
The insider who made $191M from shorting BTC just minutes before Trumps Tariff announcement, has just opened another short on Bitcoin worth $161M
Does he know something? 👀
ETH and Bitcoin are pumping past all time highs...
And people in my comments are actively talking shit saying we aren't even pumping...alts not even moving...STOP CELEBRATING.
lol...This is not what a top looks like. We are going so so so so much higher.
10/ KEY DATES - PEAK CANDIDATES:
Oct 20 (Mon): 26 days
Oct 22 (Wed): 28 days
Oct 24 (Thu): 30 days ⭐
Oct 27 (Mon): 33 days
Oct 29 (Wed): 35 days
Wanna watch the countdown with us on discord?
https://t.co/tvx5ATRtap
Trust God’s process.
This accumulation zone is a gift to believers, to those not afraid have patience, to those with the will to persevere.
Day 95 of the infinity DCA permatwap on $GIGA
MAGIC INDICATOR! 👏It gives buy signals before pumps and sell signals before dumps. I share these signals for free and with full transparency because I know how powerful the CrossX indicator is.
Right now, $BTC has dropped back into the Gray Cloud, which is an extremely strong support zone. If price breaks below the Gray Cloud, we’ll officially enter a bear market.
A buy signal here is the only confirmation that we’re not losing the Gray Cloud and that a reversal could happen at this level.
I’ll update you immediately when CrossX prints a buy signal, free and transparent as always. Or you can use it yourself here 👉 https://t.co/vE5KfRjGMy
Most are completely underestimating how out of control this market is about to get.
Your going to make so much you lose control of your bowels and you’ll be totally cool with it.