🚨Bitcoin cae por debajo de USD $72.000🚨
Strategy vende 32 BTC en medio de tensiones geopolíticas entre EEUU e Irán.
La criptomoneda se ubica en USD $71.980 con un descenso del 2,48% en 24 horas.
La venta representa un cambio simbólico en la estrategia de acumulación de la empresa.
Aumentan las salidas de productos de inversión cripto con USD $1.670 millones retirados la semana pasada.
La presión de mercado continúa con un entorno incierto.
Jane Street was allegedly dumping Bitcoin with ALGO every single morning at 10 AM for months.
This kept pushing the price down, liquidating retail traders, letting them buy back cheaper, and then repeating the cycle again and again.
As soon as they got sued, the daily 10 AM dump completely stopped. Bitcoin just had one of its best days in months.
One single trading firm was suppressing the whole crypto market for that long.
People panic-sold because of this nonstop dump.
Billions were liquidated every week.
So many lives destroyed.
Regular traders were trying to learn charts, TA and patterns for hours, only to find out the game was rigged against them.
They were not investing in the market, they were trading against a Billion dollar company with all the insider info.
🚨THIS IS WHEN CRYPTO MARKET WILL BOTTOM
Right now most people think Bitcoin already bottomed at $60K.
And they are wrong.
That was likely just a local bottom, not the final cycle low.
Let’s break down what actually needs to happen before the real bottom forms.
LIQUIDITY: THE BIGGEST DRIVER
Every major crypto bottom in history has happened when U.S. liquidity starts expanding again. Right now the opposite is happening.
YoY liquidity growth in the U.S. is still negative. That means money is being drained out of the system, not added.
When liquidity is falling:
Crypto sells off first.
Stocks sell off too.
Risk assets stay weak.
We are seeing exactly that right now.
The liquidity being provided by the Fed is simply not enough compared to what markets need to turn bullish again.
This is also why:
- Corporate bankruptcies are rising.
- Consumers are defaulting on debt.
- Economic stress is building.
Until liquidity turns positive, a full market bottom is very unlikely.
MAYER MULTIPLE: NOT AT BOTTOM LEVELS YET
The Mayer Multiple shows whether Bitcoin is overbought or oversold compared to its long-term average. At previous cycle bottoms, this metric dropped below 0.6 every time. Right now it is around 0.67.
That means: the market is oversold… but not at historical bottom extremes. So again, more like a temporary bottom, not the final one.
LONG TERM HOLDER REALIZED PRICE
This is one of the most reliable bottom indicators. It shows the average price where long term holders bought their Bitcoin.
Historically, Bitcoin cycle bottoms form very close to this level. Right now this sits around $41K, and BTC is nowhere near it.
That gives us a very important clue:
The real bottom zone is likely somewhere near a long term holder cost basis.
MINING ELECTRICAL COST
Mining cost acts like a bear market floor. Currently, electrical production cost is around $57.5K.
But during bear phases, this cost usually drops 15–20%.
If that happens again:
Electrical cost falls to roughly $45K–$46K.
When multiple bottom indicators converge in the same zone, that zone becomes extremely important.
TECHNICAL + INSTITUTIONAL DEMAND ZONE
From a pure market structure perspective, the biggest demand area this cycle has been $45K to $50K.
Why this zone matters:
- ETFs were approved here.
- August 2024 crash bottom formed here.
- Institutions accumulated heavily here.
- Whale buying was strongest here.
This is the price range large players are most likely to defend.
THIS CYCLE IS NOT PLAYING OUT NORMALLY
There are major structural differences vs. past 4-year cycles: Bitcoin made a new ATH before the halving (never happened before).
Post-halving Q4, usually bullish, was negative this time.
Bitcoin started dropping earlier than expected. Many altcoins topped before Bitcoin’s ATH.
This tells us one thing:
This cycle is front-running expectations. So the bottom timing may also come earlier than people expect.
SO WHEN COULD THE BOTTOM FORM?
Most people are waiting for a classic Q4 bottom. But based on the current structure, the bottom could form earlier. Estimated window → August to September
Markets tend to front-run consensus timelines. So both price and time could bottom sooner than the majority expects.
PSYCHOLOGY AT THE BOTTOM
If Bitcoin enters $45K–$48K, you’ll start hearing calls for $30K, $25K, and even $20K.
Just like in November 2022: When BTC hit $16K, people called for $10K... $8K... $5K.
None of those levels ever came. Markets trap both sides.
So here’s the full picture:
Liquidity hasn’t turned positive yet. Onchain bottom signals aren’t fully hit. Mining cost floor sits lower. Institutional demand sits lower. Cycle structure is front-running.
This means:
The $60K move was likely just a local bottom.
The real cycle bottom is more likely below the $50K zone, possibly forming late summer to early fall, when liquidity conditions finally improve.
That’s the window where the market will fully reset before the next major expansion phase.
🚨 ÚLTIMA HORA: La IA ahora puede analizar cualquier acción como un analista de Wall Street (gratis).
Aquí tienes 10 prompts brutales para Grok que reemplazan terminales Bloomberg de $2.000/mes (Guárdalos para después):
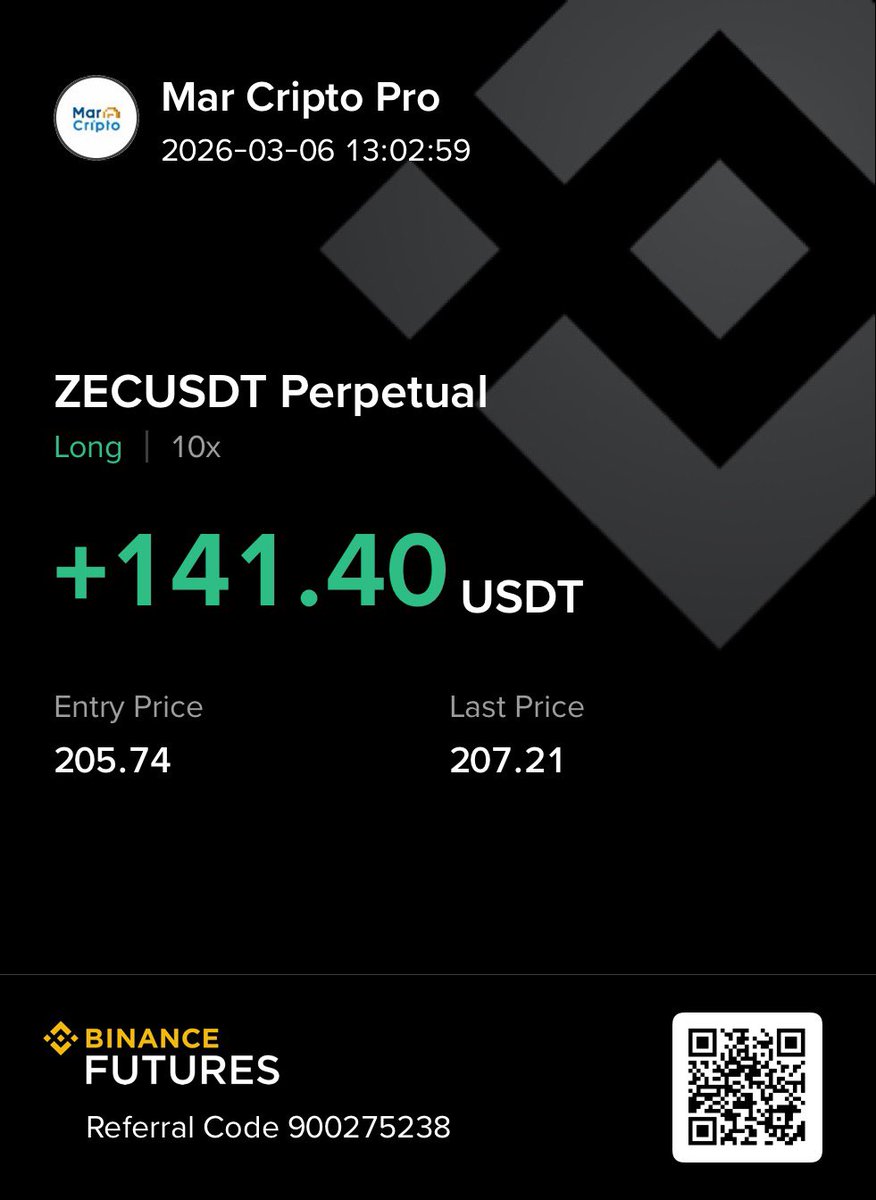
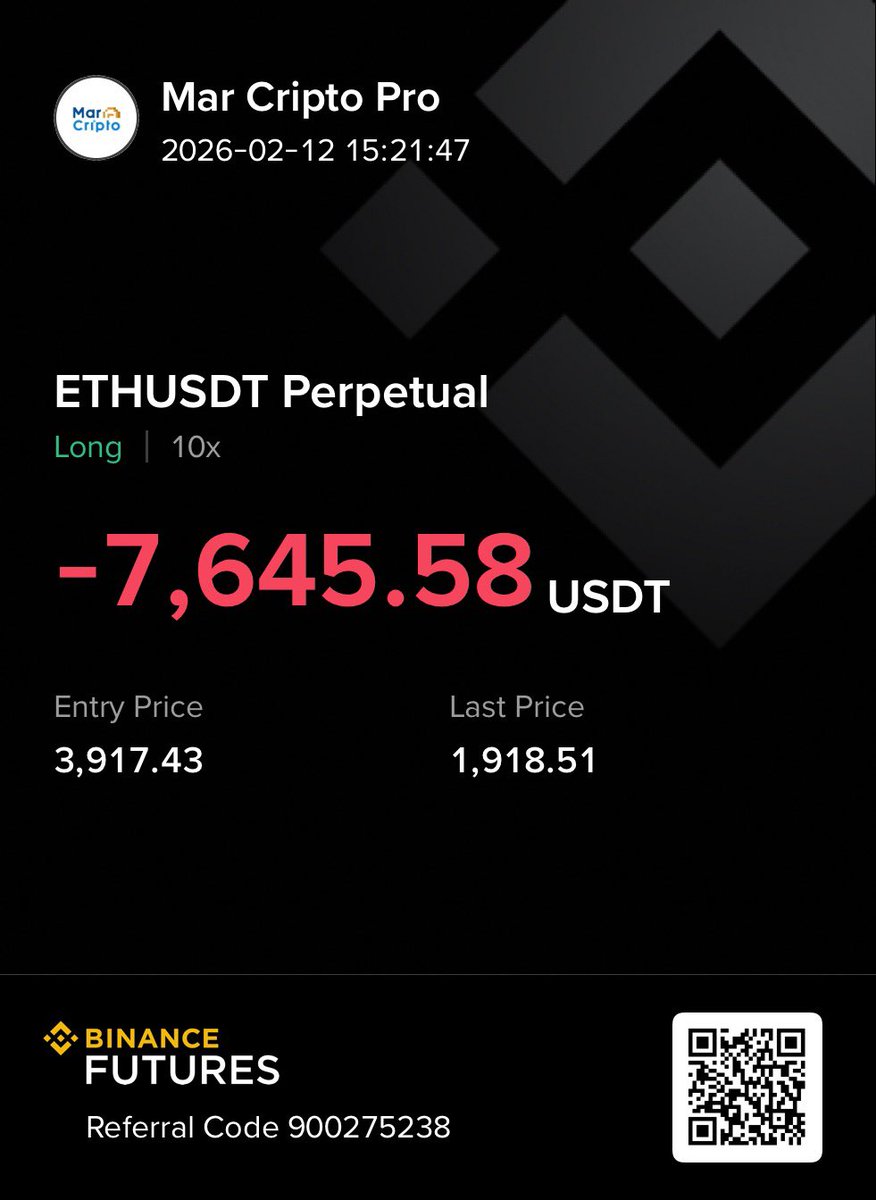
Portafolio de futuros gestionado como spot.
Exposición controlada. Capital optimizado.
Un portafolio de futuros bien estructurado
es un portafolio spot… con eficiencia de capital.🫢