The Certifiably Insane Way to Build an AI Agent:
1. choose a category where mistake tolerance is roughly the same as it is in self-driving cars. we chose "email-based scheduling assistant." many people want this product, but they immediately fire him if he screws up an interaction with a prospect, a candidate, or a potential investor
2. you learn that the edge cases are too complex and too frequent to be solvable. ours: managing timezones for people who travel (and change travel plans) constantly. knowing when NOT to respond, when to text the customer on the side to verify something, when to follow up, which sub-calendar to use, when to bend the rules on availability, when we can schedule that one type of call during your commute but not the other type of call. sharing your availabilities without compromising your privacy. and on and on.
3. the product doesn't feel viable, but you don't want to give up. you spend hours in a hot tub in Marin with a friend who makes self-driving cars. you make a plan to do it the way they did: hold the steering wheel. you go home and build a human-in-the-loop platform and hire contractors to serve as a backstop and catch mistakes before they happen (and to help design a map of what a world-class EA would do in every weird scenario). you decide trust is the currency in your category, so it must be the thing you won't compromise on. the product must succeed at any scheduling request, no matter how complicated.
4. you instantly feel an overwhelming market pull. so you keep going, growing that team to 75 people working 24/7 to support the nonstop scheduling needs of your customers. tons of engineering time goes to scaling the human platform instead of building the product.
5. you try to raise a Series A and investors say you are insane. your gross margins are extremely negative. they believe this is a problem worth solving, but they don't believe it is as hard to solve as you say. they want AI, not humans. your competitors put "NO HUMANS IN THE LOOP" on their landing pages to call you out. you keep going.
6. you work day and night building the harness that can meet the quality standard your customers have come to expect. you create a massive synthetic gold dataset. audit it, and clean it, label it. repeat. then, experiments. fine-tuning. RL. ACE. DSPy. sub-agents. sub agents for your sub-agents. rebuild the harness. throw more tokens at the problem.
7. some weeks you make big progress. some weeks your evals climb a single basis point, but that's better than nothing. more experiments. more tokens.
john coogan said the hot trend in 2026 will be dogged pursuits. that pushes you to continue the pursuit, doggedly.
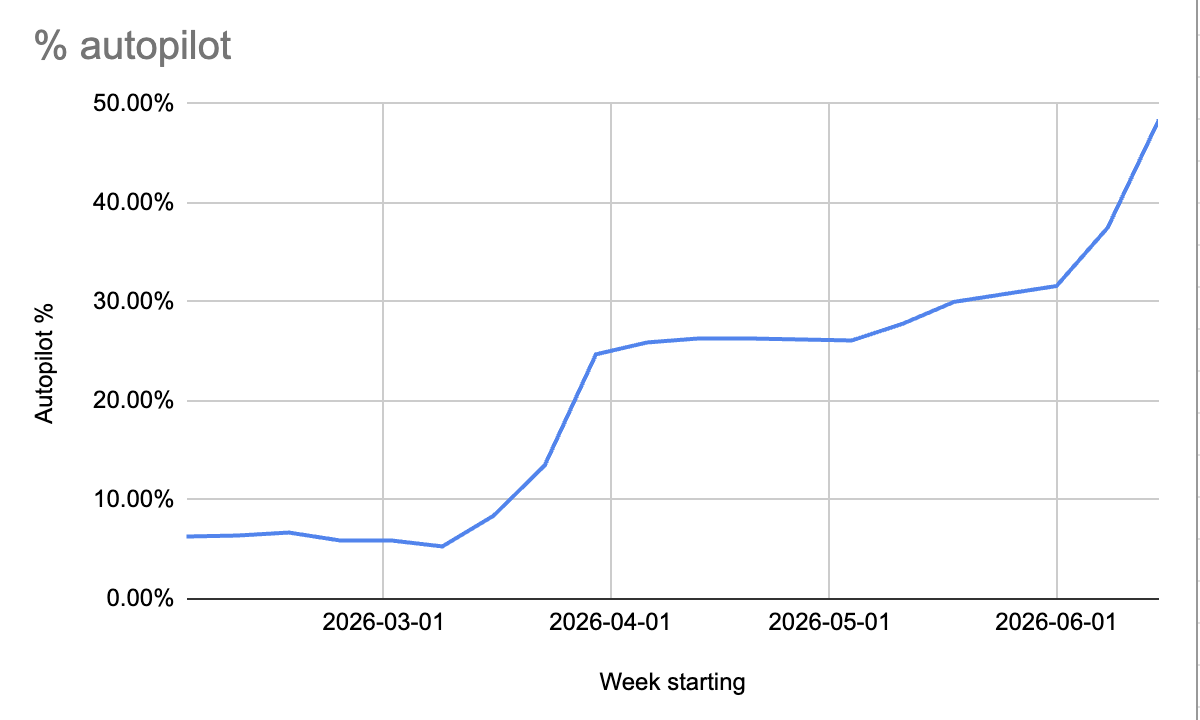
8. then, one day, you realize you are scheduling thousands of meetings a day and approaching 50% autopilot with no increase in churn or complaints. you put 150 customers in a full self-driving experiment, and they use the product MORE than they were using it when they had the human backstop. you can really start to let go of the steering wheel.
9. you don't know yet if this was a hill worth climbing, but you are nonetheless stoked that you can see the top. you have created a proprietary map of what to do in a million different situations. nobody else has that map, and the models keep getting better at following maps. your plan was to bet on trust, and your product can be trusted.
today was the first day Howie crossed 50% autopilot:
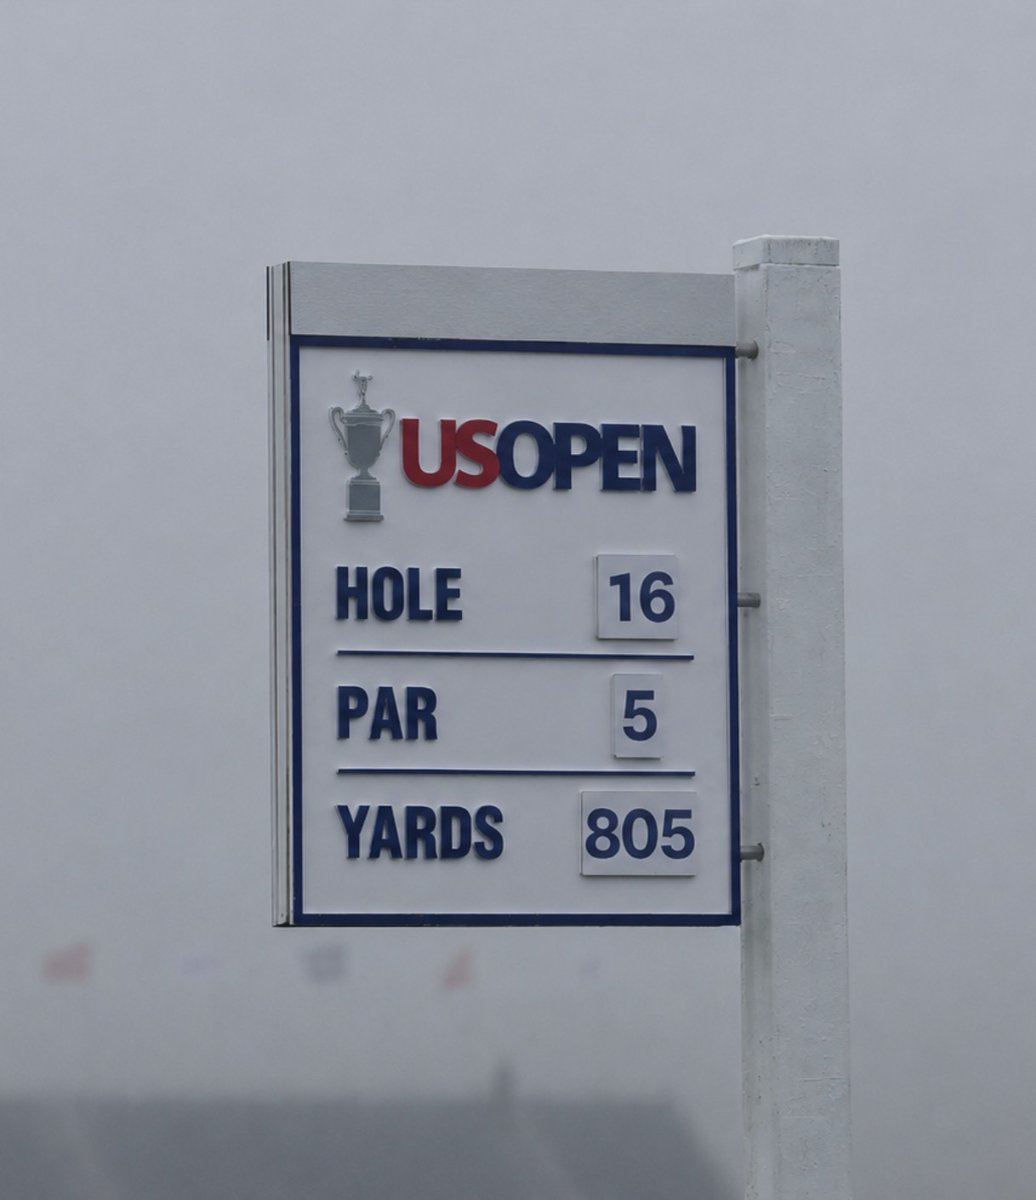
A 800-yard par five?!
Let me explain...
On Thursday, the 614-yard par five 16th hole played directly into the wind.
Bryson hit a 193mph drive (8.5 degree launch), a 148mph three wood (4.5 degree launch) and a 118mph 8-iron (19.5 degree launch). He still wasn't on the green but pin high. Using that data from Trackman, I calculated how far those shots would go in "normal" conditions.
The answer, 805 yards.
Built a ClaudePA to check my client workspaces for tasks across email and Whatsapp.
Good news, the business is growing. Bad news, looks like I am in for a long day.
Okay, here goes.
Random thoughts & takeaways from the 2026 Masters.
I hope you enjoy it and, as always, thanks for reading.
What a joy it is to be able to share these weeks and witterings with you all.
🌺⛳️
https://t.co/vkCdby4Z4Y
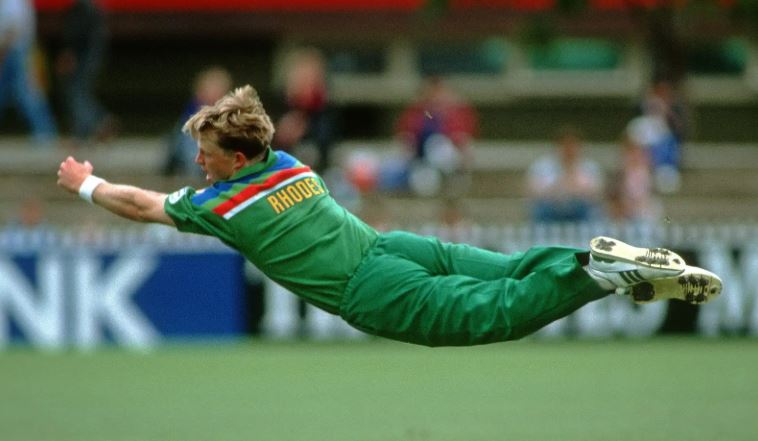
We cricket fans will keep fighting to the death over who the best fielder in cricket is.
AB de Villiers? Jadeja? Jonty Rhodes?
Hold that argument.
Because in 2018, three statisticians from Simon Fraser University — Perera, Davis, and Swartz — decided to end the debate with data.
They built a metric called "Expected Runs Saved due to Fielding" (E(RSF)).
And what they found?
It will upset you.
The best fielders in T20 cricket save... just 1.2 runs per match more than an ordinary fielder.
That's it.
While the best batters and bowlers contribute roughly 10 runs per match to their teams, the best fielder on the planet barely scrapes past a single run.
But here's where it gets properly wild.
The researchers didn't use GPS trackers. Didn't use hawk-eye data. Didn't even use video.
They used commentary text.
They parsed 160,247 balls of match commentary — from International T20s (about 750 T20 matches) and the IPL — and built a random machine learning model trained on 55 contextual keywords (words like "dive", "edge", "drop", "flat", "sharp") to predict what the batting outcome SHOULD have been on any given ball.
Then they compared that prediction against what ACTUALLY happened when a specific fielder's name was mentioned.
That gap — between what should have happened and what did happen — became the measure of fielding impact.
Essentially a Moneyball approach. For cricket. For FIELDING.
Now. The results.
The best non-wicketkeeper fielder? Nathan Coulter-Nile (E(RSF) = +0.35).
AB de Villiers, widely considered the greatest fielder alive? Ranked 21st. E(RSF) = -0.34. Negative. As in, on average, he cost his team runs while fielding.
And the most shocking finding?
MS Dhoni — the man with the fastest hands behind the stumps — was ranked the WORST wicketkeeper-fielder in the entire dataset. E(RSF) = -3.61.
Dead last among 13 keepers. Behind Mark Boucher. Behind Brad Haddin. Behind everyone.
How is this possible?
The paper reveals a beautiful paradox:
the best fielders are the ones whose names are NEVER mentioned.
Think about it.
When commentary says "brilliant diving catch by Kohli!", that's a notable event. But when a fielder simply... stops the ball cleanly, returns it accurately, and nothing remarkable happens — his name is never spoken.
Another instance: a batsman drives a ball, but notices Jadeja standing at short cover or point and DOES NOT DARE to run a single. This does not get recorded as a fielding achievement.
The study showed a clear decreasing trend:
the less often a player's name appeared relative to fielding opportunities, the BETTER he was.
In other words — excellence in fielding is invisible.
We celebrate dramatic recoveries.
Emergency interventions. The "brilliant diving catch" of a last-minute, a last ball run-out.
But the real measure of good work — like good fielding — is also in what DOESN'T happen.
The absence of disaster is the hardest outcome to measure. And the easiest to ignore.
Perera, Davis, and Swartz tried to measure cricket's invisible skill. Their approach was not perfect, but, they opened a door that was considered closed, sealed and deemed never to be opened.
This #IPL season, I will post one interesting cricket related research for fans to be amused, and get a different viewpoint on their beloved game.
Enjoy!
@ABsay_ek@AMP86793444
https://t.co/pgLAs5pDak
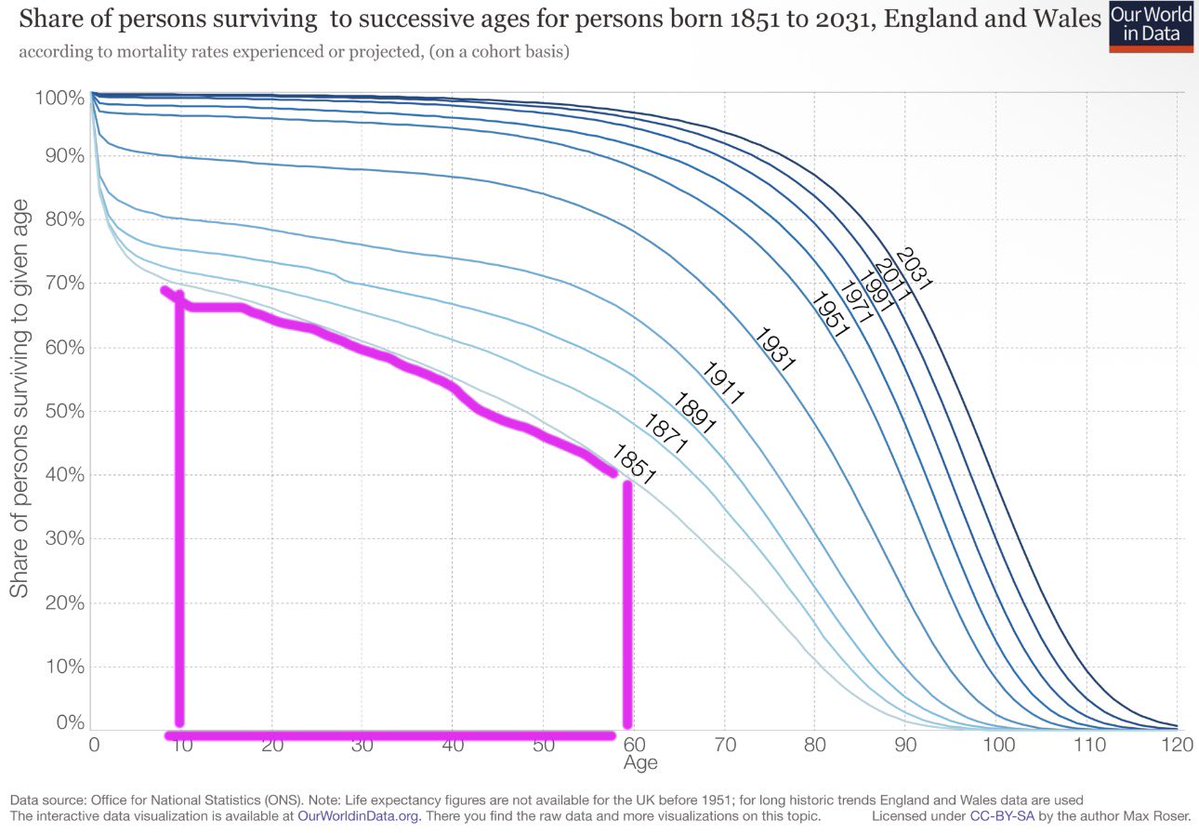
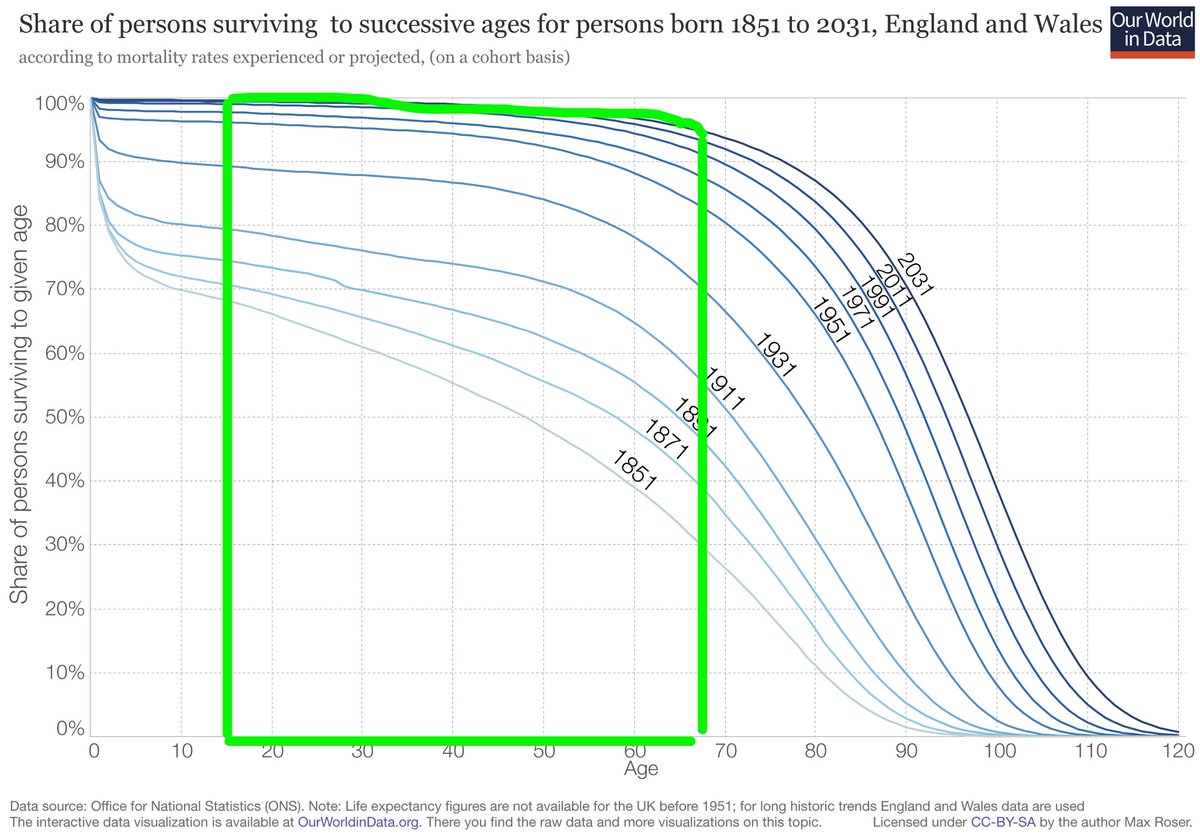
Birth Rate Collapse & Economic Utility of a Birth
This is really weird, but I suspect it’s overlooked in socio-economic research literature.
Below I present 2 zones on the same chart.
The pink zone on the left chart shows the useful economic life of 1 human birth in the year 1851.
The green zone on the right chart shows the useful economic life of 1 human birth in 2011.
Now because of medical advances, sanitation, public health, etc, etc we have significantly improved life expectancy and reduced infant mortality. This means that a birth in 2011 has vastly more hours of economic output than a birth in 1851. Historic mortality rates really cut down the expected economic lifespan of a birth, but how much?
The pink area on left = 40 years * 40% + ( 40 years * 30% )/2
= 22 years of economic work per birth (yikes!)
The green area on the right = 51 years * 98%
= 50 years of economic work per birth.
These numbers are massively different.
The expected working lifespan of a human at birth has increased by 127% over 160 years. Even though we work to approximately the same age.
This means that in economic terms 1 birth in 2011 is worth 2.27 births in 1851. How does that gain in economic utility per birth compare to the collapse in volume of births?
Today there are 2.31 births per woman worldwide.
In 1850 there were 5.82 births per woman.
5.82/2.31=2.52
So we have 2.27x gain in utility per birth and a 2.52x fall in the volume of births? These ratios are within 10% of one another, they almost perfectly track inversely to give a fixed amount of ‘human economic utility birthed per woman’.
I find this to be a staggering coincidence.
Is the collapsing birth rate just supply and demand? Did longevity gains simply create a temporary oversupply of units of human utility?
The population crisis might just be market forces. Or rather, it’s just macro-ecology.
I still use the OpenAI whisper API for TTS instead of reading long documents. But that is it.
And I am finding myself spending more time with Gemini 3.0 than with GroK.
And I see my Perplexity use has also tanked.
Claude still my #1 spend, followed by Grok-4-fast and then Gemini Pro
@sethsetse@elonmusk@nikitabier This will become increasingly important.
I even did a silly POC to that effect.
✓ Verified human-written
https://t.co/Yp0Xqq2fQo
@goddek Hated she may be. Undeniably a generational talent. I consider myself a music purist. A music asshole if you were to ask my wife. But seeing your 5 year old daughter sing the lyrics to Fate of Ophelia ought to change your perspective, reliably.