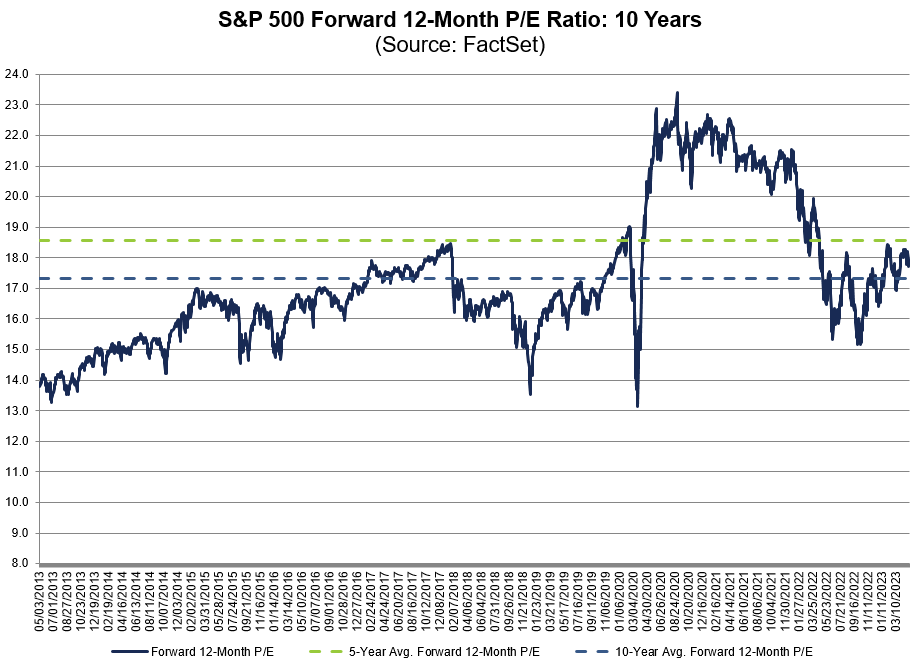
@charliebilello data is not accurate. Forward P/E is 18.4x, and current P/E is 19.7x (Source: Factset). Also, it makes sense to look at it historically, not as a stand alone data point.
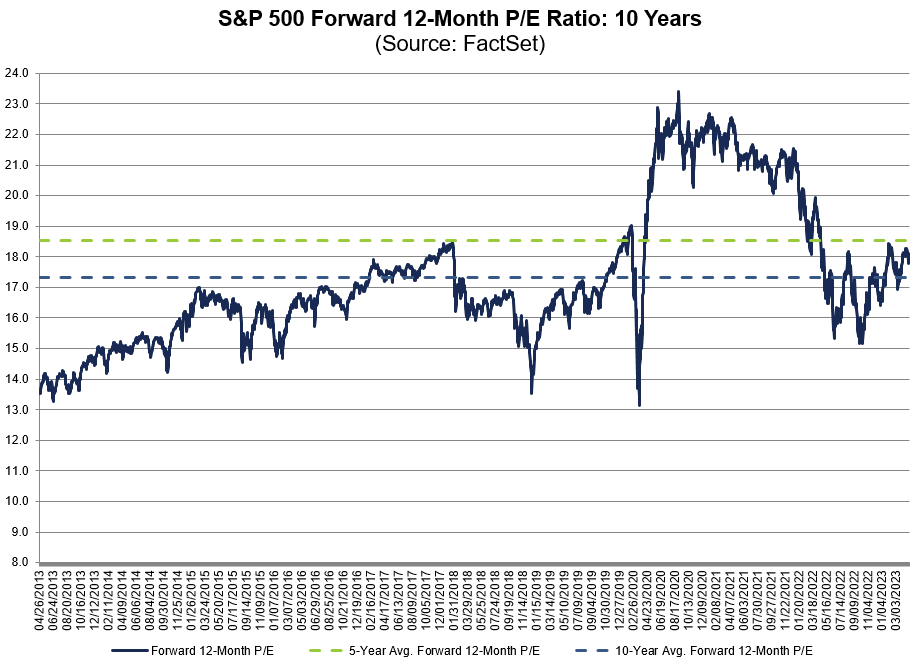
The forward 12-month P/E ratio for $SPX of 17.7 is below the 5-year average (18.6) but above the 10-year average (17.3). #earnings, #earningsinsight, https://t.co/Am1b5Ggjf1
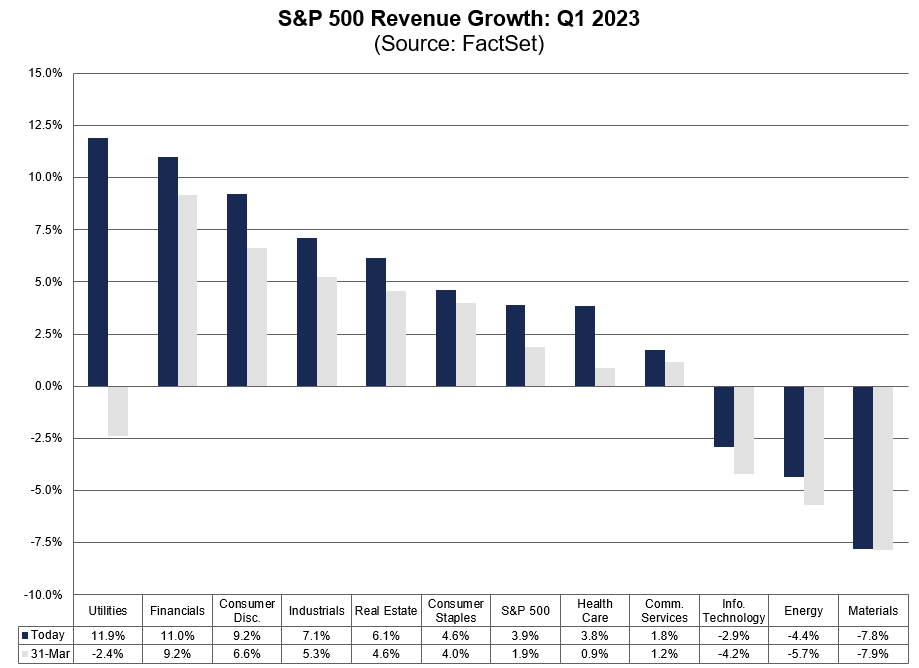
$SPX is reporting Y/Y revenue growth of 3.9% for Q1 2023, which is the lowest revenue growth since Q4 2020 (3.2%). #earnings, #earningsinsight, https://t.co/Am1b5Ggjf1
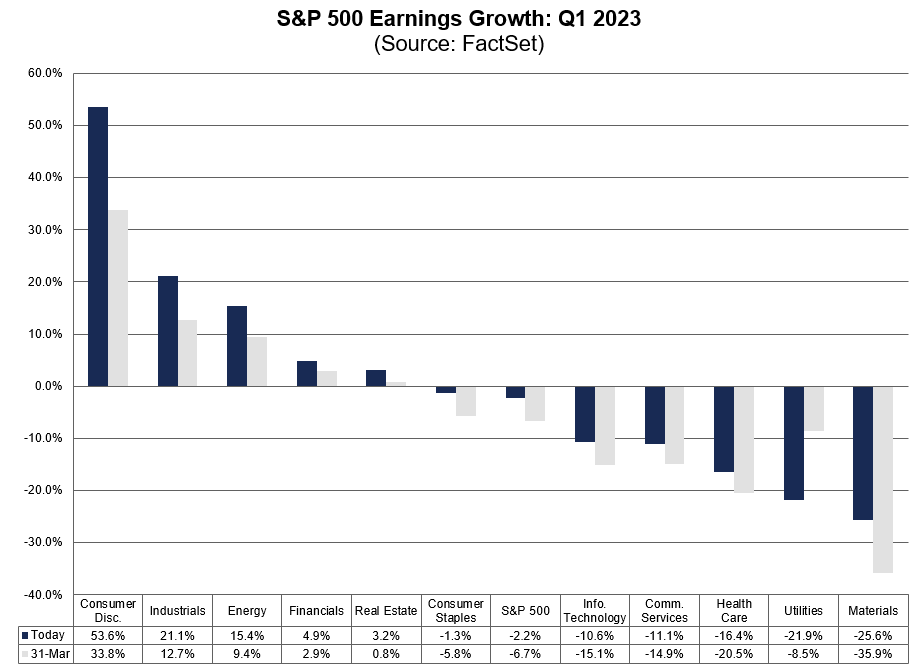
$SPX is reporting a Y/Y earnings decline of -2.2% for Q1 2023, which is the 2nd straight quarter that the index is reporting a (Y/Y) decrease in earnings. #earnings, #earningsinsight, https://t.co/Am1b5Ggjf1
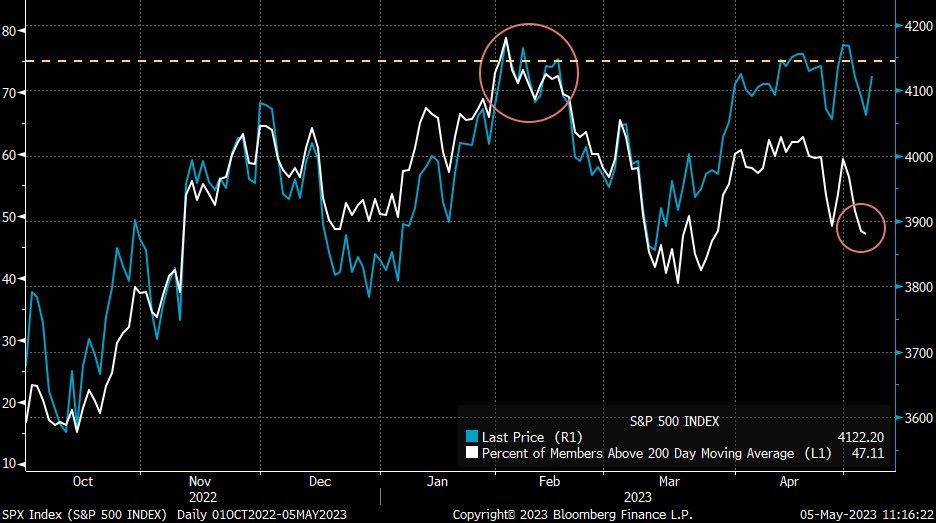
The S&P 500 is over 4100, yet only 47% of S&P 500 members are trading above their 200-day MA. Compare that to last month's 60% and the 73% we saw in February and breadth has deteriorated. Want to see this improve if a rally is going to be durable.
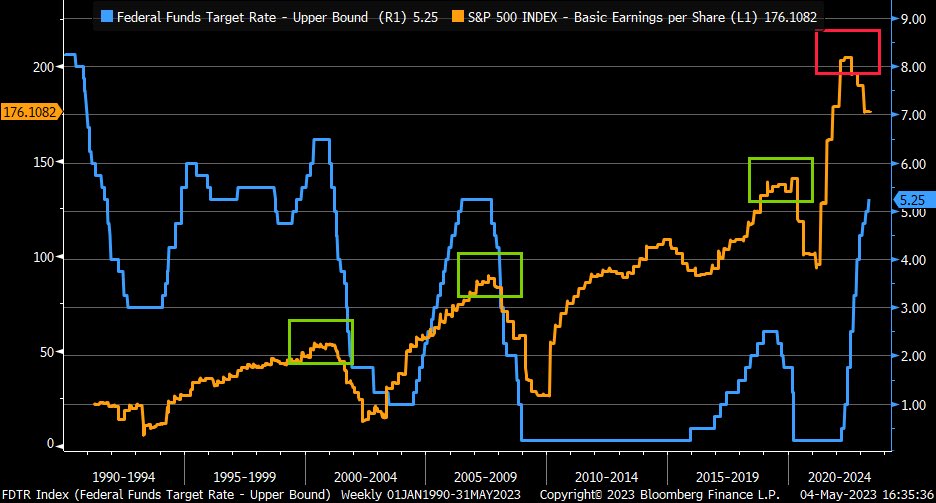
Interesting that in prior three Fed rate hike cycles, S&P 500 EPS (orange) peaked at/right after peak in fed funds rate (blue) … this time, EPS peak looks to be in well before peak in fed funds rate … in 1994 tightening and easing cycle, EPS didn’t fall
@Schuldensuehner not really, it was bad risk management and duration management. interest rates have been rising for 18 months.. if you act surprised, you don't belong to the market.
The forward 12-month P/E ratio for $SPX of 18.1 is below the 5-year average (18.5) but above the 10-year average (17.3). #earnings, #earningsinsight, https://t.co/ZwXlw8L0yY
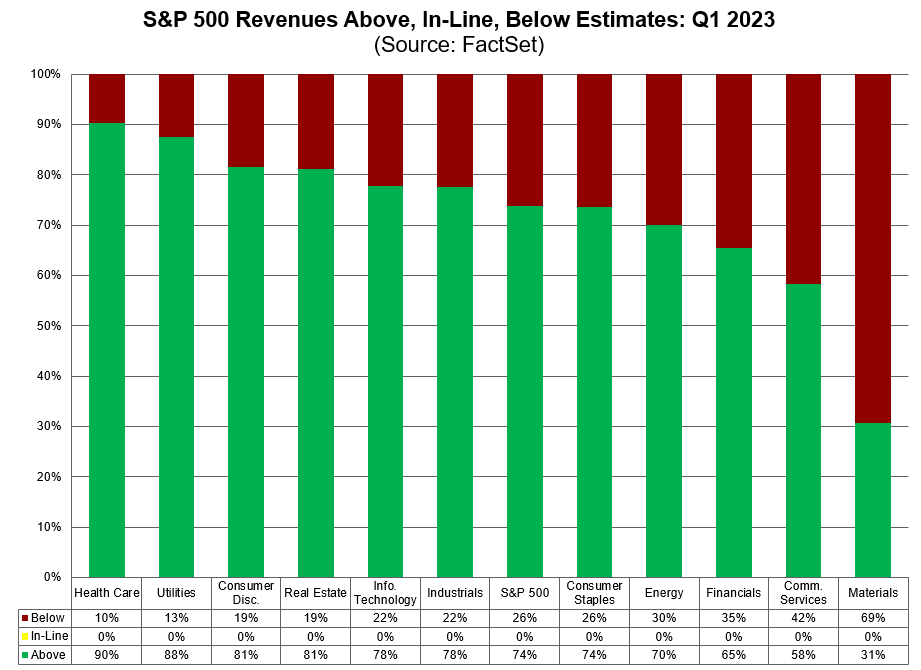
74% of $SPX companies have beaten revenue estimates to date for Q1, which is above the 5-year average of 69% and above the 10-year average of 63%. #earnings, #earningsinsight, https://t.co/ZwXlw8L0yY