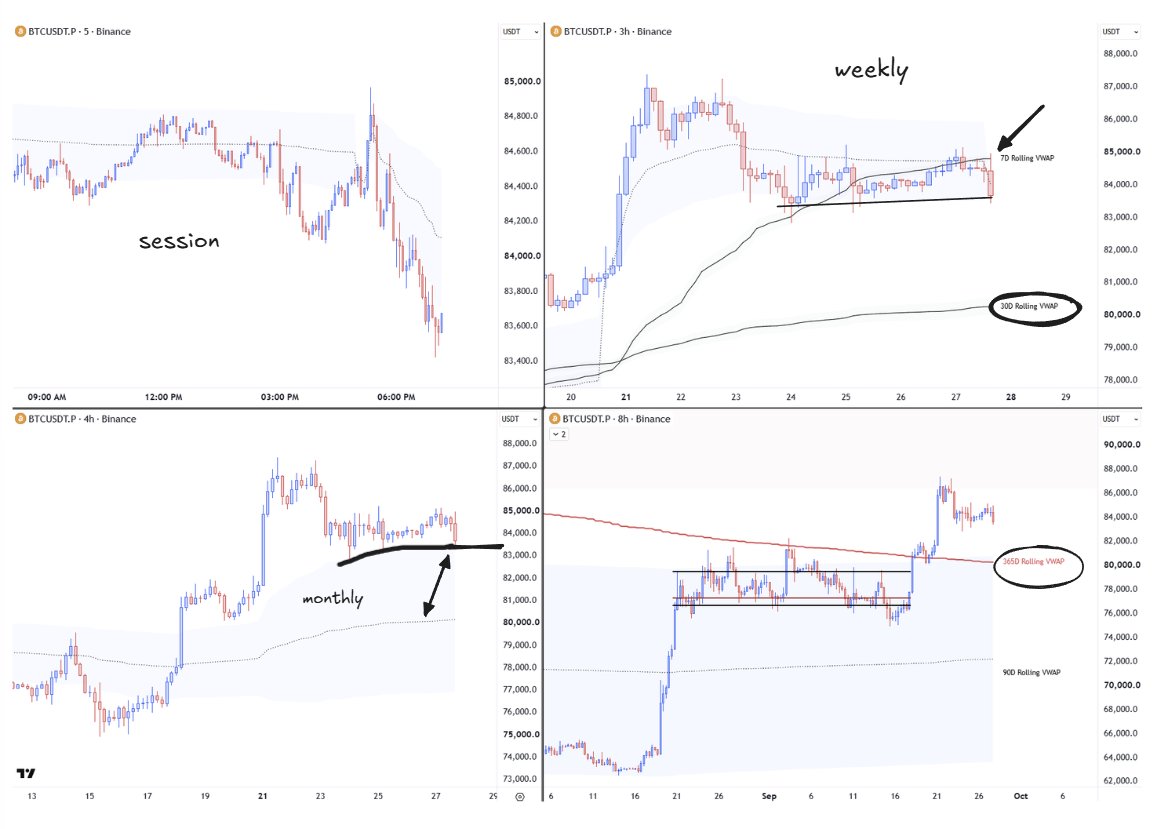
How do you watch perps vs. spot behavior?
What platforms do you use?
Why is it beneficial to watch this?
What does it mean?
Get asked this under every tweet so please just bookmark this long tweet.
This is probably the best detailed explanation of this you will find on here with nuances.
Here's the overarching answer.
If we break it down, what I like to keep an eye on is the following:
> aggressive perps
> aggressive spot
> passive spot
there are many platforms to gauge this behavior. Just remember that there's a lot of fragmentation and also inaccurate ways of reading this because it can tend to get noisy.
Your read will be based on assumptions as well as a lot of screen time (when x + y happens it leads to z happening, which points to ...)
Outlier behavior
So when we parse these participants out remember there is hedging behavior, there is behavior that you will see where someone might suppress the spot side to get their own perps positioning filled etc. Glazing over this to point out that this isn't just as straight forward as meets the eyes at first. But over time your assumed read will improve.
Why Spots vs. Perps
I want you to think of perps positioning as the "weaker" hand because you can lever up tremendously and have your liquidation 0.1% away from your entry (think exaggerated case) which means this positioning is liable to enter, exit and get vaporized fast when price isn't carrying in the desired direciton. Now you throw in an understanding of crowded positioning in the same area and it gives you the exact spot where if positioning is pressed it will unwind with haste.
Think of spot behavior as the whale which has the little fish that stick to its underside for the ride (the perps positioning). In other words, the real strength or weakness of a move is ultimately determined by spot follow-through (or lack there of)
understood? let's move on to what you're actually reading this for and probably skipped the rest to read.
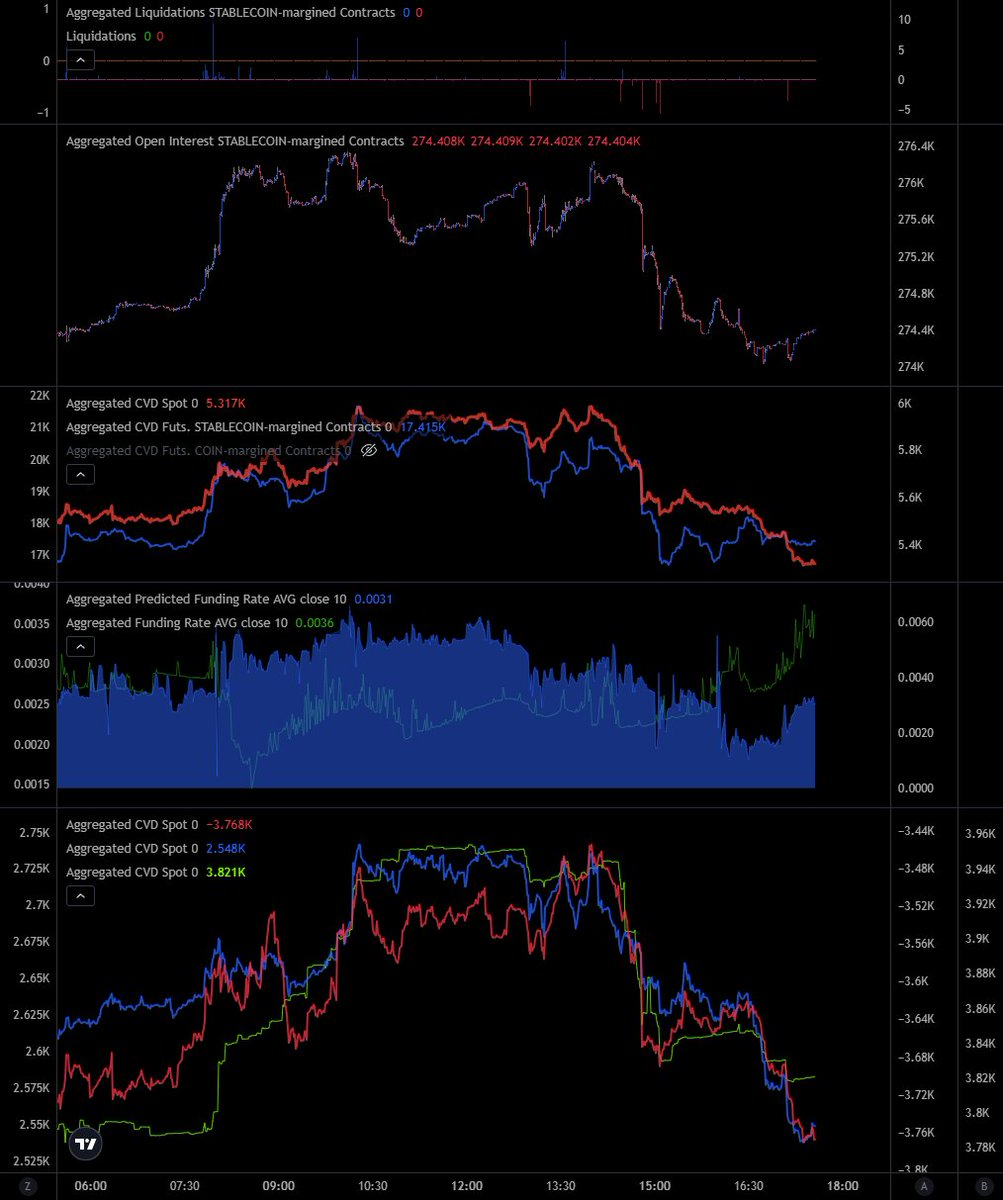
There are many platforms to do this but here is one way I quickly scan this behavior:
1. Coinalyze
You can go on coinalyze for aggressive spot and perps behavior - both aggregated as well as parsing out exchanges (binance, cb etc.)
i.e. you can watch what both aggressive perps and aggressive spot are doing through the move as well as watching what is happening on individual exchanges.
Do this on LTF (I typically do not go above 5-15 mins here).
2. MMT
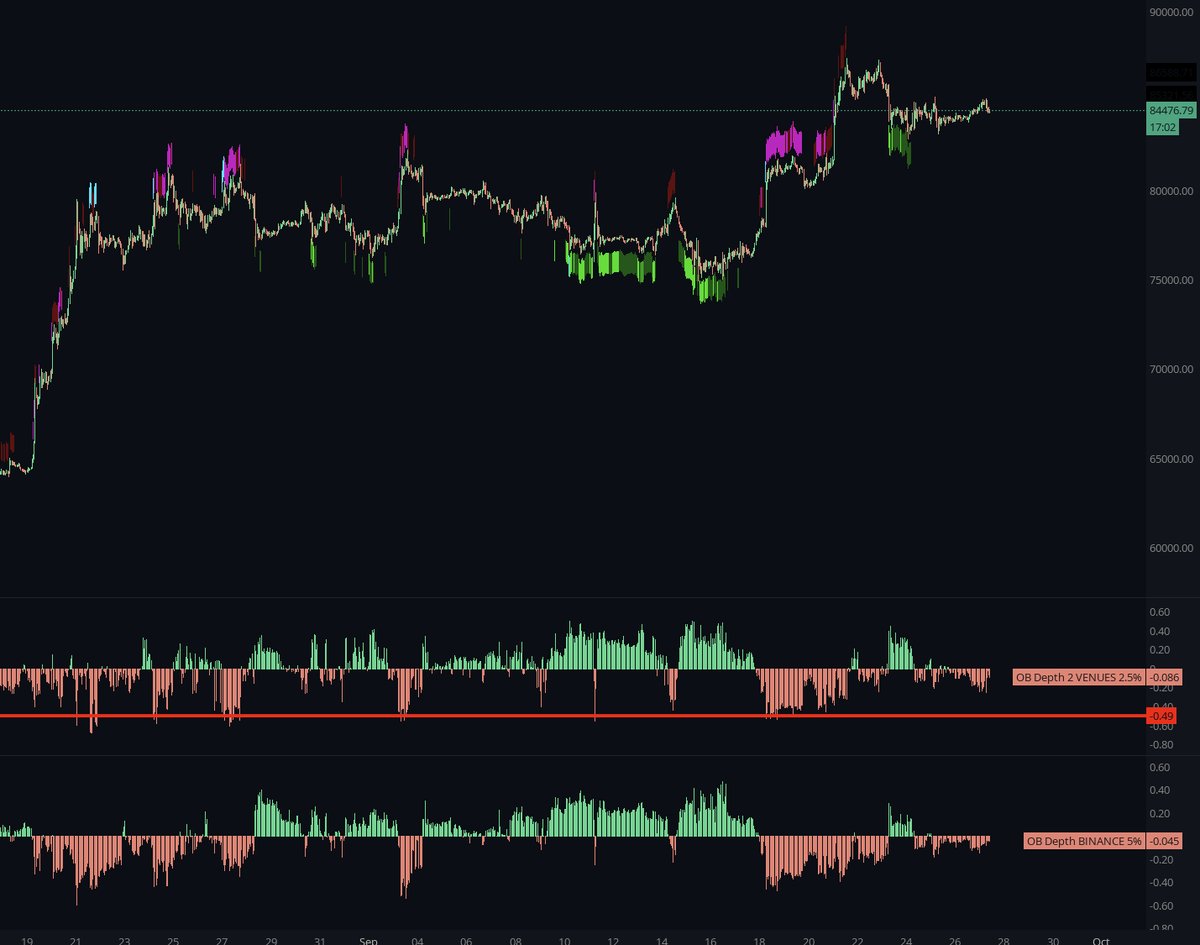
For passive spot, you can go to MMT and watch the spot orderbook skew which shows you how fat the supply/demand is on 2.5% and 5% depth.
The indicators are OB depth and OB pressure bands as shown in image. You can go to settings and change the exchanges as well as looking at spot vs. perps.
Think of this as a "wall" or a "cushion" when approaching from below or above.
Also, at the risk of oversimplifying I want you to visualize the aggressive positioning as "canonballs" when price is approaching a skewed book i.e. aggression can eat away at this skew if it is adequate enough or fall short.
two scenarios combined with context -
BTC is ranging and is trading towards range high for the 3rd time. Short squeeze takes out the range high into a stacked passive spot book skewed towards the ask side and aggressive perps start buying while aggressive spot starts selling. More likely than not this will revert.
BTC is pulling back into an OB that is skewed towards the buy side on passive spot. However aggressive perps continue to long a 1 min grind down and aggressive spot continues to sell unwinding that positioning into new lows. Good chance this passive wall will get eaten through unless this behavior stabilizes.
Keep an eye on the extent of the passive ob skew as well.
When you combine this with areas of confluence the pieces of the puzzle will start to come together.
ok enough yap.
hope this helps.
Don’t spend 3 hours watching videos. Start with this 10-minute clip.
ICT explains why highs & lows are predetermined by institutions, plus:
• Sweeping vs. purging
• IPDA
• Interbank Dealing Range
• Institutional levels
• What to understand before entering
One clip. A lot to learn.
I recorded a 6-min video explaining why your "Breakout" trades keep failing.
0:35 - Trade Location
1:30 - Volume
2:00 - Candle Body's vs Wicks
3:30 - Stop Loss Placement
4:40 - Breakout Retest
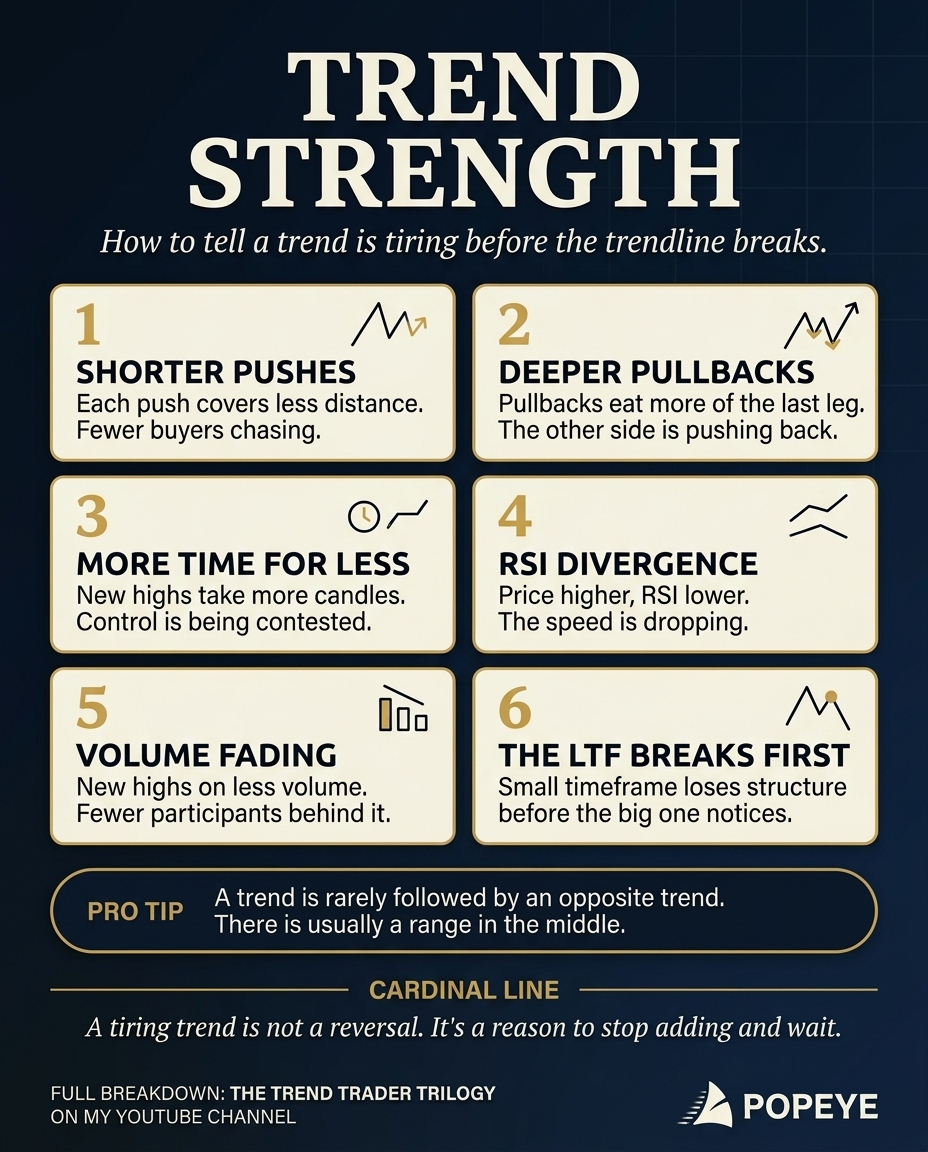
TREND STRENGTH: HOW TO TELL A TREND IS TIRING BEFORE THE TRENDLINE BREAKS - CHEAT SHEET
You voted, I delivered! Took me longer than promised, but here it is.
The trendline break is the last thing to happen, not the first. By the time it breaks, the move is usually already over. These are the 6 things I watch before that.
1. SHORTER PUSHES
Each new impulse covers less distance than the one before.
WHY: every push needs fresh buyers. When each leg gets shorter, fewer new players are willing to chase at higher prices. Same effort, less result.
2. DEEPER PULLBACKS
Pullbacks start eating more and more of the last leg.
WHY: in a healthy trend, sellers get absorbed fast and pullbacks stay shallow. Deeper pullbacks mean the other side is finally strong enough to push back.
3. MORE TIME FOR LESS
New highs take more and more candles to print.
WHY: strong trends move fast because one side is in control. When price starts grinding, that control is being contested.
4. RSI DIVERGENCE
Price makes a higher high, RSI makes a lower high.
WHY: RSI measures the speed of the move. Price can keep going up while the speed drops, like a car still rolling forward after you lift your foot off the gas.
Full breakdown: https://t.co/TW0RriFXKy
5. VOLUME FADING
New highs print on lower and lower volume.
WHY: volume is the effort behind the move. Higher price with less effort means fewer participants are backing it.
Full breakdown: https://t.co/NMYMDXA1nC
6. THE LTF BREAKS FIRST
The lower timeframe loses its structure (the first lower high in an uptrend) before the HTF trendline even notices.
WHY: every HTF trend is built from LTF swings. The change always shows up on the small timeframe first, the big one only confirms it later.
What it means: a tiring trend is not a reversal signal. It's a reason to stop adding, manage what you have, and wait.
PRO TIP: a trend is rarely followed directly by another trend in the opposite direction. Most of the time there is a range in the middle. So when a trend gets tired, don't rush to flip your bias. Prepare for the range first.
Want the full picture? I made a whole trilogy on trends on YouTube, The Trend Trader:
Part 1: How Trends Really Work
Part 2: My Exact Process for Trading Trend Pullbacks
Part 3: 5 Advanced Trend Signals
https://t.co/9mnsCYSqxB
Pop
THE BIGGEST MONEY MISTAKE IN 2026 IS PLAYING BY RULES BUILT FOR A DIFFERENT ECONOMY.
People are still:
• Only earning money that requires their TIME.
• Parking money for 30 years and hoping retirement works out.
• Chasing the next crypto, stock, or hype cycle.
• Assuming their primary residence is automatically their best investment.
• Building wealth without a system to protect it.
Meanwhile, the environment has changed.
There are FIVE major threats every family should understand:
INFLATION: purchasing power gets quietly destroyed.
CURRENCY DEVALUATION: more dollars chasing scarce assets changes what your money can buy.
CREDIT RISK: higher borrowing costs and tighter credit can expose overleveraged households and businesses.
ASSET VALUATIONS: expensive markets create concentration and downside risk.
GEOPOLITICAL RISK: wars, trade disruptions, energy shocks and critical chokepoints like the Strait of Hormuz can ripple through markets quickly.
You cannot control these threats.
You CAN control your structure.
That is why I built CAPL + DR™.
C : CASH FLOW
Build multiple sources of income so your entire life isn’t dependent on selling your time.
A: APPRECIATION
Own assets you believe can appreciate over time. Build positions with discipline—not hype.
P: PROTECTION
Protect liquidity, income, assets, family and estate. Wealth without protection is fragile.
L: LEVERAGE
Use leverage strategically for productive assets not to finance a lifestyle you cannot afford.
Then comes the part most people forget:
DR: DE-RISK.
Take chips off the table.
Move profits from higher-risk assets into cash flow, liquidity and protection.
Because getting wealthy and STAYING wealthy are two completely different skill sets.
The goal isn’t to predict every market move.
The goal is to build an ecosystem strong enough that you don’t NEED to.
Cash Flow. Appreciation. Protection. Leverage. De-Risk.
CAPL + DR™.
Stop waiting for the old rules to start working again.
Build for the economy you’re actually living in.
Much love.
WARRIORS RISE
Auction Market Theory -
Balance, Imbalance, Acceptance and Rejection
What is "acceptance"?
What is "constructive price development"?
for myself a lot of it has become intuition because of staring at screens for a few years + using certain thresholds as a gauge,
but hopefully this can clarify a bit:
(long tweet -> bookmark away)
> Price traded above a key level, why is that not "acceptance"? Is a "candle close" acceptance?
In AMT, the premise is that "price" is just an advertisement in other words it evokes emotion (hence the failed breakouts and breakdowns).
Using this premise, price "breaking above" and "breaking below" doesn't provide the full picture.
So two questions you can use to define acceptance:
Did price spend time there and did it do volume there?
1. Time + volume = acceptance = new value.
Neither = rejection = excess.
okay that's kind of useless how much time and how much volume?
this is something that you will have to figure out by spending a lot of time in developing some baselines (typical vs. atypical) and intuition.
to take it a step further, "volume" alone doesn't provide the full picture.
Next, we need to determine the "quality" of volume and the kind of positioning that is getting involved.
In other words, we need to get a bit more granular to understand the dynamics between perps and spot positioning to make a more informed assumption when it comes to acceptance vs. rejection (what we called a failed auction).
Since there is a lot of fragmentation and several parameters involved when it comes to crypto, we make educated assumptions based on parameters such as open interest, spot vs. perps CVD, passive orderbook skews (remember that is passive and aggressive behavior on both spot and perps).
an example scenario to demonstrate this:
price breaks above the local highs based on a short squeeze and also triggered breakout longs which extended the move to the upside, however spot is aggressively selling this "breakout" = swing fail.
this can be a lot more detailed with more guidance but you get the idea.
"acceptance" in the sense of AMT isn't just about price go up or down it's about digging deeper to understand market dynamics and positioning.
coming to constructive price development:
you have a few things in the jar-
> perps passive and aggressive flow
> spot passive and aggressive flow
we want to assess how much work is the market doing and what kind of reward is being provided in exchange?
to simplify, perps positioning is typically fickle bcs leverage apes and spot positioning has more weight behind it and is more difficult to bluff.
i.e. when price pushes against crowded perps positioning that bluff gets called out...fast.
so when assessing the real strength of a move, I like to see aggressive spot buying continuously into a move and even better if its pushing through crowded perps positioning that continues to fade the move.
if there is retracement, it is shallow and gets supported with passive spot stepping up higher in the books to provide a cushion for a soft landing (can watch spot orderbook skew on 2.5%).
the other aspect to assess work being done is the velocity with which open interest is getting added and the subsequent change in price, an area where a ton of longs or shorts pile on is one that points to a structural weakness if price where to revisit again.
additionally, if open interest is going vertical while price slows down it can point to "juice isn't worth the squeeze" situation.
understanding positioning is a lot more valuable imo than just looking at price since price is only a mechanism that evokes emotion.
however, there is a lot of noise when going down this path and I notice a lot of misinterpretation of this especially when zooming in on ltf, so you need to learn how to parse out what information is valuable and what is noise.
hope the yap helps clears things up a bit.
SpaceXAI engineer, Lauren Tan:
"99% of people using GrokBot just for 1% of its real power. They run 1 agent without "loop" & "graph"
I'm running a team of 20+ GrokBot agents, fully autonomous. I have a Chief of Staff agent, a PM agent and 20+ workers - that's the new stack of engineer"
In a 1-hour session, a SpaceXAI engineer showed how to build a team of effective AI agents from scratch
this is worth more than a $500 agentic engineering course
watch this workshop today, then read how to build a fleet of GrokBot agents in the article below