WILL VODAFONE BE THE BIGGEST TURNAROUND STORY OF CORPORATE INDIA 🇮🇳 IN NEXT 5-10 YEARS ?
Ans: YES. Very highly likely.
🔷 Vodafone Idea, India's third-largest telecom operator, announced a ₹45,000 crore capital expenditure plan over three years to expand 4G coverage in 17 circles and launch 5G services, targeting improved subscriber retention and higher average revenue per user.
🔷 The funding strategy relies on ₹25,000 crore in bank loans and ₹10,000 crore in non-funded facilities, avoiding fresh equity issuance and depending on government AGR dues relief and promoter support to manage its ₹2.1 lakh crore debt.
🔷 Analysts view the plan as a critical step for Vi's turnaround, potentially tripling EBITDA to ₹40,000 crore by FY29, though execution risks persist due to competitive pressures from Reliance Jio and Bharti Airtel.
✨⭐️ IDEAL SCENARIO for #vodafoneidea
Paying off debt slowly but steadily, gaining subscribers by investing in capex due to improved Cashflow as AGR dues payment has been delayed, ARPU rises & moving towards profitability.
Once market sees signs of these things happening, the stock will start rallying in advance 🚀
🟢 https://t.co/LfapZJNjFy || https://t.co/1yp5MDXSnX
Yesterday, one of our advisory clients asked me a very interesting question:
Sir, why do you keep looking at stocks near 52-week highs or all-time highs? Why not buy stocks near their lows? If a stock is 10, buy it at 10 and sell at 20. Why buy at 20 and sell at 40?
It sounds logical.
But the stock market doesn't work simply on cheap vs expensive.
A stock trading near its 52-week low may be cheap for a reason weak business, poor growth, falling demand, or deteriorating fundamentals.
And a stock trading near its all-time high may be expensive compared to the past, but it may also be there because demand, growth and expectations are strong.
It's basic demand and supply.
I’m not saying you can’t make money buying near the lows. You absolutely can.
But that's not my style.
I prefer to focus on where strength and demand are already visible and then follow my setup and risk-management rules.
Sometimes the biggest mistake is thinking:
It has already gone up, so it can't go further.
And the biggest opportunity can be understanding:
If demand is strong, why should price stop just because it looks expensive?
Cheap can become cheaper.
Expensive can become more expensive.
The question is not where the stock has come from.
The question is where the demand is going.
#MasterInOne
⚡️When to Sell by the legend, S Naren.
Big fan of his contrarian thinking and his courage to share bold views in public.
One idea of his that really stayed with me is this:
Do not think in terms of “selling”.
Think in terms of “switching.”
@AdeptMarket Expecting green as of now as reliance come out with good set of results. Expecting same with hdfc and other nifty stocks publishing results this week.
Christmas gift 🎁🎁🎅
Screeners
technical screeners - intraday and positional both
Bookmark this message
Thank you 👍
positional screeners
1- Stocks closing daily 2% up from 5 days
https://t.co/mB2bGeuTCs
2- Weekly breakout
https://t.co/jip4q9eyn9
3- Breakouts in short term
https://t.co/aVAM1eY6yr
4- Bullish from last 5 days
https://t.co/YDlRAqwc2C
-------------------------------------
intraday screeners
5- 15 minute Stock Breakouts
https://t.co/DgR4azPSuZ
6- Intraday Buying seen in the past 15 minutes
https://t.co/rSOtxXodWk
7- Stocks trading near day's high on 5 min chart with volume BO intraday
https://t.co/z8bNHMUkJU
Happy Trading ❤️❤️
🔥🔥🔥 Wonders of compounding
Here’s a hypothetical illustration of how a ₹10 lakh investment can become ₹1 crore when a stock turns into a 10× multibagger over 5–7 years, supported by strong earnings growth
1️⃣ Starting Point (Year 0)
•Initial investment: ₹10,00,000
•Stock price: ₹100 per share
•Number of shares bought:
₹10,00,000 ÷ ₹100 = 10,000 shares
•Company fundamentals at entry:
•EPS: ₹5
•P/E multiple: 20
•Market price = EPS × P/E = ₹5 × 20 = ₹100
2️⃣ What Drives a 10× Multibagger?
A 10× return usually comes from two combined forces:
🔹 A. Earnings Growth (Main Driver)
•Company compounds earnings at ~30–35% CAGR
•Over 6 years, EPS grows roughly 6–7×
🔹 B. Valuation Re-rating (Secondary Driver)
•P/E expands as business quality improves
•From 20× → 30× due to:
•Consistent growth
•Strong ROCE
•Market leadership
•Clean balance sheet
3️⃣ After 6 Years – The Transformation
🔥🔥 Earnings Growth Illustration
YearEPS (₹)
05
16.6
28.6
311.2
414.6
519.0
625.0
👉 EPS grows 5× in 6 years (conservative for a multibagger)
4️⃣ Valuation at Exit (Year 6)
•EPS: ₹25
•Exit P/E: 40 (premium for consistent compounding)
📌 Final stock price:
₹25 × 40 = ₹1,000 per share
5️⃣ Investment Value After 6 Years
•Shares held: 10,000
•Final price: ₹1,000
💰 Final portfolio value:
10,000 × ₹1,000 = ₹1,00,00,000 (₹1 crore)
6️⃣ CAGR of Investment
•₹10 lakh → ₹1 crore in 6 years
📊 CAGR ≈ 47% per annum
This is typical of true multibaggers, not average stocks.
7️⃣ Key Business Characteristics Behind Such a Journey
Stocks that achieve this usually have:
•🔹 Revenue & profit growth >25% CAGR
•🔹 ROCE >20% consistently
•🔹 Low or zero debt
•🔹 Strong cash flows
And
•🔹 Large runway for growth - TAM
•🔹 MOAT
•🔹 Capable & ethical management
8️⃣ Important Reality Check
•Price doesn’t move linearly – there will be:
•30–40% drawdowns
•Long consolidation phases
•Patience & conviction matter more than timing
•Most investors exit early and miss the full 10× ☹️
✨ In essence:
Wealth is created when earnings compound for years and the market eventually recognizes the business quality. ✌️✌️
👉🏾 Learn to identify potential early stage multi baggers and give the α (alpha) to your equity portfolio.
The Trading Journey Just continues.. Naysayers step out...
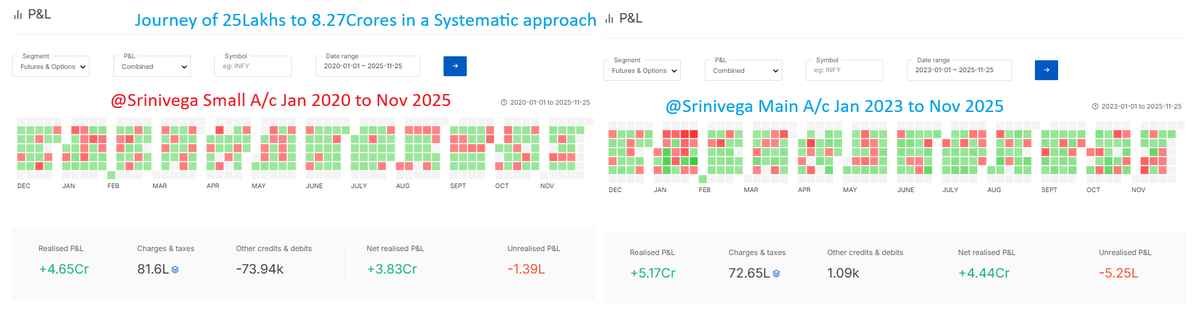
25 Lakh → 8.27 Crore
Jan 2020 → Nov 2025 Only option selling. Just Weekly expiries. No 1000% months. No funded-challenge drama.
Red days exist. Green clusters win in the end. Still gonna say “F&O mein paisa nahi banta”?
#OptionsTrading #Srinivega #2521
After years of experience in equity market, I fine-tuned my strategy-
1) No trading (traded till 2015).
2) Zero investment in loss making businesses.
3) 96-97% of the total funds are invested in eleven undervalued businesses. All investments are based on fundamental analysis.
4) All the invested companies are profitable, generate cash flows, and pay dividends.
5) Very low churn ratio. On an average 10-15% per annum.
6) I don’t buy any shares in FOMO or sell in panic.
7) Zero debt.
8) I always keep emergency funds.
Compounding with very less stress.🙏🙏
Mark Minervini Setup
How to find stocks
Screen stocks that are within 25% of their 52-week high
Eliminate the following stocks
Eliminate stocks trading below 30
200 MA is rising for at least 3 months
50 MA is above 200 MA
Current price is above 200 SMA and preferably above 50 too
Current price is at least above 100% from 52-week low
The stock should have made a 52-week high at least once every 4 to 6 months
Buying Pattern
Make stock list every week after weekly closing
Use weekly charts
Use Volatility Contraction Pattern (VCP)
Use only Price and Volume
Stocks moving up with good volume and then falling with lower volume (consolidating) is good
Use weekly charts
AMO daily charts are good for seeing setting of the stock
Look for volatility contraction in daily charts (just for looking entry)
You don’t need to find new candidates every day, try to add to existing position
Breakouts should happen between 4–8 weeks
Win rate is only 50%, so be prepared
Post Buying Monitoring
Follow up buying
Green days vs Red days
Up Volume vs Down Volume
Tennis Ball Action
Shallow Pullback
VCP Pattern
Volatility Contraction Pattern (VCP)
To calculate volatility contraction, divide swing low by swing high then -1 gives the % drop in volatility
There should be ideally 3 VCP
Each time volatility should decrease by ideally 50% (not a hard rule)
Buy when the previous swing high is taken out
With volatility, there is also time contraction which is very similar to price contraction
Take a stock for 2 VCP only if the second contraction is more than 70%
Stop Loss Calculation
Plot 20-period ATR on daily chart
Calculate 2× of the above value
Use this value as your stop loss
Use maximum of 10% as stop loss
Here’s Mark Minervini coming into the ‘95 uptrend based on what stocks met his criteria. He didn’t get really aggressive until April ‘95 - had an incredible 413% return that year! From ‘Trade Like A Stock Market Wizard’ - Minervini 2013