Markets have a very direct way of telling you just how smart your ideas are (or aren’t).
So once a month, we go back through our Research investment ideas and see how they’re actually holding up.
Every trade is tracked, every number reviewed, and every update is there for you to inspect: the hits, the misses, the slow burners, the character-builders.
Since their launch in October 2024, our ideas have delivered an average return of 35%, beaten their benchmarks by 19 percentage points, and posted a 74% “hit rate” – meaning most of our calls made money.
But it’s a new month, so we go analyst by analyst, and get into what worked, what didn’t, and the changes we’re making from here.
Full report here:
https://t.co/hKDD4BCKux
For years, SpaceX looked like a masterclass in capital efficiency, raising just over $9 billion to build a dominant rocket-launch and satellite-internet business.
But Elon Musk’s company is now transforming into something much bigger – and much more expensive: an AI infrastructure giant.
See, SpaceX’s merger with xAI has dramatically changed its economics.
While reusable rockets and Starlink once helped keep spending in check, AI demands enormous investment in data centers, chips, and computing power.
In 2025, SpaceX spent more than $20 billion on capital expenditures – exceeding its annual revenue – with over half of that on AI.
The bet is that owning the underlying compute infrastructure could unlock massive future profits while deepening SpaceX’s competitive moat.
The firm seems to have a cost advantage in building data centers and is already exploring more ambitious projects, including space-based computing and its own chipmaking plant.
But investors considering a potential IPO face a key question: can the company generate returns fast enough to justify its soaring costs?
Unlike its space business, where SpaceX already holds a dominant position, success in AI will require years of heavy investment before generating meaningful returns.
And competition is also far more intense, with rivals like OpenAI, Anthropic, and Google currently offering stronger AI models.
With a mooted $1.8 trillion IPO valuation – more than 90x last year’s revenue – investors would be pricing in a long, costly road to profitability. Buckle up.
#Space #SpaceX $SPCX #AI #OpenAI #Anthropic $GOOGL
Imagine you’ve bought a stock, and it’s either ripped higher or ripped lower.
The decision you make next could have a bigger impact on your portfolio than the stock you chose in the first place.
Now, there’s a theory that investors dealing with losses tend to fall into three “tribes”: rabbits, assassins, and hunters.
And the ones who see gains tend to be either raiders or connoisseurs.
Rabbits cling to losing positions, hoping they'll bounce back. But if your thesis still holds, you should buy more at the lower price. If it doesn't, you should sell. Either way, standing still rarely makes sense.
Assassins cut losses quickly, often selling after a 20%-30% drop or if a stock fails to recover within six months. The logic is simple: why tie up capital in a loser when it could be working elsewhere?
Hunters take the opposite approach. If their investment thesis remains intact, they average down by buying more at lower prices. But discipline matters: cap your total loss on any position and avoid doubling down on highly risky stocks.
Raiders take profits early, locking in gains but often missing much bigger upside.
Connoisseurs let winners run, occasionally trimming positions to bank some profits while staying invested for the long term.
Eventually, every position needs an exit. Two good rules of thumb: sell when your investment thesis breaks down, or when the stock falls 30%-35% from its peak.
Read or listen to the full guide here:
https://t.co/ziLghxqaPW
The Finimize chart of the day shows gold has overtaken Treasuries as the world's top central bank reserve asset.
The numbers are striking: bullion now accounts for 27% of all global central bank reserves, up from 20% just a year earlier, while US Treasuries slipped to 22% from 25%, according to a fresh ECB report.
That’s a pretty big shift: Treasuries have long been the go-to safe asset for central banks.
So what's driving this golden glow-up? Two big forces.
First, central banks have been on a buying spree – snapping up 850 tonnes in 2025 alone, after three straight years of purchasing over 1,000 tonnes annually.
Second, gold prices have nearly doubled in two years, hitting a jaw-dropping $5,500 per troy ounce in January.
The geopolitical backdrop matters too.
Ever since the US froze Russia's dollar reserves in 2022, countries have been quietly diversifying away from the greenback. China, Poland, Turkey, and India have been the biggest accumulators.
Still, this isn’t the end of the greenback. Dollar assets remain the largest overall reserve bucket at 42%.
But one thing is clear: as geopolitical and economic uncertainty persists, central banks are diversifying their reserves, with gold reclaiming a central role in the global financial system.
#Bitcoin #Treasuries #CentralBanks
What you need to know about markets today 👇
1️⃣ Berkshire Hathaway made its first major acquisition under Greg Abel, betting billions on US housing just as most investors are worried about the sector’s outlook.
2️⃣ Nvidia unveiled a new AI-focused PC chip, extending its reach beyond data centers and giving another boost to the companies riding the global AI wave.
Nebius marches higher, again.
#NBIS#AI#Finimize#Bloomenergy
After today’s current 16% jump on comments from Jensen Huang at Computex, Nebius has now climbed 220% this year.
Last July, the stock was trading around $50 when it was added to the Finimize portfolio. Back then, I laid out a very optimistic scenario in which Nebius could eventually build a gigawatt (GW) of data-center capacity. That kind of power could support around $10 billion in yearly revenue, using a ballpark assumption of $10 in annual sales per watt. At the time, it seemed ambitious. The company was aiming to have just 100 megawatts (or 0.1 gigawatt) by the end of 2025.
Under that 1 GW scenario, I estimated that Nebius could eventually rake in around $10 billion in revenue and $2.5 billion in operating profit, or earnings before interest and taxes (EBIT). I used a 25% EBIT margin to come to those figures, which was definitely on the optimistic side, and then I applied a valuation measure of 16x its enterprise value (that’s the EV-to-EBIT multiple), and came up with a possible market value of $40 billion.
That sounded like a lot, sure. But the firm’s market cap just hit $68 billion, five times what it was a year ago. And the wildest part of this is that it looks like the company is just getting started.
Last month, Nebius said it had already contracted over 3.5 GW, beating the 3 GW target it had set for the end of 2026. It’s now aiming to bring more than 4 GW of contracted capacity online by year-end.
Using the same rough math, a 4 GW scenario could imply something like $40 billion in annual revenue. At a 25% operating margin, that would mean $10 billion in EBIT. Put the same 16x EV/EBIT multiple on that, and Nebius could end up with a valuation of $160 billion. Against today’s roughly $57 billion market cap, that points to a potential tripling of the stock price.
Let’s be clear: that’s not my base-care forecast and may take time to get there. And there are plenty of ways for things to go wrong – scaling, planning, financing, and potential share dilution, to name just a few. Still, its stakes in AI database company, Clickhouse and autonomous vehicle company, Avride, could act as potential sources of billions of dollars of financing.
At one point last month, there were fears that power permit issues might hamper the firm’s ability to fulfill its Microsoft contract. But Nebius found a way, signing a deal with Bloom Energy that solved the energy shortage concerns.
Its shares jumped about 10% at the end of May after a regulatory filing showed that Situational Awareness, an AI hedge fund run by a former OpenAI employee, had bought a 5.6% stake in Nebius. The news gave Nebius a little more sparkle. After all, the fund has already backed a few big AI winners, including Bloom Energy and Sandisk. And now Nebius is its biggest holding.
https://t.co/1TVBvPHPl2
SoftBank has surpassed Toyota as Japan's most valuable company.
That’s a title Toyota had held for more than two decades, but the AI boom has rewritten the pecking order.
SoftBank’s shares surged over 14% on Monday, lifting its market value to roughly ¥48 trillion and nudging it ahead of Toyota’s ¥46 trillion.
The move caps a remarkable rally: SoftBank stock has climbed more than 90% this year as investors pile into companies seen as key beneficiaries of the AI revolution.
SoftBank has committed tens of billions of dollars to OpenAI, is benefiting from strong momentum at chip designer Arm, and recently announced plans to invest up to €75 billion in AI computing infrastructure in France
Investors are also betting that future listings of key portfolio companies could unlock additional value.
Toyota, meanwhile, is facing a tougher backdrop.
Its shares are down over 10% this year as rising oil prices, geopolitical tensions, and the costly transition to EVs have weighed on sentiment toward the automaker and the broader sector.
The reshuffle at the top of Japan’s market highlights a broader shift in investor priorities.
Where Japan’s market was once dominated by industrial giants, capital is increasingly flowing toward technology, semiconductors, and AI infrastructure.
$TM #SoftBank #Toyota #AI #Japan
🔎 The Focus This Week: Down To Business
Friday’s US jobs report should give a clear read on the state of the American economy.
So far, the country’s labor market has been pretty resilient – April’s figures came in at a robust 115,000, way higher than some worried estimates.
That marked the first back-to-back monthly increase in employment in nearly a year, and even better, it was backed up by a steady, unchanged 4.3% unemployment rate.
With that in mind, experts are predicting that the US economy added 110,000 jobs in May.
And if so, that would be great news.
Food and energy prices are rising, and that’s got consumers putting their wallets away: consumer confidence hit a record low in May.
Solid job numbers, however, might put a little spring back in their steps, all the way to the stores.
But higher inflation and a struggling jobs market? That’s a real problem.
▶ As long as the data comes in anywhere close to expectations, the Federal Reserve will likely stand pat at its upcoming interest rate meeting in June.
See, the Fed has two mandates – keep the job market healthy and keep inflation slow and steady at 2%.
But there’s a lot of uncertainty at the moment: higher energy prices have pushed up inflation – with most measures showing price growth above 3% – while the labor market is, so far, pretty strong.
That leaves the Fed little incentive to cut rates.
Read the full Finimize Weekly Brief – a recap of last week’s highlights and a preview of the key things to watch in the week ahead – here:
https://t.co/YJTX1pY6my
#Jobs #Fed #USeconomy
What you need to know about markets today 👇
1️⃣ Anthropic has overtaken OpenAI as the world’s most valuable private AI company, as Wall Street finds increasingly creative ways to keep funding the AI buildout.
2️⃣ Dell’s stock soared after a surge in AI-server sales and a major Pentagon contract, adding another name to the growing list of companies cashing in on the AI infrastructure boom.
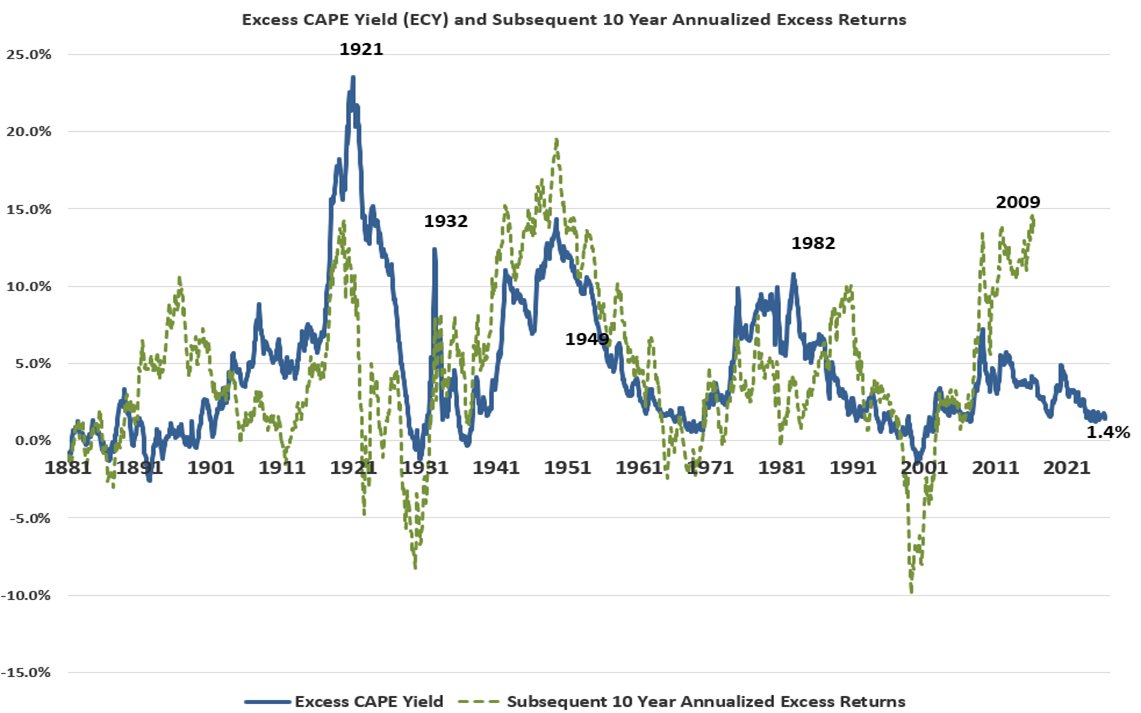
Stocks Seem Expensive. This Metric Tells You If They Really Are.
The excess CAPE yield, developed by Nobel laureate @RobertJShiller, measures how attractive stocks are compared to bonds by examining the difference in their real yields.
It has two components: the CAPE itself and its conversion into an excess yield figure.
The CAPE is essentially a price-to-earnings (P/E) ratio that’s been smoothed over a broader horizon to account for variations in the business cycle.
It compares current stock prices to average earnings over the previous ten years, adjusted for inflation.
This smoothing process makes the CAPE especially useful when analyzing stocks over long periods.
The excess CAPE yield is calculated by inverting the CAPE ratio (1 divided by CAPE) to determine the earnings yield for stocks, then subtracting the real (i.e. inflation-adjusted) 10-year Treasury yield.
Essentially, this metric measures the attractiveness of stocks, relative to bonds, by examining the difference in their real yields.
The rationale is simple: stock valuations shouldn’t be viewed in isolation from bonds. Lower bond yields, after all, justify paying more for stocks.
Historically, the higher the excess CAPE yield has been, the better the returns of stocks (again, relative to bonds) over the following decade.
The reverse is also true, as you can see in the chart below.
So here's where the excess CAPE yield stands today – and what it means for investors:
https://t.co/Uy8N8AD7oP
#valuations #stocks #bonds #CAPE
What you need to know about markets today 👇
1️⃣ Snowflake’s strong results and massive AWS deal are easing fears that AI will wipe out software firms, showing that some SaaS companies could actually benefit from the boom.
2️⃣ US inflation stayed stubbornly high in April, leaving the Fed stuck between rising energy-driven price pressures and an economy it can’t afford to slow too aggressively.
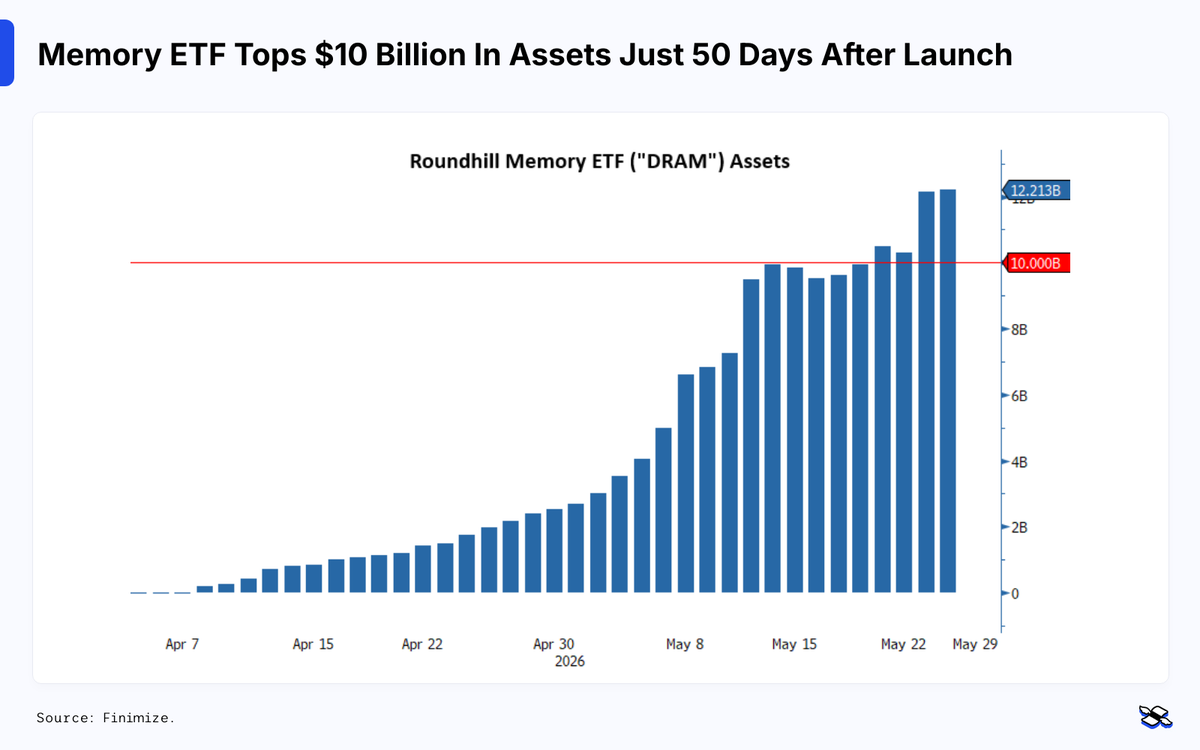
The Finimize chart of the day shows an ETF focused on memory stocks has surpassed $10 billion in assets just 50 days after launch.
The Roundhill Memory ETF – ticker DRAM, naturally – has become the fastest ETF ever to hit that milestone, smashing the previous record of 81 days set by a bitcoin fund in 2024.
Since its April 2 debut, the ETF has attracted roughly $9 billion in investor inflows and seen its share price more than double.
Investors are piling in because memory chips are central to AI data centers, with Goldman Sachs estimating $7.6 trillion could be spent building those facilities over the next five years.
But DRAM is hardly diversified: 73% of its assets sit in just SK Hynix, Samsung Electronics, and Micron.
Analysts warn the fund's extreme concentration is a real risk.
What’s more, Morningstar research shows thematic ETF investors historically underperform the very trends they chase.
That’s because they often buy after the excitement has already peaked, then sell into weakness.
The Covid-era renewable energy and cannabis ETF frenzy serves as a cautionary tale…
$MU $DRAM #Memory #Samsung #SKHynix #AI
Big money’s midyear market calls are in 👀
JPMorgan, Morgan Stanley, and Fidelity broadly agree: stay invested, watch inflation, and don’t hide in cash.
But they split hard on US stocks, global markets, and the classic 60/40 portfolio ⚖️
The cheat sheet 👇
https://t.co/0mYlnk0QtP
What you need to know about markets today 👇
1️⃣ As SpaceX prepares for its blockbuster IPO, speculation is building that Elon Musk could eventually merge his rocket giant with Tesla into one sprawling AI-powered empire.
2️⃣ South Korea’s stock market has doubled this year, as investors keep piling into AI-linked memory chipmakers and chasing the next big bottleneck in the tech boom.
Space stocks are having a moment – and it's not hard to see why.
Growing excitement around the space economy is increasingly favoring companies positioned to benefit from SpaceX's upcoming public offering, as well as rising enthusiasm for space exploration and increased funding.
Yesterday, Redwire surged 26%, AST SpaceMobile climbed 13%, and Canadian firm MDA Space rose nearly 5% – all riding the wave of SpaceX hype. Firefly Aerospace jumped 19% after NASA selected its Elytra spacecraft to deliver drones to the moon.
The broader numbers are just as eye-catching. A Bank of America basket of key US space companies has climbed 57% this year, while the Procure Space ETF (UFO) has gained around 69% year-to-date – both leaving the S&P 500's 10% gain in the dust.
SpaceX's IPO could land as early as next month, targeting a raise of up to $75 billion. But not everyone's strapping in just yet. One wealth manager warns that many of these companies remain unprofitable with rich valuations, urging investors to keep allocations small in what remains a highly speculative corner of the market.
$ASTS $RDW $MDA $FLY $UFO #Space #SpaceX
While I love the education material that's free at Finimize. Mauboussin is a master and can add to your understanding if you want to learn more about investing. https://t.co/3vUn0W7ewO
This is the time of year when a lot of investment firms welcome interns. While our work is geared toward institutional investors, a lot of it can be useful for learning about markets and the investment process. Here are a handful of reports and how they can guide interns:
Demand for AI compute is so strong that H100 spot prices have been rising, which has enabled neocloud providers like Nebius to push through higher GPU rental rates and lift their profit margins, and share prices.
#NBIS#NVDA#AI
🔎 The Focus This Week: America’s Inflation Test
On Thursday, the US releases April’s PCE index – the Fed’s preferred inflation gauge.
The question isn’t just whether consumer prices are still rising. It’s whether they’re rising fast enough to make rate cuts look even more unrealistic – or, worse, to put hikes back on the table.
March’s numbers didn’t exactly calm anyone down: headline PCE rose 3.5% YoY, up from 2.8% in February. Core PCE – which strips out food and energy – rose 3.2% YoY.
That was in line with expectations, but still too hot for comfort, especially with the Fed’s target sitting at 2%.
The worry is that April won’t look much better – investors are bracing for another sticky PCE report, with core inflation expected to edge up to 3.3%.
This won’t be investors’ first look at April inflation – the other key inflation gauge, the CPI, showed that inflation climbed to 3.8% in April, with energy, housing costs, and food all pushing prices higher.
The PCE, however, will be the number the Fed watches most closely, because it gives a broader view on what people are actually buying.
It also arrives alongside income and spending data that show whether households are still powering through those higher prices – and if they are, inflation is likely to remain stubborn.
Meanwhile, the bond market has already started doing the Fed’s talking for it – suggesting that borrowing costs should and will remain high.
The US 30-year Treasury yield briefly hit 5.2% last week, its highest level since 2007, as investors demanded more compensation for inflation risk and America’s growing debt load.
See, rising long-term yields are the market's way of betting that inflation and government borrowing will both stay stubbornly high.
And investors suspect they may not have seen the peak yet: in one widely followed survey, 62% of global fund managers said they expect that yield to reach 6%.
Traders have also sharply repriced the outlook for interest rates: before the Iran war, they were expecting 2-3 cuts this year. Now, markets are betting on a much higher chance of a hike by December.
So this week’s PCE report could land in three very different ways.
• A lower-than-expected reading would give investors some relief, especially after the recent jump in long-term yields.
• A result in line with forecasts would probably keep markets stuck in their current holding pattern: no cuts on the horizon, but no panic either.
• A hotter number, though, would be the uncomfortable one. It would make the “higher for longer” story feel more like “even higher again”, and that could put fresh pressure on stocks, bonds, mortgages, and anything else that’s been counting on cheaper money.
Read the full Finimize Weekly Brief – a recap of last week’s highlights and a preview of the key things to watch in the week ahead – here:
https://t.co/piu7EcTnh2
#US #Inflation #USeconomy #PCE #Bonds