1/ Uutisia julkaisurintamalta!
Tutkimuksemme @eerola_essi, @TeemuLyy ja Tuuli Vanhapellon kanssa asumistuen vuokravaikutuksista on nyt julkaistu.
Tulokset ovat jo laajalti tiedossa, koska tutkimuksen työpaperiversio julkaistiin jo muutama vuosi sitten, mutta kerrataan vielä.🧵
My favourite 10 examples where relaxing planning restrictions substantially increased housing supply.
1) Auckland
2) Sao Paulo
3) Zurich
4) Campbelltown, SA
5) Lower Hutt
6) New York
7) Austin
8) Edmonton
9) Tokyo
10) Croydon
Here’s a tweet or two on each. 1/15
Hannu Karhunen selittää kirkkaalla tavalla, miksi tulosten mittaamiseen perustuva kausaalipäätelmiin yltävä tutkimus tarpeen koulutusponnistusten(kin) arvioinnissa: laki velvoittaa ja (niukkojen resurssien oloissa = aina) täytyy tietää, mikä toimii. https://t.co/lmYvJGbxw8
Voisimme ottaa minkä tahansa yksittäisen julkisen menon, korvamerkitä joku vero sen rahoittamiseksi ja asettaa tuo vero niin korkeaksi, että se riittää rahoittamaan kyseisen menon.
Sitten meillä olisi uusi "hyvin hoidettu" osa julkista taloutta, josta on turha hakea säästöjä.
@majulepp Vielä ei huipuissa, mutta hauskan erisuuntaiset siirrot normaaliin. Viron ja Suomen tuulella säästellään SE1 vesivarastoja? Homma toimii kuten pitääkin
@tommielo Joo potentiaalia on moneen. En usko että kovin moni on kiinnostunut kantamaan asumustaan pois tontilta vuokrakauden päättyessä, joten kummallakin osapuolella lienee halu päästä yhteisymmärrykseen hinnasta millä siihen päästään. Isojen pomppujen kohdalla vaan se voi olla vaikeaa
Every time I discuss the economic and social disruptions caused by the worldwide decline in fertility, I hear the same response: artificial intelligence (AI) and robots will make this issue irrelevant.
I find the answer deeply paradoxical because, despite being an economist, I am compelled to point out that the argument suffers from the mistake of “economism”: thinking that all social interactions in life are solely about productivity.
Most of the problems caused by declining fertility are largely unrelated to productivity: the depopulation of rural areas, the collapse of public services, and inverted family structures in which one child supports four grandparents. Reducing all of this to purely economic terms is an extremely narrow view of society and life. A robot cannot visit your grandmother in a nursing home in a depopulated town in Korea.
But there is an even more fundamental question: how do you know that societies will permit the deployment of artificial intelligence on a large enough scale? If we have learned anything from economic history, it is that societies repeatedly create barriers to wealth and hinder the adoption of new technologies.
The Roman Empire had a working steam device, the aeolipile, and never developed it beyond a toy. The Ming dynasty burned Zheng He’s fleet and turned inward. Spain expelled its Jewish and Moorish populations at the height of its imperial power, gutting its merchant and artisan classes. The Ottoman Empire resisted the printing press for nearly three centuries after Gutenberg. Tokugawa Japan had firearms in the 1500s but chose to abandon them. The Qing restricted all foreign trade to a single port in Canton for over a century. Argentina was one of the ten richest countries in the world in 1910 and spent a century in relative decline through self-inflicted policy choices. The Soviet Union had world-class mathematicians and physicists but could not produce a decent pair of shoes because the institutional framework would not allow it. India’s License Raj strangled industrial development for four decades after independence. Closer to our own time, much of Europe spent decades resisting genetically modified crops despite the technology being available. Right now, the EU is drafting some of the strictest AI regulations in the world.
And these problems will hit hardest where people least expect them. The conversation about aging and AI tends to focus on rich countries like the U.S. or Japan, but the most acute disruptions will come in emerging economies. Latin America and the Middle East have experienced some of the deepest and fastest declines in fertility on the planet. Colombia’s TFR is 1.06, Jamaica’s 1.20, Turkey’s 1.48, and Mexico’s 1.60. These countries are getting old before they get rich. On top of that, they face a double blow: not only are fewer children being born, but their most skilled and ambitious young workers are leaving. The doctors, engineers, and entrepreneurs who might drive AI adoption are moving to the US, Canada, or Europe.
And let’s be honest: these are not exactly countries known for getting out of the way of innovation. The political economies of Latin America and the Middle East are riddled with extractive institutions, captured regulators, powerful incumbents who block competition, and states that struggle to deliver basic public services, let alone manage an AI transition. If Argentina could not reform its economy in a hundred years of trying (perhaps it is doing it now, but the jury is still out on whether this reform will be sustainable), if Mexico cannot keep its own engineers from leaving, if Egypt cannot fix its educational system, I am not sure why we should expect them to seamlessly deploy the most disruptive technology in human history. The countries that most need technological dynamism to offset demographic decline are precisely the ones least equipped to make it happen.
There is nothing inevitable about adopting new technologies. It requires political will, institutional flexibility, and social acceptance. Aging, fiscally strained democracies dominated by elderly voters are not obviously the best candidates for any of those three.
So when someone tells me “don’t worry, AI will fix it,” I hear an argument that assumes the best possible technological outcome, assumes societies will actually adopt it, assumes it will be deployed fast enough, and assumes the only thing that matters is productivity. That is four enormous assumptions stacked on top of each other. And I am sorry, but since I teach global economic history for a living, I have learned that optimistic assumptions are rarely validated by the crooked timber of humanity.
My colleague Sylvain has a great comment about the need to control for basic demographic composition when reporting statistics. It sounds obvious, but a surprising number of people fail to do it.
The same goes for tons of other statistics. I often see comments about the evolution of the mean (or median) wage over time, without realizing that the mean (or median) wage earner in 2026 is very different from that in 1980. The workforce today is older, more educated, more female, more immigrant, and concentrated in different sectors and regions. Comparing raw means across these two populations conflates changes in prices (what a given type of worker earns) with changes in quantities (who is in the workforce).
Or take an example from a conversation I had yesterday about China's college graduates. The median college graduate in China in 2026 (around 12 million per year) is drastically different from the median college graduate in 1999 (slightly less than 1 million). The median college graduate now has a totally different socioeconomic and geographic background. Many come from rural families and attend institutions that barely existed two decades ago.
Reporting that “returns to college in China have fallen” without accounting for this massive composition shift is close to meaningless: you are comparing the wage premium of an elite group selected from top urban families with the wage premium of a mass group drawn from the entire population.
This is not a minor technical point. To analyze the effects of institutions and policies, one needs to break down the effects of within-group and between-group differences. A rising or falling average can be entirely driven by who is in the sample, not by what is happening to any given person.
Without that decomposition, we end up circling around meaningless statistics and drawing policy conclusions from compositional artifacts.
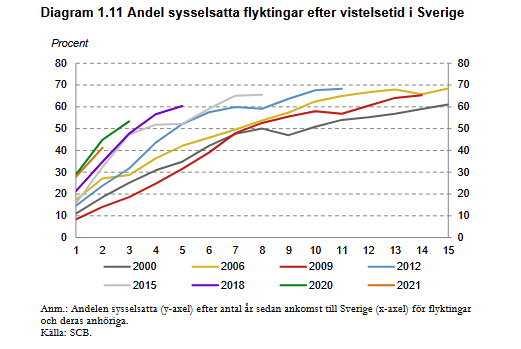
Finanspolitiska rådet julkaisi hiljattain vuosiraporttinsa.
Paljon kiinnostavia huomioita, etenkin ao. kuvio on hienosti tehty. Maahanmuuttajat työllistyvät vuosi vuodelta entistä nopeammin, kun otetaan huomioon sekä tulovuosi että maassaolon kesto.
https://t.co/h5LUsreOwz
In the first post of this series, I showed that the order in which returns arrive during your working life determines how much wealth you accumulate by retirement. Two workers making identical contributions to the S&P 500 over 46 years ended up with wealth that was 2.9 times different, purely because of when they were born. In the second post, I showed that the problem is worse in retirement.
Today, I stitch the two halves together and ask a simple question: Can you retire comfortably if you save diligently for 46 years? Suppose you want to spend $100,000 a year in retirement and expect to live 30 years (all figures in real term,s). You start saving $5,000 a year at age 22, increasing your contribution by 1% annually in real terms. After 46 years, you have contributed approximately $290,000. Can you get there?
In the figure below, I run the full life cycle (accumulation and drawdown) for 34 cohorts, one for each starting year from 1945 to 1978. The data are the same as in the previous posts: actual annual real total returns on the S&P 500 and 10-year U.S. Treasuries from 1945 to 2024 (Damodaran, deflated by BLS CPI-U). For years beyond 2024, I use a block bootstrap with 5-year blocks from the 1945–2024 sample. Each cohort is run forward until its capital is exhausted. The year of retirement for each cohort is indicated by a dot.
I consider two accumulation strategies. The first invests 100% in the S&P 500 throughout working life. The second follows a glide path: 90% stocks at age 22, declining linearly to 20% at age 68, with the remainder in 10-year Treasuries. At retirement, both switch to the same drawdown portfolio: 20% stocks, 80% bonds, rebalanced annually, with withdrawals of $100,000 per year in real terms.
Start with 100% equities during accumulation. The dispersion in capital at retirement is enormous. The 1954 cohort retires in 2000 with $3.04 million. They rode the postwar expansion and caught the 1990s bull market in their final decade, when their portfolio was largest. The 1963 cohort retires in 2009 with $1.05 million. They accumulated steadily for decades, then the 2008 crisis destroyed over a third of their portfolio in their last working year.
Now run the drawdown. All 34 cohorts are eventually depleted. But how long the money lasts varies enormously. The 1954 cohort sustains $100,000 withdrawals for 67 years. The 1963 cohort reaches zero by 2021, just 12 years into retirement. They did not choose a reckless withdrawal rate. They chose a $100,000 lifestyle and saved for 46 years. The market chose the rest. Their implicit SWR turned out to be 9.5%, which was never going to work. But they had no way of knowing that in 1963.
The cohorts in between illustrate the gradient. The 1957 cohort retires with $1.43 million and lasts 19 years. The 1968 cohort retires with $1.76 million and lasts 23 years. The 1976 cohort retires with $2.99 million and lasts 41 years. The pattern is clear: your retirement outcome is dominated by two draws from the same source of risk — the returns in the last decade of accumulation (which determine how much you retire with) and the returns in the first decade of drawdown (which determine how fast the portfolio erodes).
Now consider the glide path. It does what it is designed to do during accumulation: reduce the dispersion in terminal wealth. Most cohorts retire with between $1.0 million and $1.3 million. The spread is much smaller. But the cost is severe. Because the glide path shifts heavily into bonds during the second half of the working life, when the portfolio is largest and compounding matters most, it sacrifices a large share of expected returns. The median cohort retires with roughly just $1.1 million.
The drawdown consequences are devastating. At $100,000 per year on a $1.1 million portfolio, the effective SWR is approximately 9%. Every single cohort is depleted within 13 to 15 years. The 1954 cohort, the best under equities, retires under the glide path with $1.11 million instead of $3.04 million. It lasts 14 years instead of 67.
The glide path did not fail because of sequencing risk in retirement. It failed because it accumulated too little capital. A $100,000 withdrawal is not sustainable on $1.1 million regardless of the return sequence.
The 100% equity strategy produced enough capital for most cohorts to sustain $100,000 withdrawals for 20 to 40 years. But not all of them. The unlucky cohorts were depleted within two decades. But the lucky ones lasted half a century or more. The equity strategy does not solve the problem. It generates enough expected wealth that the problem becomes survivable for most cohorts. The glide path does not.
This is the central tension. Higher expected returns during accumulation mean more capital at retirement, a lower effective SWR, and a longer-lasting portfolio. But they also mean more variance: some cohorts accumulate far less than others. You can reduce the variance with a glide path, but the cost in expected return is so large that the typical retiree ends up worse off, not better. The insurance is real. It is also ruinously expensive.
I must emphatically highlight that I picked these two strategies because they bracket the range of outcomes, but do not exhaust it. You can adjust the equity share, the glide path slope, the bond allocation in retirement, or the withdrawal amount. You can implement variable withdrawals, add a cash buffer, or use momentum signals. I have run many such variations. The specific numbers change.
But the fundamental result does not: a large share of the variation in retirement outcomes is driven by the sequence of returns, and no portfolio strategy eliminates that variation without a commensurate sacrifice in expected wealth.
So, if you are going to tell me that you have a different strategy than these two, that nobody should follow a $ 100,000 fixed retirement strategy, etc., you are missing the point. The point is that there is a lot of aggregate risk out there, and insuring against it is really costly.
This is why the structure of a retirement system matters. A fully funded system, where each generation saves and invests for its own retirement, exposes every cohort to the sequencing risk I have documented in these three posts. No portfolio strategy eliminates it.
A pay-as-you-go system, by contrast, transfers resources from current workers to current retirees, so the retirement income of the 1963 cohort does not depend on what the S&P 500 did between 1963 and 2009. It depends on the productivity of the workers employed in 2009. That is a different risk, and crucially, it is not the same risk.
A system that combines both components, a funded pillar that captures the equity premium over long horizons and a pay-as-you-go pillar that provides a floor independent of market outcomes, diversifies across two relatively uncorrelated sources of risk.
Neither pillar alone is sufficient. The funded pillar generates higher expected wealth but leaves retirees exposed to bad draws. The pay-as-you-go pillar provides insurance against those draws but cannot deliver the returns needed for a comfortable retirement. A reasonable system has both.
Defenders of full funding point to the superior expected returns and dismiss pay-as-you-go as a Ponzi scheme. Defenders of pay-as-you-go point to the security it provides and dismiss funded systems as a casino. Both are wrong in the same way: they evaluate return and risk separately rather than jointly.
The funded system has higher expected returns and higher risk. The pay-as-you-go system has lower expected returns and lower risk. This is not a puzzle. It is the most basic tradeoff in finance. Anyone who claims one pillar dominates the other on both dimensions is either ignoring the risk or ignoring the return.
And no, pay-as-you-go is not a Ponzi scheme if the system's expenses grow at the same rate as its revenues. This is exactly what notional defined-contribution systems like Sweden’s achieve: benefits are indexed to the growth of the contribution base, so the system remains solvent by construction, even as the population shrinks.
The right question is not which system is better. It is what mix of the two best serves a society that cannot avoid aggregate risk but can choose how to share it across generations.
And that is why modern economics is so incredibly useful and why I love it so much: it gives you the tools to think carefully about these tradeoffs instead of pretending they do not exist.
If you are going to read one economics essay today, make it this one. One of the most concise explanations of the basic foundations of economics: price theory.
As a behavioral economist I agree with the conclusions: small departures from predictions are not evidence price theory is “wrong”, which is why it’s always critical to underscore the cost of each mistake.
Taksamittaripakko takseihin on esimerkki huonoimmasta mahdollisesta sääntelystä.
Fiksumpaa olisi ollut vaikka laittaa 1000 euron lupamaksu – samat haitat mutta raha olisi sentään tullut valtiolle.
Nyt taksiyrittäjät pakotetaan tuhoamaan tuo varallisuus.