Check out my latest newsletter where I review this wild price action, the broad markets, and my current outlook. $SPY $QQQ $NVDA
https://t.co/FqID4dobFH
$MSFT looks like it is in a C wave that should take it below the March low. If it goes straight down to the $384 gap, the 200-week and the 50-month, I might take a stab at a dead cat bounce. However, this chart is not looking bullish right now.
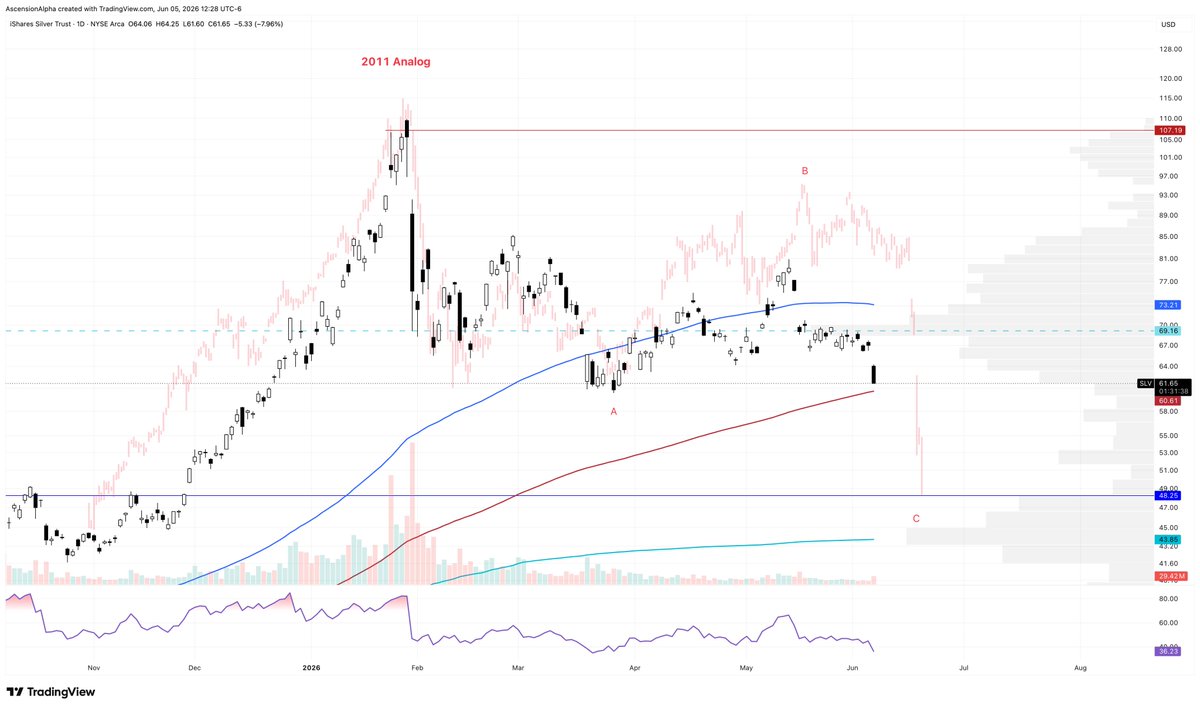
This $SLV analog has been on point for months. If it continues to hold, we should get some kind of bullish pop, maybe into the 100-day, reject and then make a new low below $60.00.
This feels pretty great right about now. Moving averages are sometimes magic. I sold my BTC swing trade at the 200-day SMA. I am now trying another swing at the 200-week SMA. I do think we go lower though, but its worth an R to find out when. bitcoin:native
I made this video a week ago. I have been bearish on BTC since October 31st 2025 and have been posting updates along the way. I sold my bitcoin swing trade at the 200-day SMA on May 7th and told everyone in Real Life Trading. bitcoin:native
https://t.co/2MML3Xk5VV
Check out my latest Newsletter. This market keeps on ripping higher, so the logical thing to do is to stay bullish until key supports are violated. $SPY $QQQ $MSFT $MU
https://t.co/QjvE9zhzh1
Check out my latest Newsletter. This market keeps on ripping higher, so the logical thing to do is to stay bullish until key supports are violated. $SPY $QQQ $MSFT $MU
https://t.co/QjvE9zhzh1
$QQQ has now hit the 10-EMA after a recording breaking 28 day streak. Check out my newsletter from last week if you want to see what history says happens next.
https://t.co/BszoyKcLrx
This $SLV analog has been on point for months. If it continues to hold, we should get some kind of bullish pop, maybe into the 100-day, reject and then make a new low below $60.00.
In 2011 the A wave low came 60 days after the high. We are on day 60 from the high right now and trying to put in a bottom. Failure of this pivot and the 200-day becomes likely and the analog, which has been fire for months, is broken or at least off. #SLV#silver
Fib zone acting as a SOLID wall for price right now. Fun gap today on $SPY and the markets. Today's candle will be telling. If we close weak we are starting the larger dip. If buyers come in once again and buy this up, the party continues. I think the dip is starting now.
$SPY is now pushing directly into a massive Fibonacci confluence zone between $740-$744 after one of the most historic rallies in recent market history. There are 3 major Fibonacci levels stacked on top of each other in this area.
Solid chart on $ONDS. Great consolidation, huge volume on earnings, $11.50 is a massive resistance. A break above and all time highs are on the table.
Should not close below todays candle any time soon.
When I wrote this exactly one month ago, I had no idea just how much like 1999 this was going to be! $CSCO, $DELL and $INTC just ripping higher and not a single dip in $QQQ! Wild times.
https://t.co/w53WjvJkd8
$SPY is now pushing directly into a massive Fibonacci confluence zone between $740-$744 after one of the most historic rallies in recent market history. There are 3 major Fibonacci levels stacked on top of each other in this area.