As the VW Group reports a €5.82 bn Q3 loss, China's Geely posts record Q3 revenue of ¥99bn (€13.3bn, +10%) and a profit of ¥5.21bn (€702m, +32%).
Geely's nine-month sales topped 2.23 million, with exports up 169%.
@VWGroup@GeelyGroup
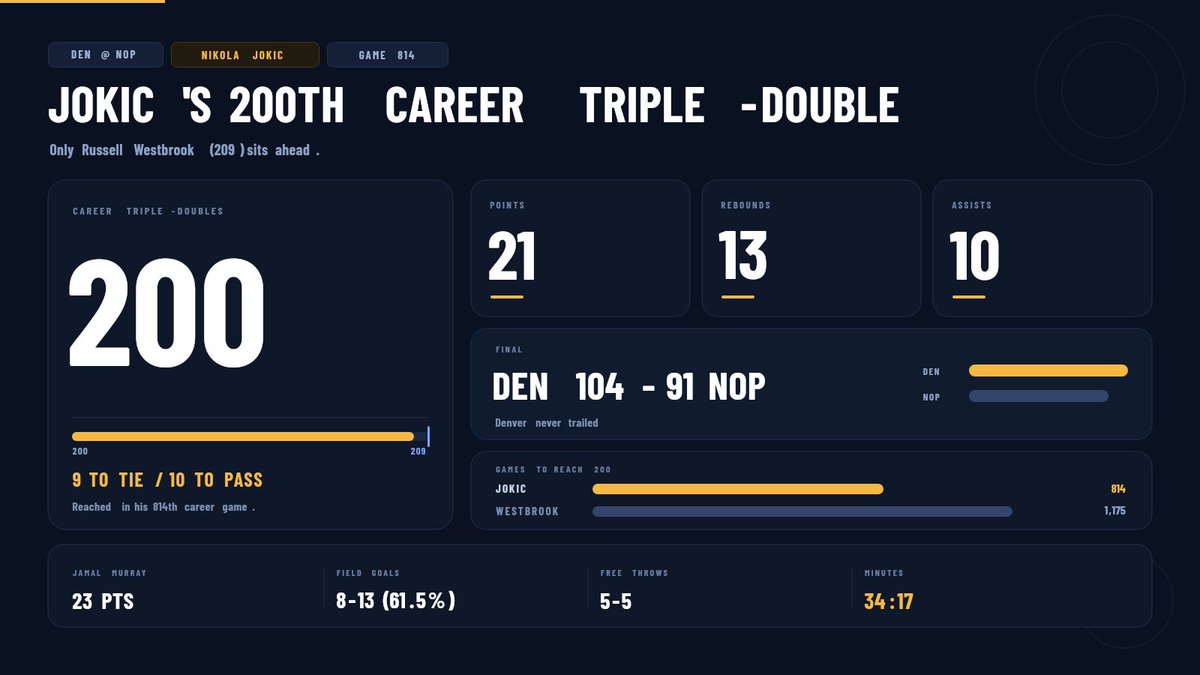
Jokić's 200th career TD: 21/13/10 on 8-13 FG in DEN's 104-91 at NOP. Only Westbrook (209) is ahead — Jokić hit 200 in game 814 vs Russ's 1,175. Murray 23; 9 TDs from the record.
@KnuppelRodney https://t.co/kuRYffwSSn
Nikola Jokić recorded his 200th career regular-season triple-double Wednesday.
Only two players in NBA history have reached that number:
Russell Westbrook: 209
Nikola Jokić: 200
Jokić reached the milestone in his 12th season.
🚨 SILICON MOTION $SIMO Q3 2026 EARNINGS
🟢 Adjusted EPS: $4.35 vs. $3.30 est.
🟢 Revenue: $560.2M vs. $529.1M est.
🟢 Revenue growth: +131% YoY / +24% QoQ
🟢 Adjusted gross margin: 53.7% vs. 48.7% a year ago
🟢 Adjusted operating margin: 32.1% vs. 15.8% a year ago
BUSINESS HIGHLIGHTS:
• SSD controller sales rose 55%–60% YoY.
• Ferri & enterprise boot drive sales surged 2,580%–2,585% YoY.
• MonTitan enterprise and AI SSD controllers began scaling.
Q4 GUIDANCE:
• Revenue: $588M–$616M, up 111%–121% YoY.
• Adjusted gross margin: 54%–55%.
• Adjusted operating margin: 36%–37%.
Management expects full-year revenue to more than DOUBLE, with enterprise and AI products still in the early stages of contributing revenue.
$CROX
Q3 revenue rose 4.6% to $1.043 billion, with HEYDUDE returning to positive growth (+6%). The company raised its full-year revenue and EPS guidance and continues to repurchase shares.
Currently trading around $120; in the short term, if brand growth and share buybacks continue, we see potential for $135–150; if consumer spending weakens or HEYDUDE falters again, the price could fall back to $100–110.
Both brands are improving, and share buybacks are amplifying the upside potential.
#QQQ #STOCK #CROX
$LLY $NVO
Eli Lilly Raises Revenue Guidance as Mounjaro and Zepbound Sales Surge
Eli Lilly delivered another strong quarter, beating Wall Street expectations and raising its full-year revenue outlook as demand for its GLP-1 treatments continues to grow.
Some key numbers from Q3:
• Revenue reached $24.4B, beating expectations of $22.61B.
• Adjusted EPS came in at $7.48, compared with expectations of $6.26.
• Mounjaro generated $10.72B in sales, ahead of expectations of $10.16B.
• Zepbound generated $5.35B, beating expectations of $5.09B.
• Foundayo, Lilly's recently launched obesity pill, generated $184M, below expectations of $217M.
Lilly now expects full-year revenue of $91B to $92B. However, it lowered adjusted EPS guidance to $35.00–$36.00, primarily due to research charges associated with recent acquisitions.
Perhaps the most interesting development is the relationship between pricing and volume.
Lilly reported a 53% increase in volume during the quarter, partly offset by a 15% decline in realized prices.
In the U.S., prices declined 7%, while international prices fell 29%, mainly reflecting Mounjaro's inclusion in China's national reimbursement system.
This highlights an important trend for both Eli Lilly and Novo Nordisk: lower prices can significantly expand access to GLP-1 treatments, potentially supporting substantial volume growth.
According to Bernstein, Lilly has captured approximately 70% of the 700,000 Medicare patients who recently started GLP-1 treatment.
Meanwhile, the competition in oral obesity treatments is worth watching.
Lilly's Foundayo generated $184M in quarterly sales, missing expectations, while Novo Nordisk's oral Wegovy has maintained an early lead in U.S. prescriptions.
Looking further ahead, Lilly is also preparing for the potential regulatory submission of retatrutide next year. The experimental treatment has demonstrated average weight loss of around 24% in midstage trials.
Overall, the results show that demand for obesity treatments remains extremely strong despite increasing pricing pressure.
Link: https://t.co/AVKBNeXNNR
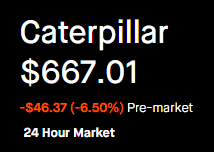
CAT Q3: sales $20.68B (+17%), adj EPS $7.20. Beyond the cash print: Power Gen $3.42B (+30%) mainly data centers; Power & Energy $8.78B (+18%); op profit $4.21B (+38%), adj margin 20.6%.
@MarketMaestro1 https://t.co/NGVPhVgZky
$CAT CATerpillar Non-GAAP EPS of $7.20 beats by $0.17, revenue of $20.7B in-line
Oct 29, 2026,
Q3 Non-GAAP EPS of $7.20 beats by $0.17.
Revenue of $20.7B (+17.6% Y/Y) in-line.
For the third quarter of 2026, enterprise operating cash flow was $4.4 billion, and the company ended the third quarter with $7.9 billion of enterprise cash.
In the quarter, the company deployed $1.2 billion of cash for repurchases of Caterpillar common stock and $0.7 billion of cash for dividends.
Dak at the Linc: career 250 att / 13 TD / 0 INT in 8 games. Mon: 15/27, 212 yds, 3 TD, 118.1 rating. Javonte added career-high 155 rush yds (DAL 204 team rush) as PHI fell to 2-5.
@clarencehilljr https://t.co/2MtnzM51NX
Dak Prescott kept his career-long streak of never throwing an
interception in Philadelphia after completing 15-of-27 attempts
for 212 yards and three touchdowns in tonight’s win. He has
thrown 250 pass attempts and 13 touchdowns with zero inter-
ceptions in eight career games at Lincoln Financial Field.
Tonight was Prescott’s 80th career multi-passing touchdown
game, passing Tony Romo (79) for the most multi-touchdown
games in franchise history.
After tonight’s win, Prescott passed Roger Staubach for the
second-most regular season wins by a Cowboys quarterback
with 86. Troy Aikman has the most wins with 94.
Tonight was Prescott’s 43rd career game with three-or-more
touchdown passes, most in franchise history and tied with Drew
Brees and Russell Wilson for the fifth-most in an NFL player’s
first 11 seasons.
Prescott has 29 career touchdown passes against Philadelphia,
the most by any player in the history of the Cowboys vs. Eagles
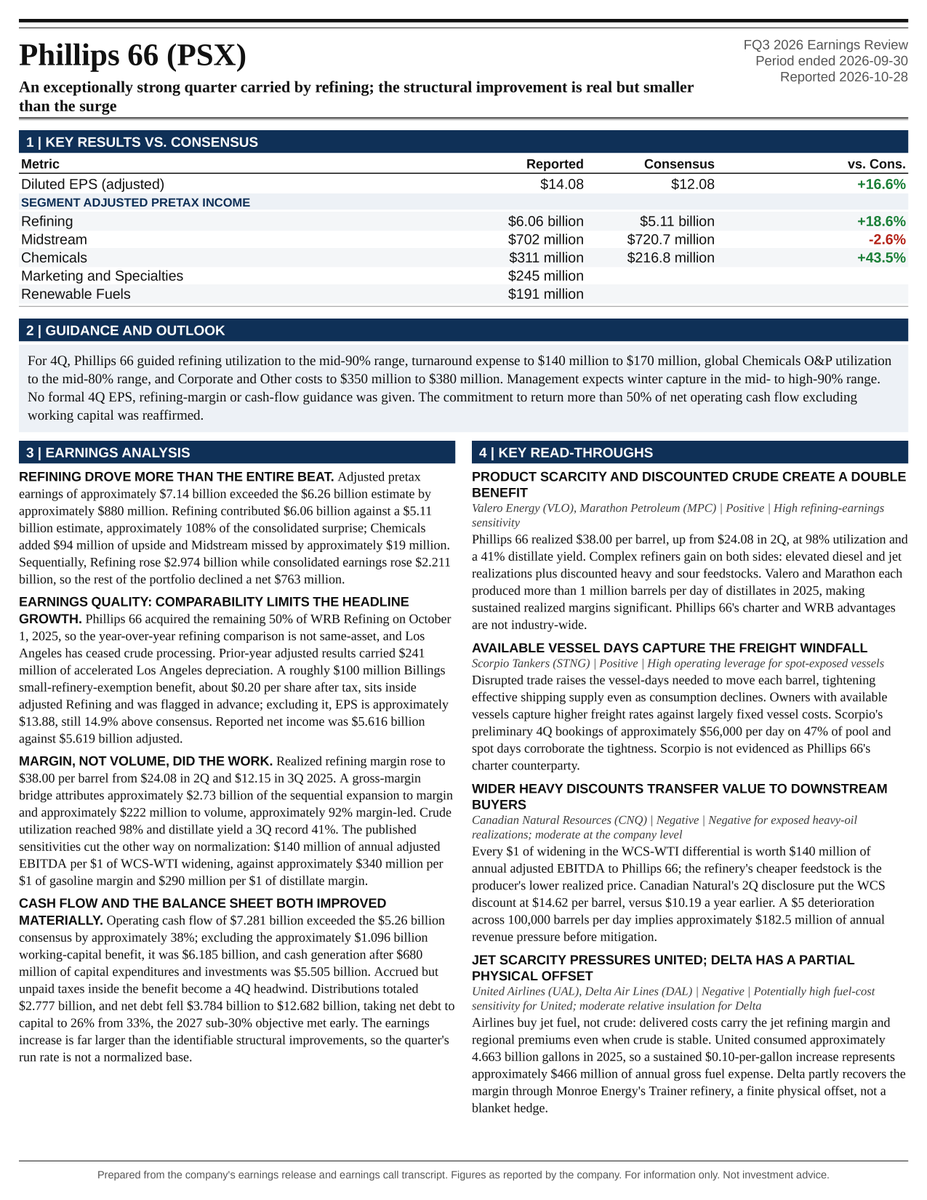
$PSX # KEY READ-THROUGHS FROM PHILLIPS 66’S 3Q 2026 EARNINGS CALL
Phillips 66’s quarter signals a supply-driven redistribution of profits rather than a broad acceleration in demand. Strong refining margins, scarce shipping and constrained product availability benefit reliable refiners and transportation assets while raising costs for fuel consumers. Separately, growing NGL volumes support integrated midstream infrastructure, and Western Gateway could reshape western U.S. product-market competition. The most actionable distinctions are between commodity benchmarks and actual realizations, spot-exposed vessels and fixed charters, and infrastructure ownership versus unverified supplier exposure. Refining and tanker upside share a common normalization risk; they should not be treated as independent sources of protection. Impact assessments below concern earnings and cash flow, not valuation-based stock-return targets.
## COMPLEX REFINING: PRODUCT SCARCITY AND DISCOUNTED CRUDE CREATE A DOUBLE BENEFIT (READ-THROUGH 1)
**Affected companies:** Valero Energy (VLO: United States); Marathon Petroleum (MPC: United States).
**Direction and magnitude:** Positive; high refining-earnings sensitivity.
**Timing:** Immediate quarterly support, potentially extending through much of 2027.
**Observation:** Phillips 66 reported a realized refining margin of $38.00 per barrel, versus $24.08 in 2Q, alongside 98% utilization and a 41% distillate yield. Management reported declining gasoline and diesel demand but emphasized that “the response in demand isn’t enough to balance the market.” It also described increasingly attractive Canadian heavy-crude economics.
**Implication:** Complex refiners can benefit simultaneously from elevated diesel and jet realizations and discounted heavy or sour feedstocks. Conversion capacity, crude flexibility, export access and operational reliability determine how much of that spread becomes earnings.
Valero and Marathon have substantial exposure to these characteristics. Both produced more than 1 million barrels per day of distillates in 2025, making sustained changes in realized distillate margins economically significant even without additional crude throughput.
The important market distinction is that modest demand destruction does not necessarily imply imminent margin normalization. If unavailable capacity and disrupted trade constrain supply more severely, refining margins can remain strong while consumption declines. A demand-only bearish framework misses that mechanism.
**Catalysts and limitations:** Winter inventories, peer operating updates and realized capture are the immediate catalysts. Longer term, crude flexibility and logistics access remain advantages, but exceptional product shortages are cyclical.
Phillips 66’s entire beat should not be transferred to peers. Its discounted charters, WRB integration, blending activities and asset-specific optimization are not industry-wide benefits. Valero and Marathon must still execute through their own turnaround schedules. Their renewable-fuels businesses also face different feedstock and regulatory-credit economics.
## PRODUCT-TANKER SHIPPING: AVAILABLE VESSEL DAYS CAPTURE THE FREIGHT WINDFALL (READ-THROUGH 2)
**Affected company:** Scorpio Tankers (STNG: Monaco).
**Direction and magnitude:** Positive; high operating leverage for spot-exposed vessels.
**Timing:** Immediate through winter 2026–27; longer duration depends on disrupted trade routes.
**Observation:** Mandell highlighted Phillips 66’s freight advantage: “We added over 40 time-charter ships prior to all the problems in the market overseas. We have another 40 ships coming over the next two and a half years.” Management also described longer voyages, ship-to-ship transfers and constrained vessel availability.
**Implication:** Disrupted trade increases the vessel-days needed to transport each barrel. Effective shipping supply can tighten even when global petroleum consumption is flat or declining. Owners with available vessels capture higher freight rates, while much of their vessel operating expense remains fixed.
Scorpio is a direct product-market exposure. Its contemporaneous presentation disclosed preliminary 4Q MR bookings around $56,000 per day on 47% of the relevant pool/spot days. These partial-quarter bookings corroborate the physical tightness described by Phillips 66, although they are not full-quarter realized rates.
For scale, a $10,000-per-day improvement across 10 available vessels for 90 operating days generates approximately $9 million of additional TCE revenue before off-hire and other adjustments.
**Catalysts and limitations:** The rate achieved on remaining open days and expiring charter coverage drives near-term earnings revisions. Continued rerouting supports the duration of elevated earnings; normalized routes and additional vessel availability reverse that support.
There is no evidence that Scorpio is Phillips 66’s charter counterparty. Owners of vessels already fixed at lower rates do not immediately capture the spot windfall. The actionable distinction is available vessel days versus fixed employment, not simply tanker ownership. Current tightness is already visible in shipping disclosures, so this is fundamental confirmation rather than proof of an unpriced catalyst.
## CANADIAN UPSTREAM: WIDER HEAVY DISCOUNTS TRANSFER VALUE TO DOWNSTREAM BUYERS (READ-THROUGH 3)
**Affected company:** Canadian Natural Resources (CNQ: Canada).
**Direction and magnitude:** Negative for exposed heavy-oil realizations; moderate at the diversified company level.
**Timing:** Near-term sensitivity to heavy-crude availability, transportation and seasonal blending.
**Observation:** Mandell stated that “every dollar of widening of the WCS-WTI differential is worth $140 million for Phillips 66.” The company’s sensitivity framework identifies this as annual adjusted EBITDA. Management associated favorable heavy-crude economics with additional supply, freight conditions and seasonal factors.
**Implication:** The refinery’s cheaper feedstock is the producer’s lower realized price. At unchanged WTI, wider WCS discounts reduce revenue on exposed heavy-oil sales. Diluent purchases and transportation requirements create additional differences between benchmark prices and producer cash flow.
Canadian Natural’s own 2Q 2026 disclosure supports this exposure: the WCS discount averaged $14.62 per barrel, versus $10.19 a year earlier, with increased heavy-crude availability at the U.S. Gulf Coast among the explanations.
A sustained $5-per-barrel deterioration across 100,000 barrels per day of fully exposed sales represents approximately $182.5 million of annual revenue pressure before royalties, taxes and mitigation. This is an illustrative unit sensitivity, not a forecast for Canadian Natural’s entire production base.
**Catalysts and limitations:** Changes in Canadian differentials can affect producer realizations quickly. Persistent additional heavy-crude supply or transportation disadvantages would extend the effect.
This is not a blanket bearish oil-price call. Higher WTI can offset wider discounts, while Canadian Natural’s upgraded synthetic crude has different pricing exposure. Applying a WCS sensitivity to all oil-sands production would overstate the downside. The higher-conviction implication is a relative transfer of margin from exposed producers toward complex refiners.
## NGL INFRASTRUCTURE: PHYSICAL DEMAND SUPPORTS INTEGRATED SYSTEMS, BUT VOLUME IS NOT MARGIN (READ-THROUGH 4)
**Affected companies:** Targa Resources (TRGP: United States); Enterprise Products Partners (EPD: United States).
**Direction and magnitude:** Positive; medium-to-high multiyear relevance for Targa and moderate relevance for Enterprise’s broader portfolio.
**Timing:** Current throughput support, followed by commissioning and cash-flow conversion during 2027–29.
**Observation:** Phillips 66 reported approximately 4.6 Bcf/d of wellhead volumes, fractionation above 1 million barrels per day and 105% utilization at Freeport LPG. Baldridge emphasized that “there’s still strong demand for LPGs globally” and “strong pulls across the dock.” Management also described producers exceeding expectations and the use of third-party fractionation.
**Implication:** Growing gas and NGL production creates demand for gathering, processing, transportation, fractionation and export services. Integrated operators can earn fees at several stages of the same physical chain. The transmission depends on throughput, available capacity and contract terms rather than simply higher commodity prices.
Targa’s Permian processing footprint and downstream logistics fit this mechanism. Its Galena Park expansion targets export capacity of up to approximately 19 million barrels per month in 3Q 2027, compared with approximately 14 million currently. Phillips 66’s commentary supports the demand backdrop, without establishing Targa-specific utilization.
Enterprise’s disclosed 2Q results provide corroboration: gross operating margin increased $35 million across relevant export terminals and the associated pipeline, primarily through higher volumes, including the Neches River expansion.
**Catalysts and limitations:** Producer volumes, plant filling and export loadings are near-term catalysts. The more durable opportunity is converting committed infrastructure spending into recurring cash generation.
High utilization does not automatically reprice existing contracts. Phillips 66’s Midstream EBITDA declined sequentially despite strong physical activity, demonstrating that throughput and profitability can diverge. Its third-party fractionation providers were not identified, so no customer contract should be assigned to Targa or Enterprise. The positive read-through is demand visibility, not an invented award or immediate fee increase.
## REFINED-PRODUCTS PIPELINES: WESTERN GATEWAY OFFERS GROWTH, WITH CAPITAL REQUIRED BEFORE EARNINGS (READ-THROUGH 5)
**Affected companies:** Kinder Morgan (KMI: United States); HF Sinclair (DINO: United States).
**Direction and magnitude:** Positive longer term; moderate strategic significance, with a near-term funding burden.
**Timing:** Investment during 2027–29; operating contributions targeted from 2029.
**Observation:** Phillips 66 expects limited 2026 spending, engineering and right-of-way activity through 2027, and construction concentrated in 2028–29. Management identified 2028 as the peak spending year and described broader market access as a way to reduce refinery seasonality.
**Implication:** Kinder Morgan owns 35.1% and HF Sinclair 15% of Western Gateway. The approximately 230,000-barrel-per-day system connects inland and Gulf Coast supply with Arizona and California. Long-term transportation commitments support pipeline economics, while additional product-placement options can improve participating refiners’ netbacks and utilization.
Kinder Morgan contributes approximately $250 million in cash plus existing SFPP assets valued at approximately $1.5 billion. Its limited new-cash requirement is attractive, but the ownership interest is not being acquired for $250 million alone. Existing assets and their earnings are contributed, so incremental value must be measured against the cash flow retained under a no-project scenario.
HF Sinclair contributes approximately $750 million. Potential benefits include pipeline income and broader outlets for its refining platform. However, the funding requirement arrives before operations and can compete with other uses of cash. A 15% ownership stake does not establish that 15% of shipping capacity is allocated to its own barrels.
**Catalysts and limitations:** Permitting, capital-budget disclosure and construction execution are nearer-term catalysts. The principal earnings contribution remains longer duration.
The call confirms execution timing for an already-sanctioned project, not a new award. The approximately $5 billion project enterprise value is neither supplier revenue nor an owner-earnings forecast. No unnamed contractor or equipment supplier should receive the capital budget in a read-through model.
## CALIFORNIA REFINING: NEW SUPPLY CONNECTIVITY LIMITS THE DURABILITY OF SCARCITY PROFITS (READ-THROUGH 6)
**Affected company:** PBF Energy (PBF: United States).
**Direction and magnitude:** Negative relative to a no-pipeline scenario; moderate potential significance for California assets, limited immediate impact.
**Timing:** Primarily 2029 onward.
**Observation:** Western Gateway is intended to connect lower-cost supply with Arizona and California. Management separately discussed California-specification gasoline capabilities and the value of reducing seasonal product-placement constraints. It also described more pronounced gasoline-demand weakness on the West Coast.
**Implication:** PBF’s Torrance and Martinez refineries operate in a market where specialized fuel requirements and restricted supply routes can support scarcity premiums. Additional supply connectivity increases the ability to substitute external barrels for local production.
There are 2 channels. Deliveries into Arizona can displace California barrels previously serving that market, leaving more available locally. Reversal of the SFPP West Line can also move products toward Southern California. Torrance has the more direct geographic exposure; Martinez is exposed through broader California pricing and redistribution.
The critical valuation distinction is between near-term earnings and terminal value. California tightness can support current profits while the infrastructure response reduces their durability. Persistently weaker demand would make incremental supply harder to absorb, but the call does not establish a quantified long-term California demand forecast.
**Catalysts and limitations:** Permitting progress can influence valuation before deliveries begin. Meaningful operating competition requires completion, compatible specifications and actual transportation volumes.
The full 230,000-barrel-per-day system capacity is not incremental California supply. Arizona absorbs part of the flow, and downstream constraints matter. Refinery closures may create a deficit that the pipeline fills rather than a surplus. The high-conviction negative is a lower scarcity premium than under the no-project counterfactual, not a guaranteed collapse in PBF’s margins.
## PETROCHEMICALS: FEEDSTOCK ADVANTAGE SUPPORTS SPECIFIC OWNERS, NOT A BROAD SECTOR RECOVERY (READ-THROUGH 7)
**Affected companies:** Chevron (CVX: United States); Lotte Chemical (011170: South Korea).
**Direction and magnitude:** Modest positive for Chevron at group level; negative for Lotte’s naphtha-based operations, with portfolio offsets.
**Timing:** Current relative-cost advantage, with additional supply effects during 2027.
**Observation:** Phillips 66’s Chemicals pretax earnings were $311 million, approximately 77% above the prior year but 23% below 2Q. Management emphasized U.S. feedstock competitiveness and expected full operations at Golden Triangle Polymers and Ras Laffan in 2027. Lower polyethylene margins drove the sequential earnings decline despite slightly higher utilization.
**Implication:** Chevron owns 50% of CPChem. CPChem’s 51% interest in Golden Triangle and 30% interest in Ras Laffan translate into indirect Chevron interests of 25.5% and 15%. Successful commissioning therefore creates a direct ownership benefit from advantaged chemical production, although it is modest relative to Chevron’s consolidated earnings.
The negative competitive channel falls on higher-cost naphtha-based assets. Lotte’s Malaysian and Indonesian operations have identified naphtha-based business structures, while domestic restructuring reflects the need to improve basic-chemical competitiveness. These assets face feedstock-price volatility while competing against lower-cost ethane-based production.
Additional advantaged capacity can delay margin recovery for higher-cost producers even if demand improves. Lotte’s U.S. ethane operations, specialty businesses and restructuring provide important offsets, so the negative should not be applied uniformly to the company.
**Catalysts and limitations:** Feedstock spreads and operating rates drive near-term earnings. Commissioning, restructuring and changes in the industry cost curve are longer-duration developments.
Phillips 66’s Chemicals beat does not establish a broad polymer recovery. Gross project capacity cannot be attributed entirely to Chevron, and accounting earnings need not translate immediately into cash distributions during ramp-up. Ras Laffan also requires functioning logistics, not merely completed equipment, to realize its full earnings potential.
## AIRLINES: JET SCARCITY PRESSURES UNITED, WHILE DELTA HAS A PARTIAL PHYSICAL OFFSET (READ-THROUGH 8)
**Affected companies:** United Airlines Holdings (UAL: United States); Delta Air Lines (DAL: United States).
**Direction and magnitude:** Negative, potentially high fuel-cost sensitivity for United; negative fuel exposure but moderate relative insulation for Delta.
**Timing:** Immediate through winter 2026–27.
**Observation:** Mandell stated, “Jet is over diesel, which is a benefit to us,” while emphasizing low inventories and strong winter distillate economics. Phillips 66’s 41% distillate yield and efforts to maximize jet production demonstrate the profitability of product-specific scarcity.
**Implication:** Airlines purchase jet fuel, not crude. Delivered fuel costs incorporate the crude benchmark, jet refining margin and regional supply or transportation premiums. Stable or declining crude prices can therefore coexist with elevated airline fuel costs if the jet premium remains wide.
United consumed approximately 4.663 billion gallons in 2025. At that historical volume, a sustained $0.10-per-gallon increase represents approximately $466 million of annual gross fuel expense before changes in flying, efficiency, hedging or fares. This illustrates exposure, not a forecast earnings reduction.
Delta is an important exception to a uniform airline read-through. Through Monroe Energy’s Trainer refinery, it can recover part of the refining margin that otherwise flows to external suppliers. Its 2026 disclosures explicitly incorporate a refinery benefit into fuel economics. Higher refining margins therefore provide a physical offset to part of its airline fuel expense.
**Catalysts and limitations:** Delivered jet prices, regional premiums and airline fuel-cost updates are immediate catalysts. Restoration of refinery output and rebuilding of product inventories determine whether pressure persists.
Delta is not a net beneficiary of every fuel-price increase. Trainer has finite capacity, operating costs, maintenance requirements and regulatory obligations; it does not hedge all crude-price or geographic exposure. Similarly, United can offset higher fuel expense through fares, capacity discipline and efficiency. The higher-conviction relative conclusion is that jet-crack expansion is more damaging to an airline without an owned refining offset, all else equal.
Sure; everything is great.
Frontier Airlines reported a 71% increase in airfare for the third quarter to offset an 82% surge in jet fuel costs, averaging $67.82 per passenger.
-CNBC
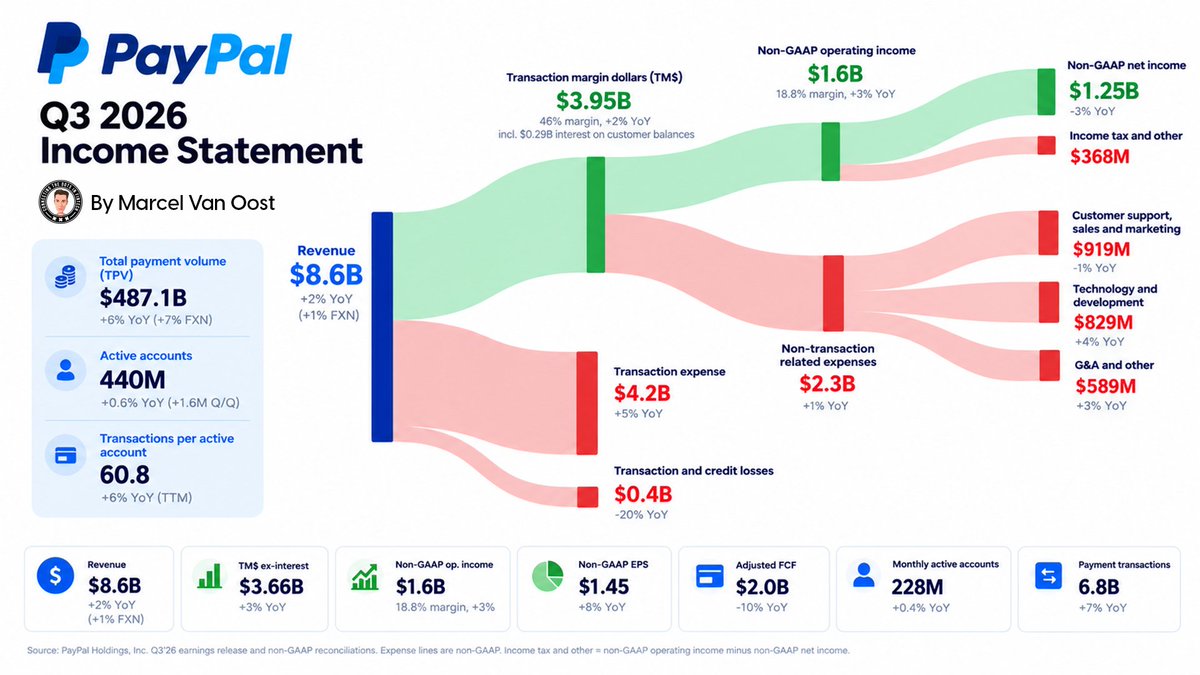
🚨 @PayPal just reported Q3 2026.
And Venmo is increasingly becoming the growth engine.
PayPal processed $487.1B in total payment volume during the quarter, up 6% YoY.
But underneath the headline numbers, the mix is changing:
→ @Venmo TPV +14% FXN
→ PSP TPV +8% FXN
→ Braintree delivered double-digit growth
→ Revenue reached $8.58B (+2%)
→ Non-GAAP EPS hit $1.45 (+8%)
→ Adjusted free cash flow came in at $2.0B
And one number really stands out:
Venmo now represents 20% of PayPal’s total TPV.
Meanwhile, the metric everyone keeps watching, branded checkout, grew just 1% FXN.
That makes four consecutive quarters of 1–2% growth.
Not exactly a comeback.
But importantly: it’s no longer deteriorating either.
There are signs of stabilization in the US, while BNPL and Pay with Venmo continue to perform strongly.
Then there’s the other side of the story:
PayPal’s restructuring is starting to show up in the numbers.
GAAP operating income fell 8% as restructuring and other costs reached $255M, versus $69M a year ago.
Yet underneath those costs, non-GAAP operating margin actually improved slightly to 18.8%.
So PayPal is effectively paying for the simplification now…
…while trying to build a leaner, more profitable business underneath it.
And it continues to return A LOT of capital:
$1.5B in buybacks this quarter.
$6B over the last 12 months.
Plus a $0.14 quarterly dividend.
My takeaway:
PayPal isn’t suddenly back in hypergrowth mode.
But Venmo is accelerating, Braintree is carrying volume, branded checkout appears to have found a floor, and the restructuring is beginning to reshape the business.
That makes the next few quarters very interesting.
I broke down the numbers, what changed and what I’ll be watching next here:
https://t.co/6OtjXk2Ked
What do you think?
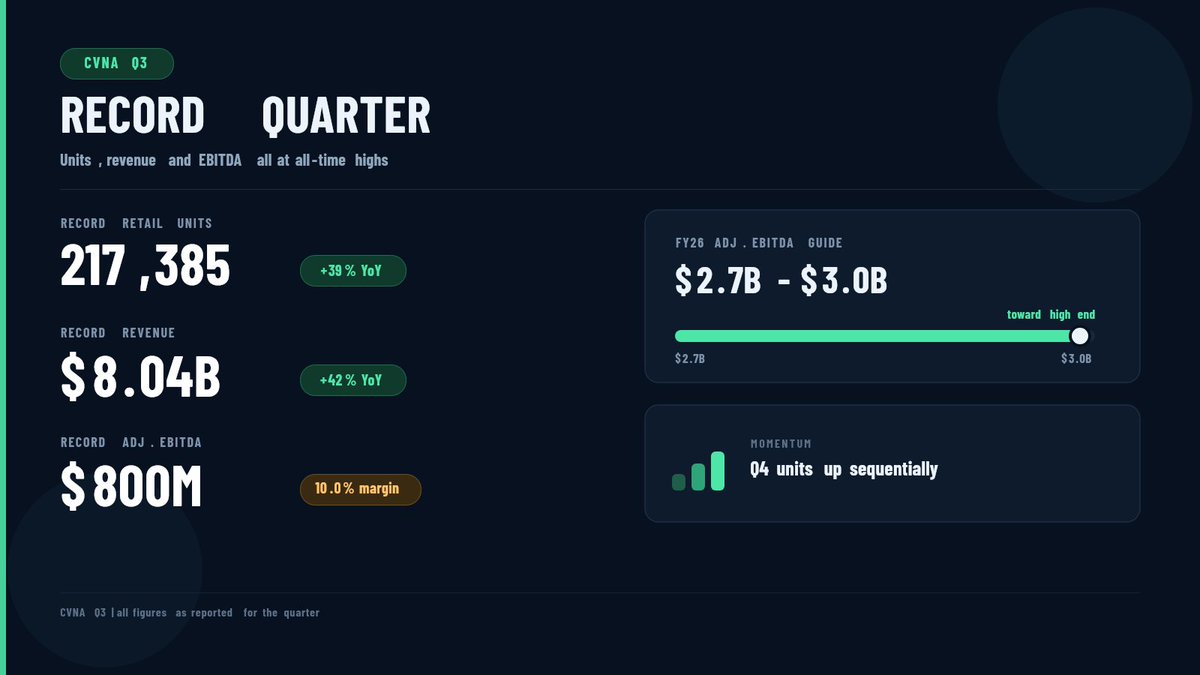
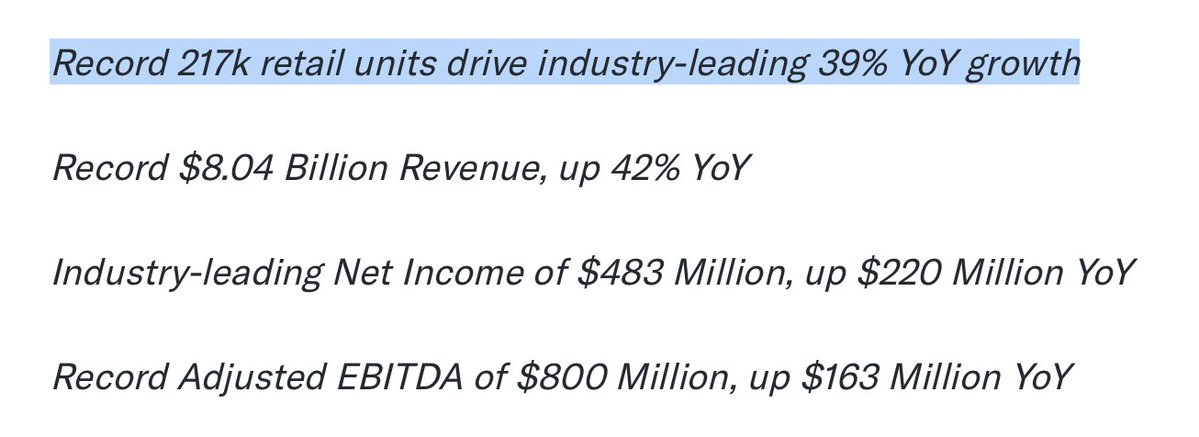
CVNA Q3: record 217,385 retail units (+39%); rev $8.04B (+42%); adj. EBITDA $800M (10.0%). FY26 adj. EBITDA toward high end of $2.7–$3.0B; Q4 units up sequentially.
@bjmtweets https://t.co/djPsNwafwh
Carvana sold 10% more cars than last quarter and 39% more than last year.
Mildly bullish report for $ROOT, who converts around 10-15% of Carvana car sales into Root insurance policy holders.
$GKOS .... We have more moon shots in the medical field... This one launched after hours....Glaukos beats by $0.57, beats on revs; guides FY26 revs above consensus (181.47 +0.30)
Reports Q3 earnings of $0.47 per share, $0.57 better than the FactSet Consensus of -$0.10, and revenues rose 58.0% yr/yr to $211 mln vs. $168 mln FactSet Consensus.
Key Financials
Non-GAAP diluted EPS: $0.47
Year-ago EPS: -$0.16
Revenue: $211 mln
Year-ago revenue: $133.5 mln
Gross profit: $179.866 mln
Management Takeaway
Management highlighted “record” Q3 2026 performance driven by strong global execution and two key growth drivers, iDose TR and Epioxa, and emphasized continued advancement of a robust pipeline of novel.
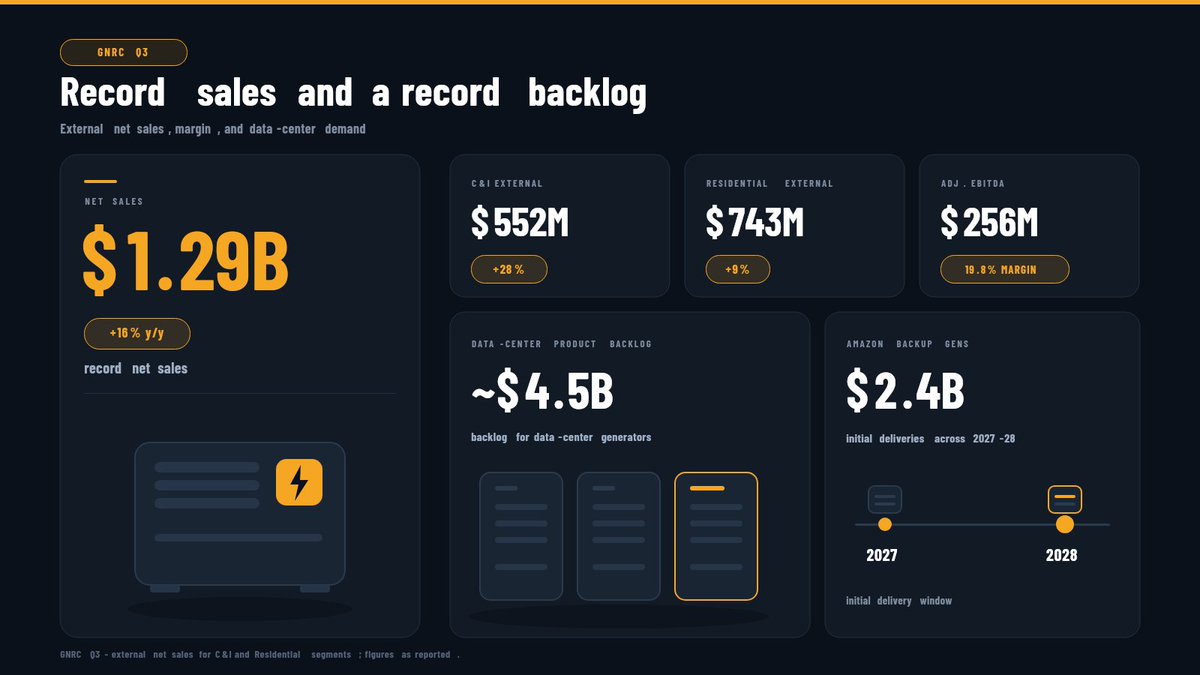
$GNRC nice print. Starting to show the combination we wanted: data-center growth and a healthier residential business. C&I sales +28%, Residential +9%, margins improved in both. More evidence that the new growth engine can add to the core instead of just offsetting weakness.
$MSFT earnings blew past estimates:
- Revenue was $92.3 billion +19% YoY
-Operating income was $45.9 billion up 21% YoY
- Net income $36.6 billion +32% YoY
- Azure +48% YoY (CC)
It will be interesting to see commentary on Copilot, as based on alt data, Copilot and Azure were really good!
Crystal Lake: 1.3B Peacock minutes in 11 days = Peacock’s #4 scripted original debut. Nielsen Wk of Oct 19: #3 streaming original & #3 first-season. ~398-min runtime ≈ 3.3M full views; 1.8B social impressions day 1.
@WolfmansGotNard https://t.co/fboA75rJKP
To put Crystal Lake's 1.3 BILLION minutes watched into perspective...
At the average US cinema ticket price of $12.27, that would equate to a hypothetical $40.2m at the box office!
BRINKER INTERNATIONAL $EAT Q1 2027 EARNINGS HIGHLIGHTS (28th October 2026)
🔹 Brinker International $EAT reported Q1 2027 total revenues of $1.48 billion, delivering 9.0% year-over-year growth and topping Wall Street consensus estimates of $1.46 billion.
🔹 Adjusted EPS reached $2.77 per share, up 44.0% year-over-year and beating analyst expectations of $2.45 per share.
🔹 System-wide comparable restaurant sales expanded 9.1% year-over-year, driven by strong traffic growth and continued casual dining market share gains.
🔹 Chili’s Grill & Bar segment revenue rose 11.0% year-over-year to $1.40 billion, supported by a 10.1% increase in comparable restaurant sales.
🔹 Maggiano’s Little Italy segment revenue slipped 5.0% year-over-year to $94.70 million due to persistent foot traffic headwinds.
🔹 Menu innovation momentum was bolstered by the highly successful national rollout of the Big Crispy Chicken Sandwich across Chili's locations.
🔹 Strategic footprint expansion included the acquisition of 12 franchisee-owned Chili’s restaurants during the first quarter.
🔹 Free cash flow surged 70.0% year-over-year to $105.70 million, compared to $62.20 million in Q1 FY26.
🔹 Capital deployment included $125.00 million in share repurchases, alongside redeeming $350.00 million in 8.25% senior notes to optimize cost of capital.
🔹 Full-Year FY27 revenue guidance was raised to $6.23 billion–$6.33 billion (vs. $6.29 billion consensus), up from the prior range of $6.15 billion–$6.27 billion.
🔹 Full-Year FY27 adjusted EPS outlook was upgraded to $13.30–$13.90 (vs. $13.28 consensus), up from $12.60–$13.40, incorporating the impact of a 53rd operating week.
🔹 Full-Year FY27 capital expenditures ($265.00M–$285.00M) and weighted average diluted share count (42.0M–43.0M) remain unchanged.
#Brinker #EAT #Chilis #Q12027 #EarningsReport #Restaurants #ConsumerDiscretionary #USStocks #Trading #Investing
NFL rush lead thru W7: Bijan Robinson 704 yds (131 att · 5.4 YPC · 4 TD). Walker III 701 in 6G (116.8 Y/G) — lead only 3. Cook 627; Gibbs 620. Bucs have held him in check (career-log ranks).
@Castricone https://t.co/wclnmRSLir
Bijan Robinson might be the best back in the NFL.
Leads the league with 704 rushing yards through 7 weeks. But the Bucs have held him in check.
He's played 58 career games so far.
Here's where his games vs Tampa Bay rank on his own career game log for rushing yards:
93 yds (19th)
63 yds (36th)
61 yds (39th)
34 yds (49th)
24 yds (56th)
3 yds (58th)
The 216-yard gap between Jaxon Smith-Njigba and second place on this list is bigger than the gap between Lamb and No. 19 on the list, Garrett Wilson (444 yards).
$CMG
Chipotle earnings miss estimates, but same-store sales increase for third straight quarter
- Chipotle Mexican Grill reported same-store sales growth for the third quarter despite consumer fears about foodborne illness.
- The chain missed Wall Street expectations for earnings per share.
- For the full year, Chipotle reiterated its previous forecast that its same-store sales will increase by a low single digit percentage.https://t.co/FUrrM56XIa