$BTC Bitcoin
Currently the most likely scenario is to range a bit here till 2026 to kill entirely the daily downtrend and eventually to pump to 98K-103K marking a major top at these levels between the 12th and 18th of January.
The bottom should be either in or mostly swept at 80K.
This pump if happens should represent a nice opportunity to derisk and protect capital as we are already in the crypto autumn scenario and even though the bull run and the super cycle are still in play, bullish trend on HTF and ATH are extremely unlikely for the next 6-12 months now when the uptrend is not active anymore on the weekly and biweekly timeframes.
On the daily you can see how the downtrend is wearing off as CS has entred the candles.
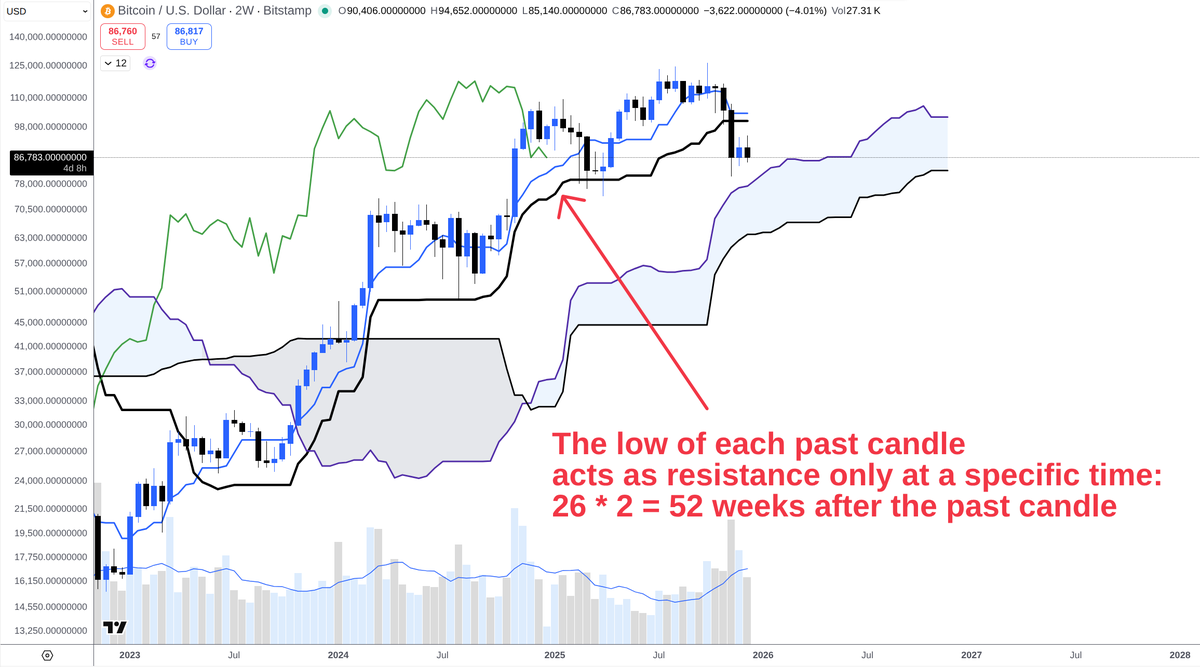
The best timing clarity comes from the biweekly timeframe where you can see how CS keeps respecting the candles with perfect accuracy on each specific date.
That's the reason why for the last two months ~92K was such a strong resistance.
Based on this timing model (past candles at CS acting as resistance):
- $91,351 is resistance till the 21st of December
- $89,164 is resistance between the 22nd of December and the 4th of January.
- the same resistance is elevated to $96,168 between the 5th and 18th of January which makes it the most likely period to attack higher prices like the obvious resistance of 98K (and probably a wick to the higher one at 103K).
As this is a 2W timeframes wicks in the resistance are not uncommon and significant in terms of price but it's very hard to close and hold above the resistance.
That's why for the next 2.5 weeks it will be very hard to start a rally above 89K.
Which gives time for the daily chart to range around and "kill" the thick bearish kumo by SSB going down and SSA going up. That's why if the bottom indeed is in the most likely scenario for the rest of the year is chop or very slight pushes to the upside which end up being rejected.
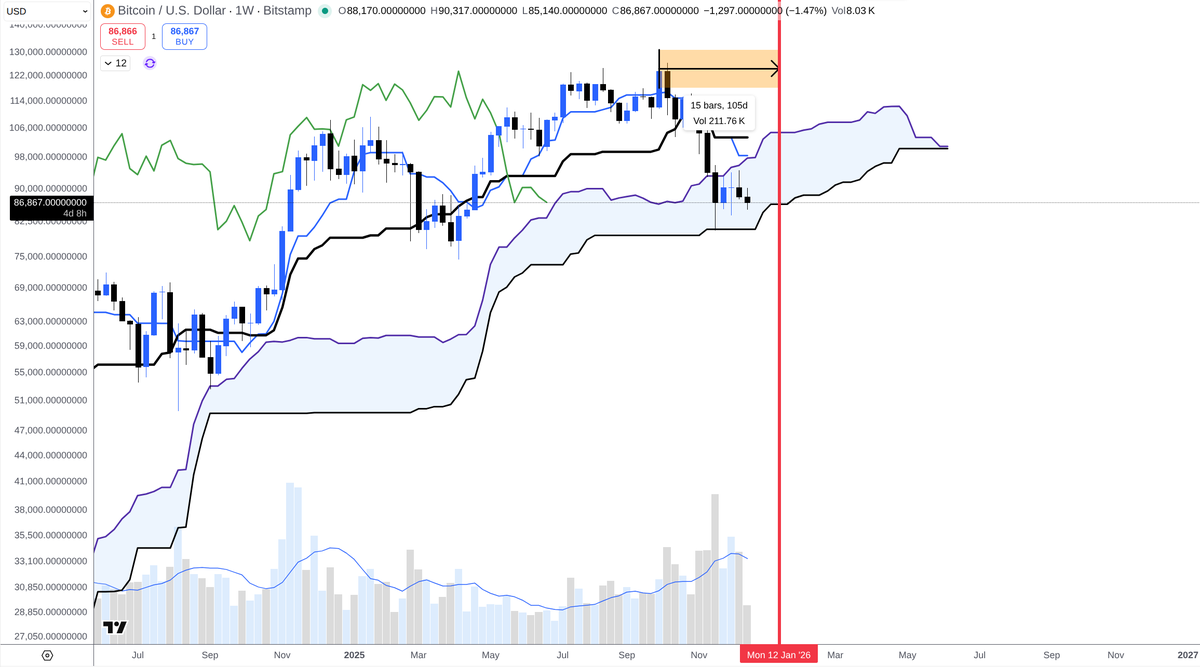
Zooming in further in this period which we take from the 2W timeframe, using the weekly cycles, you can see 15 (Kihon Suchi 17-2) weeks for a potential cycle high from ATH between the 12th and 18th of January which makes this week the perfect candidate for this major top scenario.
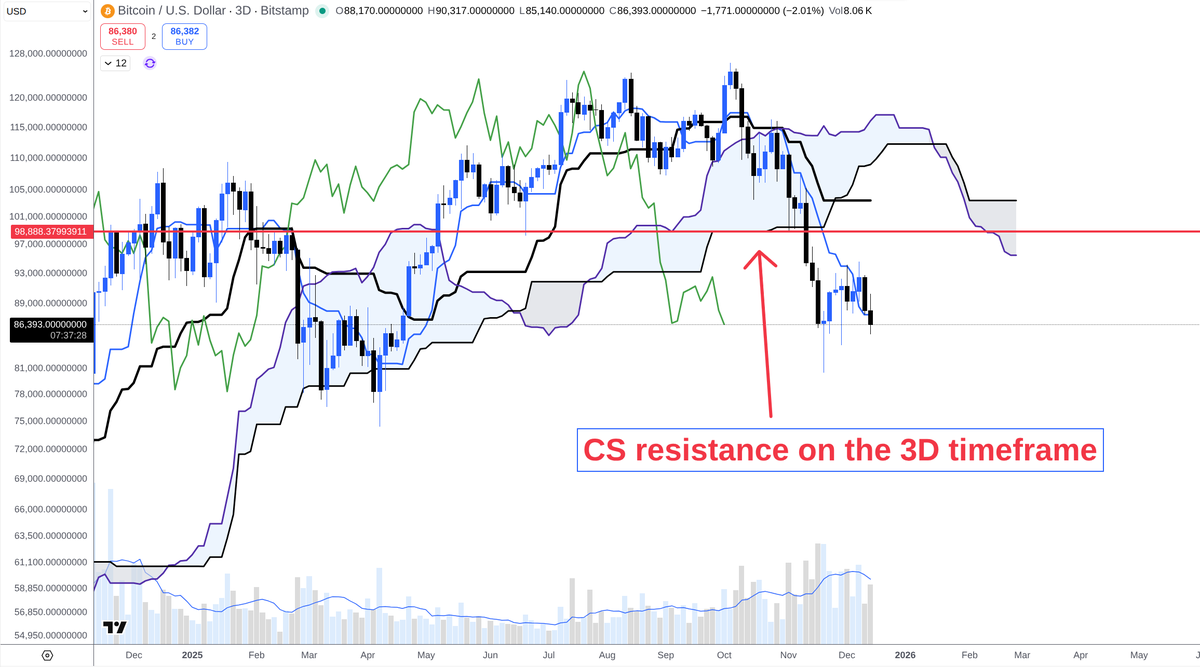
It's important to understand that while 103K and 98K are both key levels (98.4K and 103.4K to be precise), 98K is the SSB resistance at CS on the 3D which is very rarely touched during a downtrend and if it is normally it's very short-lived. So 103K should be significantly harder to come than 98K and if it comes it should be a pretty quick wick.
If the daily local bottom at 85K doesn't hold the next HTF levels are the weekly SSB at around 80K and biweekly SSA currently at around 77K and that is certainly possible.
But it seems like too many people are bearish and expecting 7 handle which makes this scenario less likely along with the daily chart losing bearish momentum.
@Sykodelic_@benjamincowen “IF ALTS/BTC have not bottomed, this means BTC.D has not topped and would be going higher.”
@benjamincowen shares that BTC.d could have topped already and could get a higher low mainly because eth would get a lower high on its pair while alts get a lower low. Makes sense to me
@CredibleCrypto If we do make it to the red zone as we are closely approaching would that negate any buying the dip opportunities and any dips are are now too risky to buy?
@CredibleCrypto few tweets back you said there’s no reason to go below 68k so going below there would invalidate the pull back then back up before the drop and just head to below 49k?