Robotics Is About to Change Everything 🤖
Here is the Complete Robotics Stack to find the next 10X Investment 👇
Medical Robotics:
• Surgical & Clinical Robotic Systems:
$ISRG $SYK $MDT $GMED
Drone & Unmanned Systems:
• Autonomous Aerial Systems
$AVAV $KTOS $RCAT $ONDS
Autonomous Vehicles:
• Self Driving Cars, Trucks, and Robotaxis
$TSLA $GOOG $UBER $MBLY
Humanoid Robotics:
• General Purpose Robots at Service
$TSLA $XPEV $AGLT
Warehouse & Logistics Automation:
• AI Driven Fulfillment and Distribution
$SYM $ZBRA $TER $AMZN
Industrial Automation:
• Factory Robots and Automated Systems
$TER $ROK $ABB $HON
AI Robotics Compute & Software:
• The Brain Powering the Robots
$NVDA $AMD $PLTR $PATH
Sensors & Motion Components:
• Vision, LiDAR, Motors and Actuators
$CGNX $OUST $NOVT $AMBA
Power & Critical Minerals:
• Batteries, Rare Earth, and Materials
$ALB $MP $USAR $ENS
Physical AI is the next major evolution of artificial intelligence. I’d start paying attention now, before the market fully takes shape.
How are you positioned? 👀
I keep studying interesting microcap stocks every single day. Been doing this for the last 13 years.
Today, I have almost 850 stocks in my watchlist. And this didn't happen overnight. It took me almost a decade of reading, tracking and studying companies to build this watchlist.
I genuinely believe microcap investing is all about reading endlessly and knowing the stories of as many companies as possible.
You never know which company you studied 3-4 years ago suddenly starts doing something interesting.
The more companies you know, the easier it becomes to connect the dots when an opportunity comes.
Sharing 10 interesting microcaps from my watchlist:
• Earkart
• Repono
• Aveer Foods
• Suba Hotels
• Telge Projects
• Glen Industries
• Kerala Ayurveda
• Galaxy Supermarket
• Dhampure Speciality
• Vision Infra Equipments
I might keep sharing more companies from my watchlist regularly.
Keep reading. Keep studying. Keep building your watchlist.
That's probably the biggest edge a microcap investor can build over the years.
Disclosure: I'm not holding any stake in any of the above companies. This is purely for study purposes and not an investment recommendation.
There is an unmistakeable vibe humming under the hood for Indian manufacturing. Frm AI to Defence, the sandpile is getting larger, we can see an avalanche of growth v soon. Beyond blackpills, somethng (nice) is brewing.
My piece in @timesofindia today..
https://t.co/xcnnT8mJjR
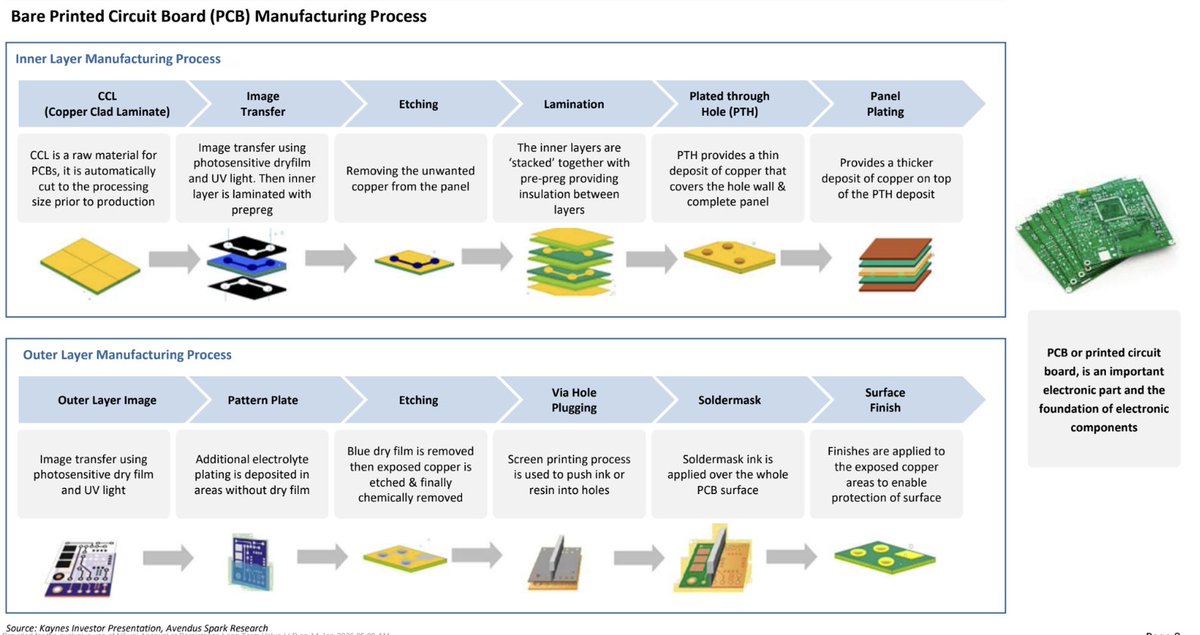
The bare board is where India's import substitution story lives
India assembles electronics at scale. But it barely makes the PCB, the board every device sits on. Only 1 in 10 PCBs used in India are made in India. The rest come from China. This gap is the real import substitution opportunity.
The market is worth about Rs 400bn today. It should reach Rs 790bn by 2030, growing at 12% a year. Multilayer boards make up 60% of it, HDI another 25%, flex and the rest fill the last 15%. The value and the moat sit in multilayer and HDI. Anyone serious about this space has to compete there, not at the bottom.
First support comes in to boost local manufacturing is from favourable policy. Customs duty on bare PCBs rose from 10% to 15%. China and Hong Kong now face a 30% anti dumping duty for five years. Behind this sits the Rs 760bn Semicon India programme, funding fabs, OSAT, and design at half the project cost. The government wants local value addition in electronics to nearly double, from 18 to 20% today toward 38 to 40%. A components scheme is also being framed, with PCBs high on the list.
But the base is small. All twelve tracked domestic makers together earned only Rs 34bn in FY24, against a Rs 400bn market. Margins vary sharply too. Micropack runs a 27% EBITDA margin, Circuit Systems 23%, Ascent Circuits 20%. Genus Electrotech and AT&S India barely clear 1 to 2% PAT. Avary and Meena Circuit post outright losses. The spread shows how much scale and product mix decide everything.
Also new capacities are coming fast. Kaynes Semicon is building 25,000 sqm a month in Mysuru, a Rs 14bn bet due in 2026. Ascent Circuits is spending Rs 6.5bn at Hosur, live in 2025. Bonfiglioli, BPL, T Works with Qualcomm, and Schneider Electric are all adding lines too.
And just before calling this a gold rush, look at the global leaders. Samsung Electro Mechanics, Unimicron, Zhen Ding, and TTM Technologies mostly posted mid single digit PAT margins over the last decade, with modest growth and rising debt. AT&S even posted a group loss last year. Bare PCB manufacturing is capital heavy and cyclical. Real pricing power only shows up in HDI and IC substrates. This business rewards patience, tough customer qualification, and staying power through the cycle
India is also building the backend chip ecosystem in parallel. Tata is spending Rs 270bn on assembly and test in Assam. CG Semi and Micron are building OSAT in Sanand. Tata with Powerchip is putting Rs 910bn into a fab in Dholera.
The setup is clear. A Rs 400bn market doubling by 2030. A 90% import gap. Tariff protection. A subsidy cheque. Demand and policy both point the same way. What is not proven yet is execution: can these lines run at world class yield and cost
One key thing to track here is not just the capacity announcements but how this capacity gets utilised with top teir OEMs
Disclaimer - not a recommendation to buy/sell
5.7x interest coverage. ✅
0.46 debt-to-equity. ✅
1.65x fixed asset turnover. ✅
The 3 metrics proving India Inc’s next mega capex deployment is coming in powered by their clean balance sheets' power.
While headline quarterly PAT grabs attention, the real structural story is the quiet transformation of balance sheets across non-BFSI corporates.
Over five years of commodity swings, supply disruptions, and macro noise, financial discipline has created the cleanest corporate baseline in over a decade:
* Debt Servicing Cushion: Interest coverage (EBIT/interest cost) sits at a 4-year peak of 5.7x.
* Aggressive Deleveraging: Debt-to-equity has cooled to 0.46, with Net Debt to EBITDA down to 1.4x.
* Utilization Meets Peak Margins: Fixed asset turnover near 1.65x combined with near-peak EBITDA/PAT margins gives corporates both the incentive and capacity to build fresh assets.
* Credit Channels Firing: Banking commentary confirms credit demand is broadening, driven jointly by large corporates and MSMEs across the supply chain.
Unlike the debt-fueled cycle of 2008–15, sectors like Auto, Steel, and Cement have expanded capacity ahead of demand while strictly controlling leverage.
Where is the capital heading?
This cycle extends far beyond traditional heavy assets:
* Power grid, energy storage, renewables & nuclear
* AI infrastructure, data centres & digital tech
* Indigenous defence platforms & high-tech mobility
* Organised services footprint (Hospitals & Hotels).
Clean balance sheets have shifted India Inc from shock absorption to driving sustained long-term growth.
@FinMinIndia@CimGOI@minmsme@NITIAayog
#IndiaInc #Capex #IndianEconomy #Manufacturing #MSME #Macroeconomics
Source: Sai Prabhakar Yadavalli | @businessline
By far the best book written on investing in India.
And by a big fat margin.
No other book come close to it.
Surprisingly, not many have heard or read it.
Goldman calls the next mega trend the rising demand for the cables and optics that connect chips inside racks and racks to each other for AI computing.
In the bull case, the value of that wiring grows 9x in three years, from $15B to $154B, driven by the rollout of Nvidia's Rubin Ultra.
What's interesting is that this can also lift demand for copper, because copper cables stay in use for connecting chips over short distances. In that scenario, the copper backplane market grows 4.6x by 2028, from $4.5B to $20.5B
AI is one of the new sources of copper demand.
If you want me to send the full optical networking report, drop a + in the comments.
Wave 1: 0 ➔ 25% of global iPhones in 5 years. 📲 🌎
Wave 2: ₹1.27 Lakh Cr on the table for core silicon manufacturing.
🎯: 10% of global semiconductor packaging by 2030. 𓇲
The playbook behind India's next manufacturing leap 👇
1/ Capturing Mature Nodes:
While the US, TSMC, and Korea race for sub-7nm AI chips, mature nodes (28nm+) power 70% of global semiconductor volume: from automotive and 5G to power grids and consumer hardware. India is building the dominant, cost-competitive alternative to China in this high-volume workhorse segment.
2/ Capital Deployed & Key Projects:
Momentum has shifted from policy announcements to active construction:
• Semicon 1.0: ₹76,000 Cr launched initial OSAT/ATMP plants.
• Semicon 2.0: ₹1.27 Lakh Cr (₹1,27,500 Cr) fresh outlay expanding incentives across fabs, packaging, equipment, and R&D.
• Major Investments:
A. Tata & PSMC Fab (Gujarat): ₹91,000 Cr
B. Tata OSAT (Assam): ₹27,000 Cr
C. Micron ATMP (Gujarat): ₹22,500 Cr
D. CG Power / Renesas (Gujarat): ₹7,500 Cr
E. HCL-Foxconn OSAT (UP): ₹3,700 Cr
F. Kaynes Semicon (Gujarat): ₹3,300 Cr.
3/ Targets & Timelines:
A. 10% Global OSAT Share by 2030 in a $55B–$70B market.
B. $150B Domestic Market by 2030, driven by EV, industrial, and AI booms.
C. Commercial Fab Production: Tata’s Dholera plant targeting 50,000 wafer starts/month.
D. OSAT First: Lower capex and 18-month execution timelines provide fast cash flow while 3–5 year fab projects mature.
4/ Why It Matters: Tech Sovereignty
A. Supply Chain De-risking: Gives global OEMs a proven 15–20% lower-cost alternative to China.
B. National Security: Protects critical defense, telecom, and energy infrastructure from geopolitical blockades.
C. Domestic IP: Provides domestic fabless design startups local packaging and foundry access without sending IP overseas.
The Bottom Line: India is moving from assembly to core silicon, laying the groundwork for the next global high-tech manufacturing hub. 🇮🇳
The best is yet to follow.
Long India. Long Manufacturing. Long @makeinindia !
@AshwiniVaishnaw@GoI_MeitY@SemiconIndia
By @surajeetatbs
#Semiconductors #MakeInIndia #TechPolicy #SupplyChain #IndustrialGrowth #Manufacturing
A Short Thread on company starting it's hypergrowth phase.
Stock Name : KRM Ayurveda
Sector : Integrated Ayurveda (Hospitals + Products)
Potential Multibagger : A 5x+ candidate over 2-3 years
Market Cap : ~700 cr approx
CMP : ~330 approx
PE : 28 (after today's result)
FY26 Revenue : 102 cr
FY26 PAT : 20 cr
Q1 FY27 PAT : 9 cr
Till now KRM was just another story,
"The next Jeena Sikho."
With today's June quarter, the story has started to look more credible and is becoming execution.
Remember : All big moves start with a small move.
A 9 cr quarterly PAT, at a 5-quarter-high margin, with the bed engine only just switching on.
This might be that small move.
The hypergrowth phase isn't ending. It's just beginning.
Q1 FY27 (June quarter) :
Revenue : 32 cr (up 31% YoY)
EBITDA Margin : 38.2% — highest in 5 quarters
PAT : 9.08 cr (up 124% YoY, up 16% QoQ)
Other income in this : just 0.54 cr
Read that last line again.
This is REAL operating profit. Not treasury income on IPO cash. Not a one-time property sale.
The business is actually seeing operating leverage.
And the engine?
Services (hospital) revenue : 23.9 cr this quarter.
Up 110% YoY. Up 46% QoQ.
The hospital business is nearly doubling every single year.
Now here is why I think the hypergrowth is JUST starting 👇
The whole game is BEDS x OCCUPANCY x MARGIN.
Beds :
FY26 exit : ~250
Today : ~350 (103 beds already added in FY27)
Company's own number : these 103 beds = ~25 cr of incremental annualised revenue potential.
25 cr. From one small batch of beds. On a 102 cr base. Let that sink in.
Occupancy (let me be precise here) :
Mature hospitals are ALREADY running 90%+.
New hospitals open at ~35-40% and ramp fast — company's model : ~60% by month 2-4, ~80% by month 6-8.
Blended FY26 was : ~69%.
Mature sites at 90%+ means the beds genuinely FILL UP — new beds are not a gamble, they follow a tested ramp.
So the engine is simple : keep adding beds, and each new batch becomes a reliable revenue layer as it matures. Growth from here is a BED-ADDITION story, not a filling-empty-beds story.
My estimated projections (my own estimates, NOT company guidance)
Also 350 beds operational and another 100 beds about to be signed and coming up in next 1 month as per interaction with management sometime back.
So they will already be at 450 beds before Q2 ends.
Another 200 beds likely to be added by end of FY27( if not more). Supported by IPO proceeds to setup hospitals and clinic.
Management conservative guidance of 50% growth in FY27 actually does look conservative.
Need to keep tracking bed additions.
Realistic Assumption : 600 beds by end of FY27, 1100- 1200 beds by end of FY28. Margins held roughly at current 30-35% (conservative — they have been expanding).
FY27E — scaling quarter by quarter :
Q1 (actual) : Rev 32 / PAT 9
Q2 : Rev ~38 / PAT ~10.5
Q3 : Rev ~45 / PAT ~12.5
Q4 : Rev ~53 / PAT ~15
FY27E Total : Rev ~165 cr / PAT ~46 cr
Revenue up ~62% | PAT up ~130% YoY
FY28E — beds 600 to 1100, blended occupancy holding ~70%+ as new beds mature :
Q1 : Rev ~60 / PAT ~17
Q2 : Rev ~68 / PAT ~19.5
Q3 : Rev ~78 / PAT ~22.5
Q4 : Rev ~89 / PAT ~26
FY28E Total : Rev ~295 cr / PAT ~83 cr
Revenue up ~78% | PAT up ~80% YoY
Now let's look at the valuation part :
Today : PE 28.
On FY27E PAT ~46 cr -> forward PE ~15.
On FY28E PAT ~83 cr -> forward PE ~8-9.
A company growing topline 60-70% and bottomline 80%+, trading at 8-9x FY28 earnings, is not expensive.
It is CHEAP. (If it delivers) on the promise.
Give it even a 30 PE on FY28 earnings (a fast grower deserves that) = ~2500 cr market cap.
From ~700 cr today.
That is 3.5x in 2 years. And I haven't even added the re-rating.
More importantly there is a peer and template to look at that has been through similar cycle in recent past.
The Jeena Sikho template :
JSSL went 460 beds (FY23) -> 2300 beds.
100 cr revenue -> 800 cr.
SME -> NSE/BSE mainboard.
Market cap re-rated to ~7400 cr.
#KRM
This is the ninth company in my Precision Engineering series — Standard Engineering Technology Limited — and this one just split itself into two completely different businesses overnight
Every company I've covered in this series does one thing exceptionally well. This is the first one that decided doing one thing well wasn't enough — and bolted on an entirely new, unrelated growth engine in the same quarter I'm covering it.
Let me walk you through why.
A company that just became two companies
Standard Engineering Technology formerly known as Standard Glass Lining Technology Limited, is headquartered in Hyderabad.
Historically, they've built end-to-end, concept-to-commissioning turnkey process equipment for Pharma, Agrochemical, and Specialty Chemical industries.
In Q1 FY27, they officially transformed into what they call a "Two-Engine" platform by expanding into AI Data Center Power & Cooling Infrastructure.
Two completely different customer bases, two completely different growth stories, under one roof.
Engine 1 — Core Precision Engineering (Pharma, Chemical & Semiconductor)
-->Turnkey equipment — SETL manufactures 70-80% of project products in-house, across 180+ product lines: glass-lined reactors (AE, BE, CE series), Agitated Nutsche Filter Dryers, shell and tube heat exchangers, conical dryers, receivers, and specialized pumps.
-->Manufacturing footprint — 9+ facilities in Hyderabad, spanning 700,000+ sq. ft.
-->Marquee clients — long-standing relationships (3+ years with 13 of their top 20 clients) with Tier-1 pharma names like Aurobindo, Sun Pharma, Cipla, Dr. Reddy's, Granules, Laurus Labs, and Biocon.
-->A strategic Japan bet — they acquired an initial 19.19% equity stake (₹71.5 Cr outlay) in GL Hakko, Japan, with an agreement to expand to 51.07% over 3 years. GL Hakko brings 70 years of Japanese glass-lining IP, including low-leaching, high-corrosion glass technology needed for semiconductor-grade electronic chemicals and spark-testable conductivity glass reactors.
Engine 2 — AI Data Center Infrastructure, through GScale Energy
This is the genuinely new part. SETL acquired a controlling 51% equity stake in GScale Energy Private Limited via a ₹190 Cr Phase I investment (₹125 Cr cash + ₹65 Cr share swap, out of an approved ~₹500 Cr program) — fully self-funded, zero debt.
-->Leadership — led by Kasu Brahma Reddy, with 25+ years in critical data center infrastructure, having already delivered 486 MW and with 1 GW+ under execution.
-->Power Solutions (7 product lines) — power distribution units, backup power systems, and high-density switchgear built for GPU-scale loads.
-->Cooling Solutions (5 product lines) — liquid cooling infrastructure, Cooling Distribution Units, pipe manifolds, and skids engineered for 10-250 kW per rack AI workloads.
-->Turnkey build & modular ePODs — prefabricated, factory-tested modular units using Design for Manufacture & Assembly, cutting data center build timelines from 24-36 months down to just 15-18 months.
-->A giga-watt scale factory — a 400,000 sq. ft. facility in Hyderabad, going live in November 2026.
In plain terms: AI data centers generate enormous heat and need serious power management. SETL is now building the physical infrastructure — power systems and cooling — that keeps those data centers running, and prefabricating it so it can be installed faster than a traditional build.
The moat — four pillars, spanning two very different businesses
-->High in-house value-addition (70-80%) — unlike engineering contractors who source parts externally, SETL fabricates most of the equipment itself. That secures higher margins, shortens project timelines, and ensures tighter quality control.
-->Proprietary Japanese semiconductor glass IP — the GL Hakko partnership lets them build low-leaching glass-lined reactors for electronic-grade ultra-pure chemicals, meeting parts-per-trillion leaching limits required by semiconductor fabs. That's an extraordinarily tight purity standard most competitors can't touch.
-->The "skip-start" advantage in AI data centers — instead of spending 3-5 years on organic R&D and vendor qualification from scratch, acquiring GScale gave SETL immediate access to hyperscaler relationships. They already have active inquiries with 3 global MNCs and 2 Indian data center majors.
-->Off-site prefabrication (DFMA) — building power and cooling skids in the factory rather than on-site means data center operators can install equipment as civil work progresses, cutting time-to-market by roughly 50%.
Now the numbers — and both engines are already showing up in the P&L
Q1 FY27 versus Q1 FY26 and Q4 FY26:
-->Total Income: ₹178.2 Cr → ₹230.9 Cr → ₹252.2 Cr. Up 41.5% YoY, up 9.2% QoQ.
-->Revenue from Operations: ₹173.1 Cr → ₹226.7 Cr → ₹247.7 Cr. Up 43.1% YoY, up 9.3% QoQ.
-->Operating EBITDA: ₹34.7 Cr → ₹35.7 Cr → ₹44.1 Cr. Up 27.3% YoY, up 23.5% QoQ.
-->EBITDA Margin: 19.5% → 15.5% → 17.5%. Down 196 bps YoY, but up 202 bps QoQ — a margin that dipped and is now actively recovering quarter over quarter.
-->PAT: ₹21.1 Cr → ₹21.1 Cr → ₹26.7 Cr. Up 26.6% YoY, up 26.9% QoQ.
-->PAT Margin: 11.9% → 9.1% → 10.6%. Down 126 bps YoY, up 148 bps QoQ.
The pattern here is consistent — YoY margins are down slightly (likely from integrating the new GScale business and its associated costs), but the QoQ trend shows clear recovery already underway within the same quarter.
The multi-year trend shows a company that's been compounding steadily long before this pivot
-->Revenue: ₹240 Cr (FY22) → ₹498 Cr (FY23) → ₹544 Cr (FY24) → ₹614 Cr (FY25) → ₹774 Cr (FY26).
-->EBITDA: ₹42 Cr → ₹88 Cr → ₹101 Cr → ₹120 Cr → ₹138 Cr.
-->PAT: ₹25 Cr → ₹53 Cr → ₹60 Cr → ₹69 Cr → ₹83 Cr.
-->Working Capital Days: 174 → 160 → 139 → 131 → 123.
That working capital trend is worth pausing on — a steady, multi-year improvement from 174 days down to 123 days. This is a company that's been disciplined about cash conversion well before anyone was talking about AI data centers.
The balance sheet — clean, and funding a big bet without leverage
-->Zero net debt — Total Debt/Equity at 0.10x, with net debt at zero.
-->Cash reserves — ~₹105 Cr in cash and bank deposits.
-->Working capital continued improving — 108 days in Q1 FY27, down from 174 in FY22. Receivable days at just 72. Management is targeting overall working capital below 200 days for FY27.
They're funding the entire ₹500 Cr GScale expansion program through internal accruals, without adding debt.
Where the growth goes from here — and management just raised the bar mid-year
-->Engine 1 (Pharma/Chem) target: ~₹1,200 Cr revenue, up 40-50% YoY, backed by a ₹1,400 Cr order book.
-->Engine 2 (GScale AI Data Centers) target: ~₹250 Cr revenue, from just ~4 months of commercial operations in FY27.
-->Consolidated FY27 revenue guidance: upgraded to ~₹1,450 Cr, up from an earlier ₹1,200 Cr target — a real, mid-year upward revision, not a maintained number.
-->Margin guidance: 17-18% for the core business, and a notably higher 23-25% for GScale's data center products.
The order book and near-term catalysts
-->Unexecuted core order book: ~₹1,400 Cr post Q1 FY27 billing, split roughly 50% CDMO pharma clients and 50% general pharma/chemical.
-->GScale order target: ₹250 Cr in revenue bookings by Q4 FY27, scaling toward a ₹400 Cr+ annual run-rate in FY28.
-->Semiconductor glass reactors — commercializing high-purity, low-leaching glass-lined reactors in Q2 FY27 for Indian chemical suppliers building semiconductor-grade facilities.
-->Export expansion — launching conductivity glass reactors and shell/tube glass heat exchangers into US and European markets in H2 FY27.
Why I'm sharing this
I'm not calling this risk-free — running two structurally different businesses (specialized process equipment and AI data center infrastructure) under one roof is genuinely harder to execute than staying focused on one, and GScale's ₹250 Cr FY27 target comes from just 4 months of operations, which is a short track record to extrapolate from.
I'm sharing it because a debt-free balance sheet already funding a ₹500 Cr expansion, a mid-year guidance upgrade rather than a maintained one, and an immediate skip-start into hyperscaler relationships via acquisition rather than years of cold-start R&D are exactly the traits my checklist is built to catch.
Not investment advice. Curious how you'd weigh this dual-engine bet against the single-focus companies I've covered earlier in this series — let me know below
#Investing #IndianStockMarket #SmallCap #PrecisionEngineering #StandardEngineeringTech
Detailed Thread for all companies presented in @ias_summit 🧵
1. QPower
- At the Q4 FY26 call, management
described FY27 as a year where BESS order intake would convert to revenue, with billing from the first order expected by the last quarter of the year. Q1 FY27 revenue was INR 233 cr, up 31.66% YoY, with three quarters remaining (SQL).
Disc: Not a Buy/Sell Recommendation.
#ias2026
IPO DEEP DIVE | 4 IPOs Under the Lens
Sharing BusinessLine’s detailed analysis of four upcoming IPOs:
1️⃣ LEAP India
2️⃣ Dhoot Transmission
3️⃣ Milky Mist Dairy Food
4️⃣ Molbio Diagnostics
Business, Financials, Valuation, Strengths & Risks — A closer look before you invest.
Read the analysis. Do your own research. Don’t invest merely on IPO hype.
09-08-2026
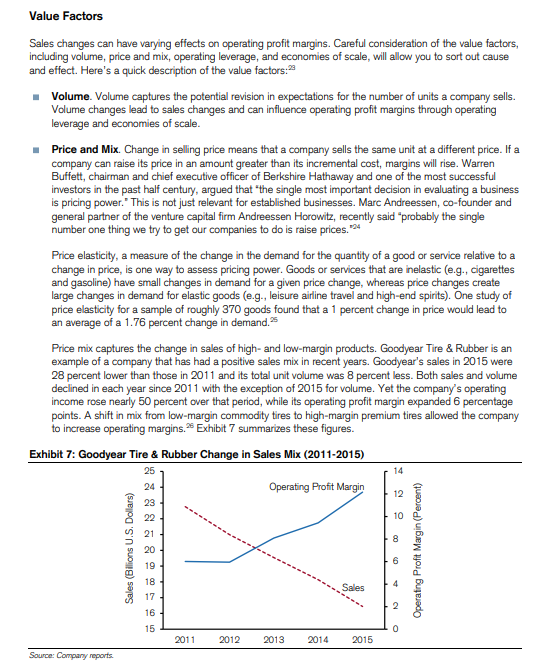
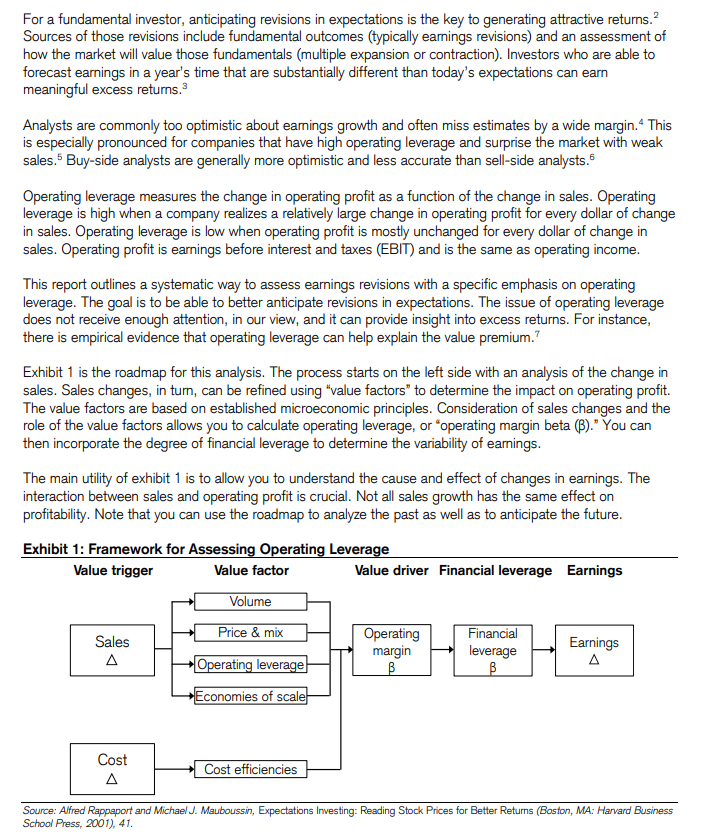
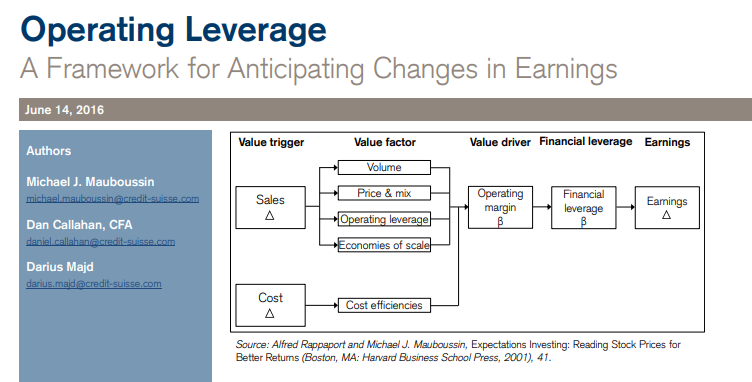
"Operating Leverage" (Mauboussin)
I would tell my 23 year old self, "spend the next 6-12 months on this topic and nothing else, until u have become fluent in this math."
1/6
fluency may be overstating it, there are just odd exponential effects at work here that are hard for our brains to grasp
sort of like compound interest, we just have a very hard time with non-linear growth rates, and here, u have many of them colliding with one another
the core math:
rev dollars split into px/vol, how those flow thru various cost structures (fixed vs. variable), incremental margins + quickly triangulating $1 of revs --> how many cents of ebit --> how many cents of eps
and then layer financial leverage onto operating leverage -- the way a chg in EBITDA affects equity value on a net cash B/S vs a 4x levered one
study all this until the dots start to align, its way more important than twtr celebrity gossip
"ooo leopolds wedding...ooo down to $10B AUM" like dog what sorority kitchen is this
but the combo of op lvg + fin lvg, the lollapalooza effect, is prob the most important shit to understand tbh in all of L/S equity
there's always spare $$ laying around, its always mismodeled, there's a sustainable source of edge in unit economics + fixed cost absorption + the fact that most equity guys don't really understand cap structure
2.
because op lvg + financial leverage...sales growth of 4% vs 5% can knock 1/3rd off the mkt cap in a highly-levered + high DOL cost structure
1% revs --> 10% EBITDA --> 15% EPS...capitalize the lost EBITDA @ 8x or wherever it trades, to get the delta in EV, and remember that the debt burden doesn't change...the mkt cap does.
say $250m debt + $250m equity = total capitalization
the lost EBITDA @ 8x, say $125m of EV
that $250m of debt is still $250m...those r contractual claims, they dont move with earnings, equity is residual and equity is guaranteed nada
so that $125m in EV comes right off the $250m in mkt cap.
bang, 50% equity decline
3.
u learn this shit by building a billion models and just tinkering with px/vol + cogs/opex items, and watching what happens to ebit and eps
lots of consumer, industrials, tmt, this is the math ur doing
a cruise ship, an airline, a semiconductor co, Mattress Firm...almost all these costs are fixed, the "factory" must run regardless of units moved
and u add in that these are cyclical as fuck, so u have a 3x lollapalooza at econonomic inflection points
sales up 20%, costs stay the same, ebitda up 50%, EPS 60%, levered out the ass so the levered equity stub 2-3x's in a month
so if I was coaching my 23 year old self, I'd say pull up 4 LLMs, chatgpt, claude, grok, gemini, and make ur way thru this mauboussin piece line by line, hitting LLMs until u understand everything
4.
and then after that, build 10 models of the nastiest high-fixed cost businesses u can think of, historicals going back 20 years, and study the way the quarterly P&L shifts around cyclical peaks and troughs
do a few shitco retailers, a casino, a hotel, an iron ore smelter, an offshore driller, a theme park, and hell, u may as well throw in micron
"why does this trade at 5x eps"
bro what do u think these companies do lol
"AI technology"
no. they make widgets
these are all widget companies
go stare at the quarterly P&L from 3-4 years ago, and ask grok if its good when u print a negative 30% gross margin
and then study what happens when negative gross profit dollars hit a fixed cost base
good intro to operating deleverage
5.
u know u are in high DOL shitco paradise when ur just staring at a P&L, like, "how did sales go down 5% and EPS went from $2 dollars to negative $12?"
but I'm saying, this is where all the $ is, always...a shitco that printed x margin 20 years ago, can print that same margin today, and its never in ests despite that its the exact same business.
its all factories, boxes, stores, a pile of heavy assets...a dollar of revenue is gonna be damn near a dollar of net profit, in both directions, because the costs dont move
every co has new fancy multiple-accretive recurring revenue stability streams to reduce the lumpiness of earnings
and then it doesn't snow in Colorado, Vail's revenue goes down 3% and their EBITDA goes down 40%
and u realize that u overpaid for a levered shitco multiple arbitrage roll-up, and that ski resorts have always been shitty low-multiple businesses
this is what buffett talks about with "when good mgmt meets shitty economics, the economics always win"
"our revenue is high-quality, because of our new loyalty program which grew 30% y/y"
like...u sell furniture over the internet
or the economy rolls over, the loyalty program isnt so loyal, Vegas traffic and casino revenues get cut in half, and EPS goes negative
the operating leverage inherent in a business model is not something that changes, thats why this has to be mastered and is worth the time
6.
go stare at HTZ financials. play around with tiny changes in capacity utilization or pricing, and u will see why it chapters out every 5 years
or AMC, see what a dollar of revenue lollapalooza's itself into. u can prob trace 1 movie ticket --> $10m of market cap
thats what happens when 1 rev dollar = 1 net profit dollar, and when current net profit = 1
1 + 1 = 2
aka, your earnings doubled
if it weren't for that torque, where the equity is effectively just a call option, the mkt cap of this should be about $2B lower (current: $2.3B)
"wait, how can an enterprise have market cap and be worthless at the same time?"
u will learn, my friend
its called
"schrodinger's shitco"
END
if I find other reading on this I'll post it but I don't think u can read ur way thru this, this is 100% modeling intensity
just staring at cogs/opex items trying to figure out wtf all this shit is and how it moves around
labor, R&D, are these fixed, are these variable, what about stock based comp, what about depreciation, how are each of these connected to revenue dollars, assuming they are at all, and why do people care about shit that isnt on the income statement like "inventories?"
after 10 or so years, u will arrive at the truth
"wow, 99% of GAAP accounting is complete fucking fiction."
and thats when u say, u know what, I'm just gonna find stocks that are already going up and buy the ones with sweet sounding names
50% long "SharkNinja" and 50% long SpaceX into the lock-up expiry
buffett spoke of this
good luck modeling
https://t.co/M1kbbBqXHd