🚨 $TSM has gone through some wild price swings in the last couple of days.
It jumped from around $417 to nearly $449, showing real short-term strength. That momentum is tied to confidence in AI chips, semiconductor demand, and advanced manufacturing.
Then it pulled back to $427, but bounced right back toward $447. 📈
What does that tell us?
Buyers are still jumping in when prices dip. The bullish setup isn't fully broken yet.
First key support to keep an eye on:
$432–$439
That's a short-term floor. If it dips here and steadies, it might be worth watching for a small position. 🎯
If that zone holds, this could just be a normal pullback after a big rally, keeping $TSM in reach of that $449 high.
But if that support breaks, the short-term picture could shift.
Next solid support:
$419–$422
If it falls below the first area and heads toward $419–$422, that suggests more selling pressure and a bigger correction ahead. Given $TSM's size, that could mean more losses. ⚠️
This isn't just about $TSM.
The whole U.S. market is struggling. $SPX, $NDX, and $QQQ are all pulling back, and tech and semiconductor stocks are cooling together.
Keep watching $SMH too.
If that ETF keeps weakening, money is still leaving the semiconductor space, which could weigh on $TSM short-term.
But if $QQQ and $SMH find their footing, $TSM could see fresh capital flow in. 📊
Long-term thesis for $TSM hasn't changed.
They're still the top player in advanced chip manufacturing, working with big names like $NVDA, $AAPL, $AMD, $AVGO, and $QCOM.
AI chips, data centers, high-performance computing, smartphone chips, and process upgrades are all long-term tailwinds. 🚀
My simple take:
Don't chase after a big move.
Watch the $432–$439 zone closely.
If it holds, it's a potential watch area for small entries.
If it breaks, next real support is $419–$422.
And check $SPX, $NDX, $QQQ, and $SMH for stability.
$TSM's long-term story is still solid, but short-term moves have to deal with market pressure, sector cooling, and profit-taking.
⚠️ This is just analysis, not advice. Do your own research.
🚨 $MSFT just entered a pretty important technical zone.
In the last couple of days, Microsoft jumped hard from around $412 to nearly $466.
It was a solid rally, no doubt.
But after that fast move, the stock pulled right back and is now sitting near $427. 📉
Here's what that tells me:
Long term, it's still strong, but short-term profit-taking is definitely happening.
The support level I'm watching is $419–$423. 🎯
That's where buyers need to step in.
If $MSFT holds there, the bullish setup stays alive and we might see another bounce.
But if that support breaks, the market could start expecting more downside, especially with the broader market already cooling.
Right now, it's not just about Microsoft.
The whole U.S. market is slowing down.
$SPX is under pressure.
$NDX is pulling back.
$QQQ is losing steam.
Mega-cap tech isn't moving in a straight line anymore.
The reason is straightforward:
After a big rally in AI and major tech names, the market needs to digest valuations, earnings expectations, and risk appetite.
For $MSFT, the long-term story is still really strong.
Azure cloud growth.
Enterprise AI.
Copilot.
Office ecosystem.
Windows.
LinkedIn.
Enterprise software.
These aren't short-term buzz. These are real business drivers for Microsoft's long-term growth. 🚀
But even great companies pull back.
That's why I wouldn't blindly chase $MSFT right now.
My plan is simple:
Watch $419–$423.
Watch $SPX, $NDX, and $QQQ.
Watch if buyers defend support.
Watch if volume picks up.
If support holds, this could be a great pullback opportunity.
If support breaks, short-term risk goes up.
Long term, I'm still bullish on $MSFT.
Short term, patience beats emotions.
⚠️ This is just market analysis, not financial advice. Do your own research.
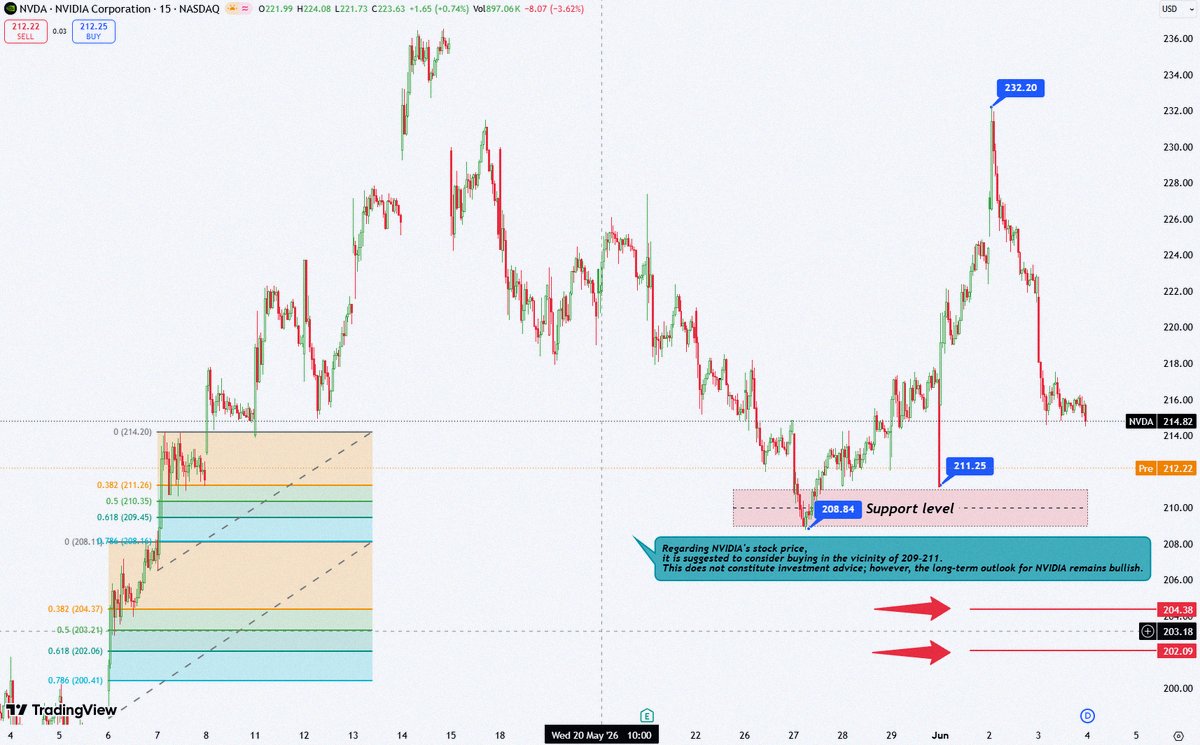
🚨 $NVDA just got way more volatile over the last two days.
It shot up from around $211 to nearly $232 — a really strong short-term move. But then it dropped just as fast and is now sitting near $214. 📉
Looking at the charts, the key support to watch is $209–$211.
That's where the rally started, and it's a critical level bulls need to defend. 🎯
If $NVDA holds around $209–$211 and buyers come back, the uptrend stays intact and we could see another bounce.
But if it breaks below that, short-term sentiment could get worse, and the stock might drop further. With Nvidia’s huge market cap, any big pullback also means a big loss in value. ⚠️
This isn’t just about $NVDA.
The whole U.S. market is under pressure. $SPX, $NDX, and $QQQ are all pulling back, while tech and semiconductor stocks are falling together.
$SMH is another ETF to watch. If it keeps weakening, that means money is still leaving semiconductors, which could weigh more on $NVDA soon.
If $QQQ and $SMH can settle down, $NVDA has a better chance of drawing money back in. 📊
This drop might come from several things:
• Weakness in $SPX
• Pressure on $NDX / $QQQ
• Short-term cooling in $SMH
• Profit-taking after the big rally
• AI leaders digesting high valuations
• Lower risk appetite overall
But long-term, Nvidia’s fundamentals haven’t changed. AI computing demand, data center growth, strong GPU supply-demand, enterprise AI adoption, and chip industry upgrades still support the big picture for $NVDA. 🚀
My take is simple:
Don’t blindly buy right now.
Watch the $209–$211 support area closely.
Keep an eye on $SPX, $NDX, $QQQ, and $SMH for signs of stability.
If support holds, a bounce is possible.
If it breaks, short-term risk goes up.
The long-term story is still solid, but short-term action has to respect the broader pullback and sector pressure.
⚠️ Just market analysis, not financial advice. Do your own research.
@BlockheadsMedia 538 as support makes sense, but that 546 area is where things got sticky last time. If it clears that with volume, then maybe I'll pay attention.
$AMD looks like it's building momentum again 🚨📊
It bounced hard from 524 on the 15-min chart and ran up to 546.
Buyers are clearly still in the game.
At 542, it's near the recent high, so I'm not chasing.
First level I'm watching is 538.
If it holds there, the short-term
$ASML is testing a pullback at a high level, not breaking down. 🚨📊
The 15-minute chart shows a solid rally from 1,588 up to 1,742.7.
That was a big move for a semiconductor equipment stock.
But after hitting that peak, $ASML dropped back to about 1,726, putting buyers to the test.
First level I'm watching is 1,722–1,723.
If it holds there, the short-term setup still looks good.
Real key support is 1,710–1,711.
As long as we stay above that zone, the bullish short-term trend stays intact.
If price can get back above 1,732–1,735, momentum starts picking up again.
But it's not just ASML.
When this stock moves, the market usually turns to the whole semiconductor equipment and AI chip supply chain:
$AMAT — semiconductor equipment
$LRCX — etch and deposition tools
$KLAC — inspection and process control
$TSM — advanced chip manufacturing
$INTC — foundry expansion
$NVDA — AI GPU demand
$AMD — AI accelerators
$AVGO — custom AI chips and networking
$MRVL — AI networking and custom silicon
$MU — AI memory and HBM
$SMH $SOXX — semiconductor ETFs
My take is simple:
AI doesn't end with GPUs.
AI demand pushes into advanced nodes, EUV tools, fabs, wafers, inspection, memory, networking, and the whole semiconductor capex cycle.
That's why $ASML matters.
It's one of the biggest bottlenecks in advanced chip manufacturing.
The chart is still constructive.
The pullback is testing support.
The semiconductor equipment theme is still alive.
But after a strong move, entry price is key.
I want confirmation, not emotional chasing. 📊🔥
Not financial advice.
$KLAC is flashing a strong signal in the semiconductor equipment space today. 🚨📊
This isn't just a single stock moving up.
Looking at the 15-minute chart, KLA broke out of the 1,900–1,948 range, regained momentum, and shot up to the 2,087–2,103 high zone.
To me, that means buyers are coming back into semiconductor equipment stocks.
Right now, $KLAC is still hanging near the top, but after a move like this, I'm not going to chase it emotionally at the peak.
The levels I'm tracking:
First support: 2,071–2,072
If it pulls back and holds here, the short-term bullish setup stays solid.
Key support: 2,051–2,052
As long as $KLAC sits above this, the broader short-term trend holds up.
If $KLAC keeps holding near the highs, eyes might shift to the whole semiconductor equipment and AI chip supply chain.
Stocks to keep on the radar:
$ASML — advanced lithography
$AMAT — semiconductor process equipment
$LRCX — etch and deposition tools
$TSM — advanced chip manufacturing
$INTC — foundry expansion
$NVDA — AI GPU demand
$AMD — AI accelerators
$AVGO — custom AI chips and networking
$MRVL — AI networking and custom silicon
$MU — AI memory and HBM
$SMH $SOXX — semiconductor ETFs
My take is straightforward:
AI demand isn't just about GPUs.
It flows into fabs, wafers, inspection, process control, equipment, memory, networking, and the entire semiconductor infrastructure.
That's why $KLAC matters.
KLA isn't just an equipment stock.
It's a key player behind advanced chip yield, inspection, and manufacturing quality.
Strong chart.
Strong sector signal.
Strong AI supply-chain read-through.
But after a big jump, entry price still matters.
I'd rather wait for support confirmation than chase near the high. 🚀📊
Not financial advice.
$AMAT is looking really strong in the semiconductor equipment space. 🚨📊
On the 15-minute chart, Applied Materials broke out of that 448–454 range, took back 463–464, and ran straight to 491.
That's a solid momentum move.
Now it's trading near the highs around 489–490. Buyers are still in charge, but after a run like this, I wouldn't jump in blindly at the top.
First level I'm watching is 480.
If $AMAT pulls back and holds around 480, it shows buyers are still backing the breakout.
Key support is 473.
As long as it stays above 473, the short-term bullish setup is still good.
But it's not just about one stock.
When $AMAT moves like this, the whole semiconductor equipment and AI chip supply chain starts getting attention.
Names to keep an eye on:
$ASML — EUV lithography
$LRCX — etch and deposition gear
$KLAC — inspection and process control
$TSM — advanced chip production
$INTC — foundry expansion
$NVDA — AI GPU demand
$AMD — AI accelerators
$AVGO — custom AI chips and networking
$MRVL — AI networking and custom silicon
$MU — AI memory and HBM
$SMH $SOXX — semiconductor ETFs
Here's my take:
AI chip demand isn't just about GPUs.
It flows into fabs, tools, wafers, advanced processes, memory, networking, and the whole semiconductor cap-ex cycle.
That's why $AMAT matters.
Strong chart.
Strong sector rotation.
Strong AI infrastructure signals.
But after a big move, entry price still matters.
I'd rather wait for a clean dip near support than chase the strength at the top. 🚀📊
Not financial advice.
$TSM is sending a clear signal to the AI chip industry. 🚨📊
On the 15-minute chart, TSMC made a big jump from the 417 range and moved up to 449.
After that, the price eased back, found support, and is now sitting at around 444–445.
This doesn't look like a real breakdown.
It seems more like a retest of a high level after a strong breakout.
Here are the key levels I'm watching:
Support: 443.7
If $TSM stays above this, short-term momentum stays positive.
Key support: 440.9
If it breaks below, the recovery structure weakens.
But the bigger picture is this:
$TSM isn't just another stock.
It's the core of the AI chip manufacturing cycle.
When $TSM moves, the whole semiconductor chain pays attention:
$NVDA — AI GPUs
$AMD — AI accelerators
$AVGO — custom AI chips + networking
$MRVL — AI networking + custom silicon
$AAPL — Apple Silicon
$QCOM — mobile + edge AI chips
$ASML — EUV lithography
$AMAT — semiconductor equipment
$LRCX — etch and deposition tools
$KLAC — inspection and process control
$SMH $SOXX — semiconductor ETFs
My take is simple:
If $TSM holds support, it signals AI chip demand is still going strong.
This isn't just about TSMC's chart.
It's a read on the whole AI chip supply chain. 🚀📊
Not financial advice.