Tech is not the underdog anymore. It is the dominant global industry and the central cultural force of our time, as @lessin has pointed out.
To work in tech today, in the broad macro sense, is no longer inherently rebellious. It is often the act of someone joining the societally dominant consensus.
Within tech, of course, there are still relative Davids and Goliaths. Seed-stage startups, Fund 1 VCs, boutique law firms, and upstart service providers are still the pirates. Big Tech, Big VC, Big Law, Big Anything are the navy.
So if you work at Google, Sequoia, or Cooley, you are working in the dominant industry in society at the *macro* level, and at a dominant, safe institution at the *micro* level. That is two layers of establishment safety!
And yet many people in Big Tech and Big VC still narrate themselves as rebels. As entrepreneurs. They feel misunderstood by the media, by Washington, by the system.
But this is mostly self-flattering mythology.
I will say that, as ever, it is more fun to be a pirate than to join the navy...
The potential US labor force has gotten *a lot* more racially diverse this year, according to @BLS_gov
stats. (What happened is that demographic changes recorded in the 2020 Census were finally incorporated into population estimates.) https://t.co/i3nuhn3B6s
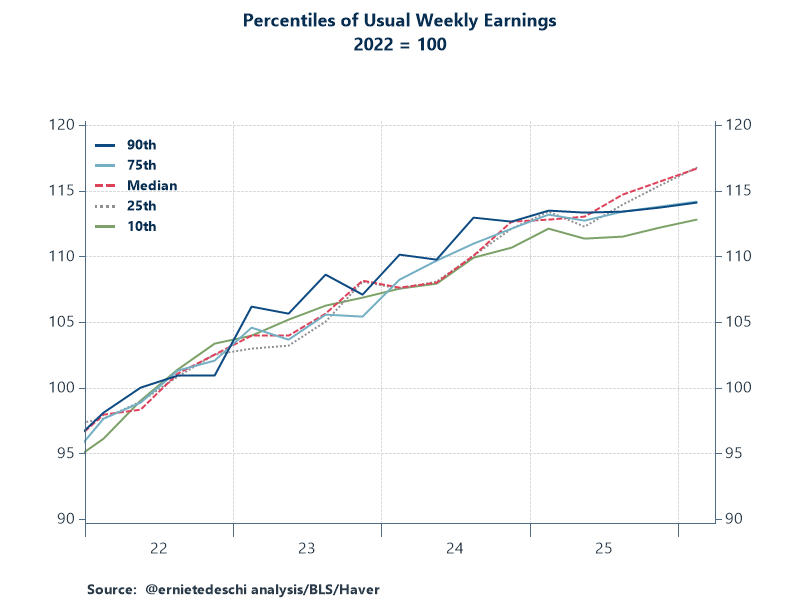
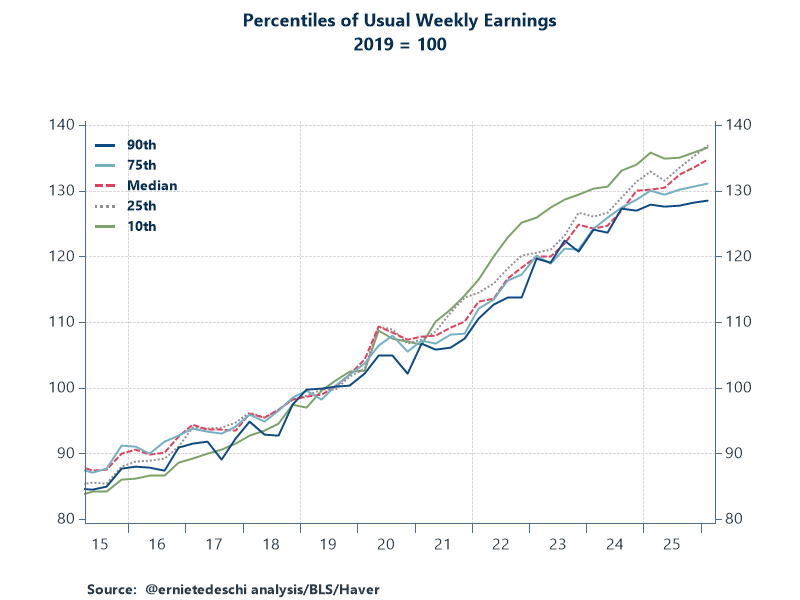
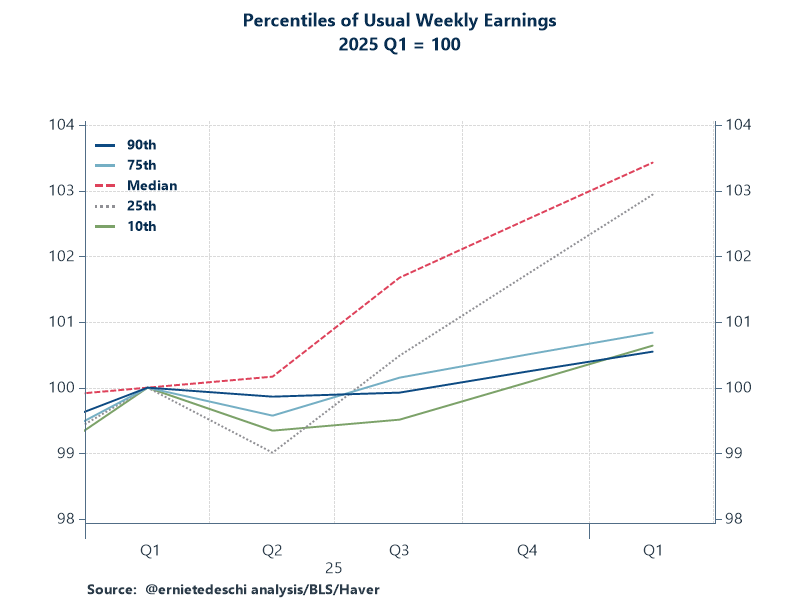
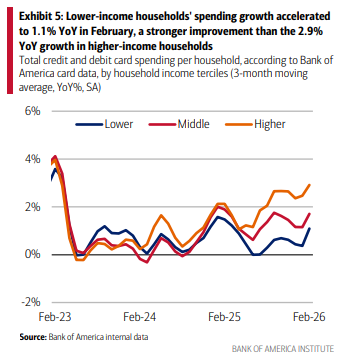
New data on 2026 Q1 usual weekly earnings in the US have implications for the K-shaped debate.
1. Measured against pre-pandemic (1st chart), the bottom has done meaningfully better on nominal wage growth than the top.
2. Over last few years (2nd) or last year (3rd), the story is messier, with the middle & 25th percentile doing best but the very bottom & very top lagging.
3. These are household survey data, the best source for distributional & demographic cuts of wages but substantially noisier than measures of wages from the establishment/payroll survey.
4. This is all nominal; ideal would be to inflation-adjust by price indices that vary by income. This is much harder to do well than you might think, and the best effort to date from @BLS_gov currently only runs through the end of 2023.
NEW from me: The 2026 version of my chart book. It is 132 pages of charts that defy liberal & conservative conventional wisdom about spending, taxes, deficits, debt, and even presidential fiscal performance.
A full career of federal budget expertise in picture form. 🧵
Finance's share of the US economy grew rapidly in the 1980s and 1990s but hasn't much since. @foxjust wonders whether that's good or bad https://t.co/wqg2GZSIXs
Good thread & column by @foxjust. My take:
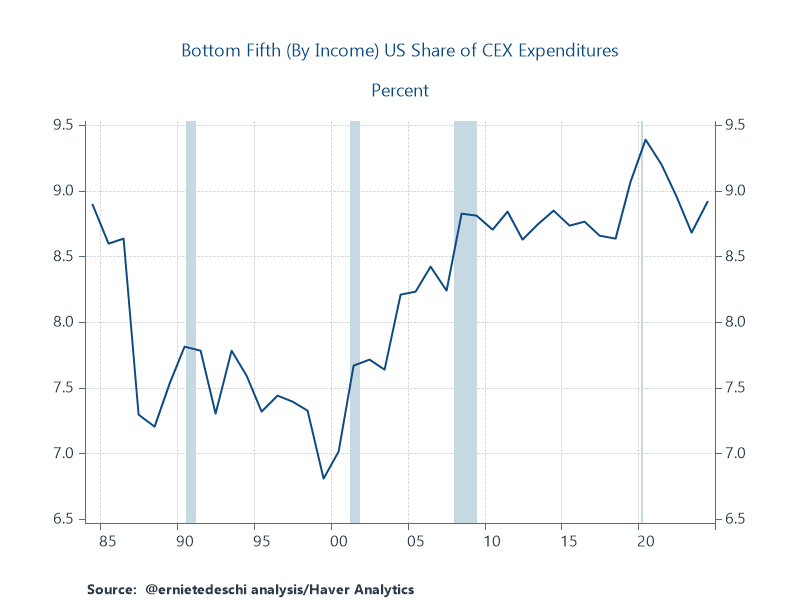
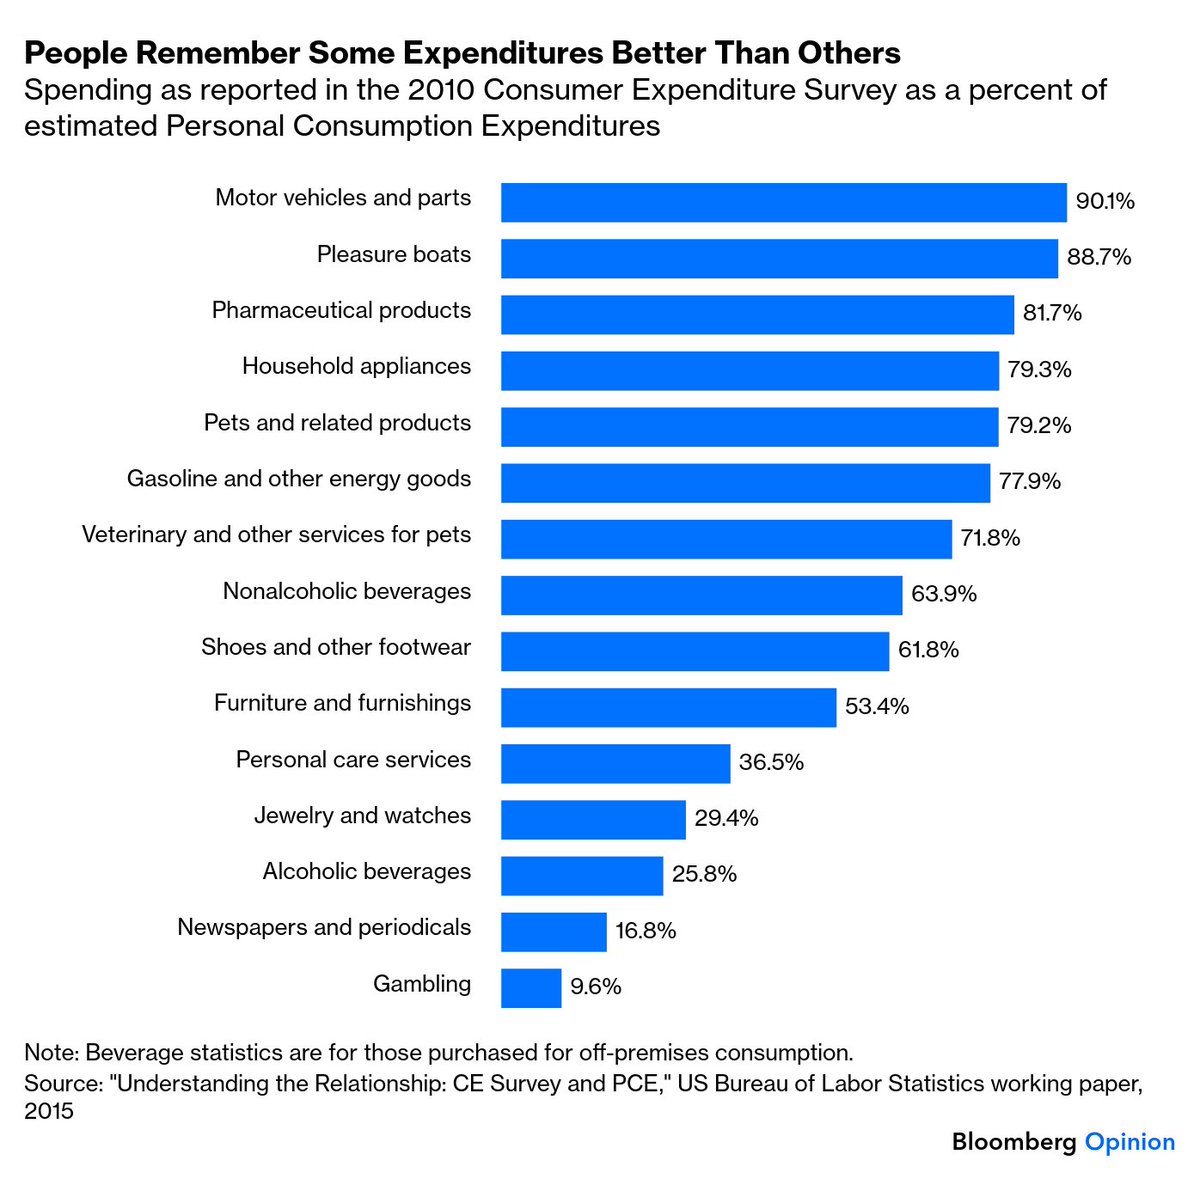
- There are major asterisks with both the DFAs & CEX.
- However, many (not all) of the CEX issues have to do with income measurement & won't change the rank ordering of households for these percentile purposes.
/1
I have a new column (gift link to come farther down in the thread) on that Moody's Analytics stat attributing nearly 50% of consumer spending to the top 10% of the income distribution, which @LevyAntoine, @ernietedeschi and others have critiqued
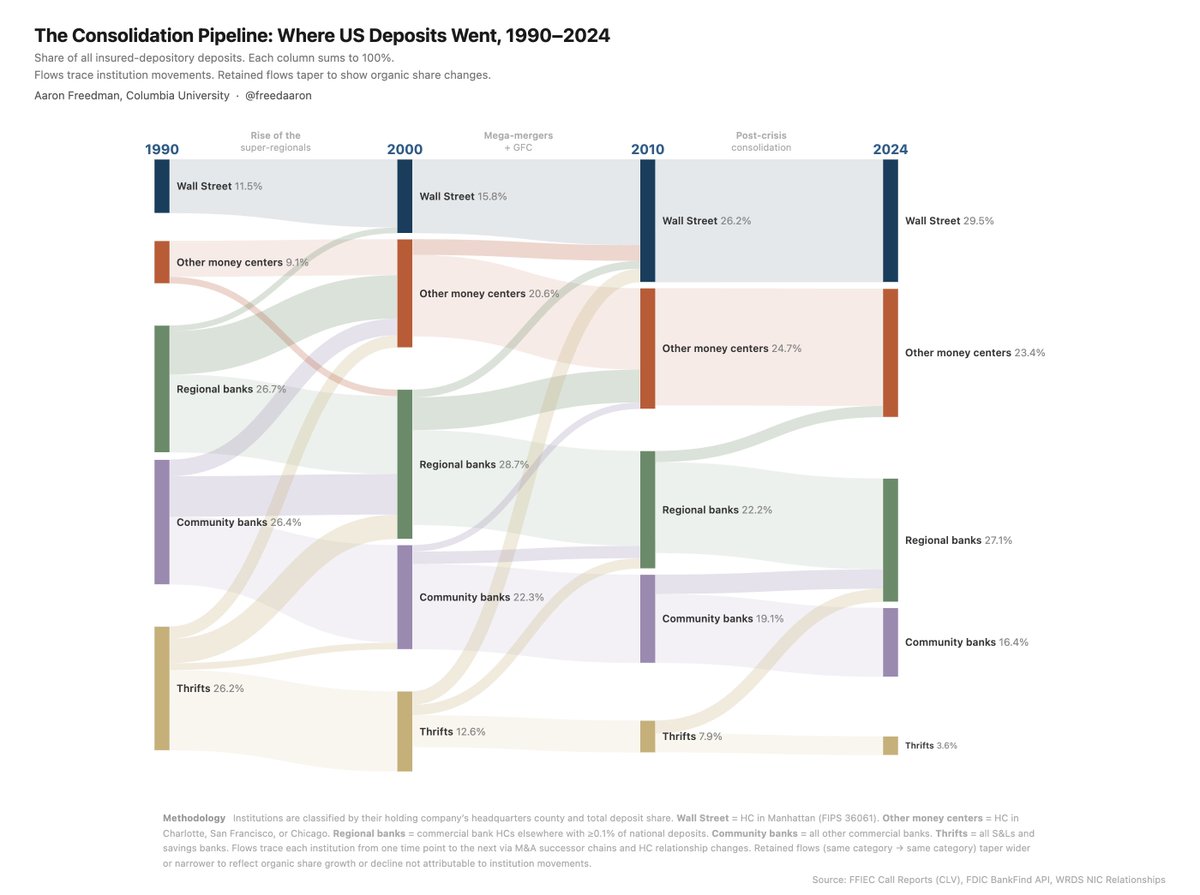
My new masterpiece: vibe-coded chart showing the collapse of the New Deal financial order by the flow of bank deposits to bigger and bigger banks.
From 1990 to 2024 NYC banks more than double their deposit share. Small banks and thrifts go from more than half of deposits to <20%.
@LevyAntoine@ernietedeschi@BLS_gov For much, much more (including Alan Greenspan sketching out the methodology now used by Moody's on a napkin in the 1990s), here's the gift link https://t.co/YTlOX87GM1
@LevyAntoine@ernietedeschi But the main direct measure we have of the distribution of consumer spending, the @BLS_gov Consumer Expenditure Survey, which says the the top 10% of the income distribution accounted for 22.9% of spending in 2024, has its problems too.
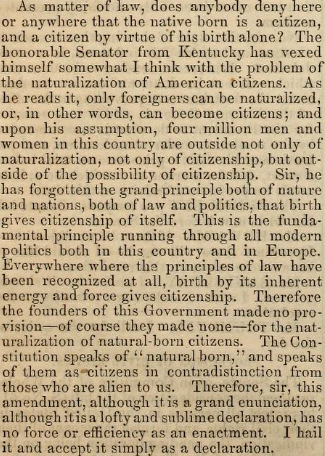
Morrill was replying to a speech by Garrett Davis of Kentucky, who argued that US citizenship was only for white people. Here's what Morrill had to say about that in particular.