Every correction is a buying opportunity if you have a plan. Here's my watchlist:
$NOK - Nokia
$TSLA - Tesla
$TE - T1 Energy
$AMZN - Amazon
$MP - MP Materials
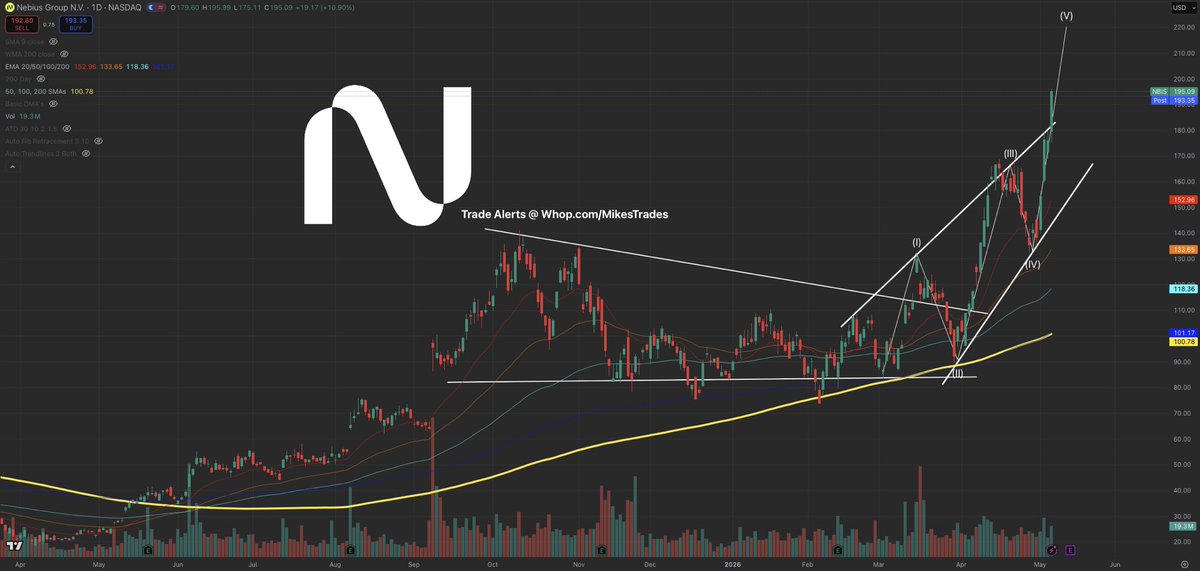
$NBIS - Nebius Group
$UUUU - Energy Fuels
$ONDS - Ondas Holdings
$SOFI - SoFi Technologies
$HOOD - Robinhood Markets
NFA. DYOR.
I’ve warned everybody once & I’ll say it again, one last final time…
AI infrastructure is the next theme to breakout in 2026:
$NBIS will be $330+
$CRWV will be $360+
$CIFR will be $34+
$IREN will be $110+
This move will make many millionaires.
Save this to look back on…
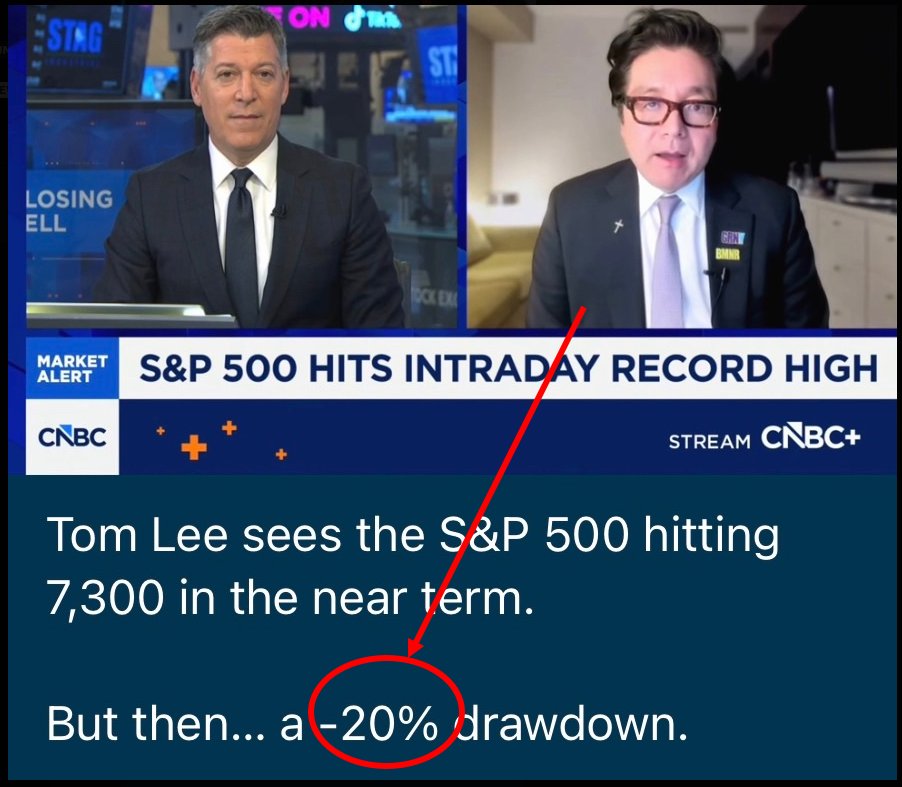
$730 is SPY target right now, but after it will crash 20% says Tom Lee to $580.
When ON SALE, I'd add these 20 stocks:
1. $IONQ – Quantum computing leader with massive asymmetric upside
Buy zone: $20–25 = early-stage value accumulation
2. $IREN – Cheap energy + AI compute = powerful margin expansion
Buy zone: $25–30 = strong support + cost advantage
3. $ASTS – Space-based telecom disruptor with global scalability potential
Buy zone: $65–70 = high conviction accumulation
4. $CRWV – AI data center REIT riding infrastructure demand wave
Buy zone: $70–75 = early positioning before scale
5. $GOOG (Alphabet Inc.) – AI + search dominance with strong cash flow engine
Buy zone: $150–170 = major institutional demand zone
6. $BE (Bloom Energy) – Data center power demand drives long-term growth story
Buy zone: $120–130 = prior base + demand zone
7. $COIN (Coinbase) – Crypto infrastructure with leverage to bull cycles
Buy zone: $130–140 = strong cyclical support
8. $AAPL (Apple Inc.) – Ecosystem moat + AI integration tailwinds building
Buy zone: $220–230 = long-term value zone
9. $TSLA (Tesla) – AI + autonomy optionality with massive upside
Buy zone: $280–300 = strong psychological support
10. $LITE (Lumentum Holdings) – AI data flow bottleneck driving explosive growth
Buy zone: $500–550 = momentum continuation base
11. $NVDA (NVIDIA) – AI leader with unmatched demand and pricing power
Buy zone: $150–160 = institutional accumulation
12. $AMD (Advanced Micro Devices) – Competing in AI chips with strong upside leverage
Buy zone: $180–190 = breakout retest zone
13. $HOOD (Robinhood Markets) – Retail trading growth + monetization expansion
Buy zone: $60–65 = demand + growth inflection
14. $SOFI (SoFi Technologies) – Fintech scaling with improving profitability trends
Buy zone: $13–15 = early-stage base
15. $QS (QuantumScape) – Solid-state battery breakthrough potential long-term
Buy zone: $5–7 = speculative accumulation
16. $MU (Micron Technology) – Memory cycle + AI demand driving pricing power
Buy zone: $310–320 = cycle bottom support
17. $SNDK (Sandisk) – Storage demand surge from AI + data growth
Buy zone: $550–600 = structural demand zone
18. $ONDS (Ondas Holdings) – Private wireless + drone tech early growth phase
Buy zone: $5–6 = high risk accumulation
19. $NKE (Nike) – Global brand reset with margin recovery potential
Buy zone: $35–40 = long-term support
20. $COHR (Coherent Corp.) – Optical infrastructure play on AI data explosion
Buy zone: $220–230 = direct LITE sympathy play
♻️RESHARE this post & write 1 comment for my list of SMALL CAPS under $20.
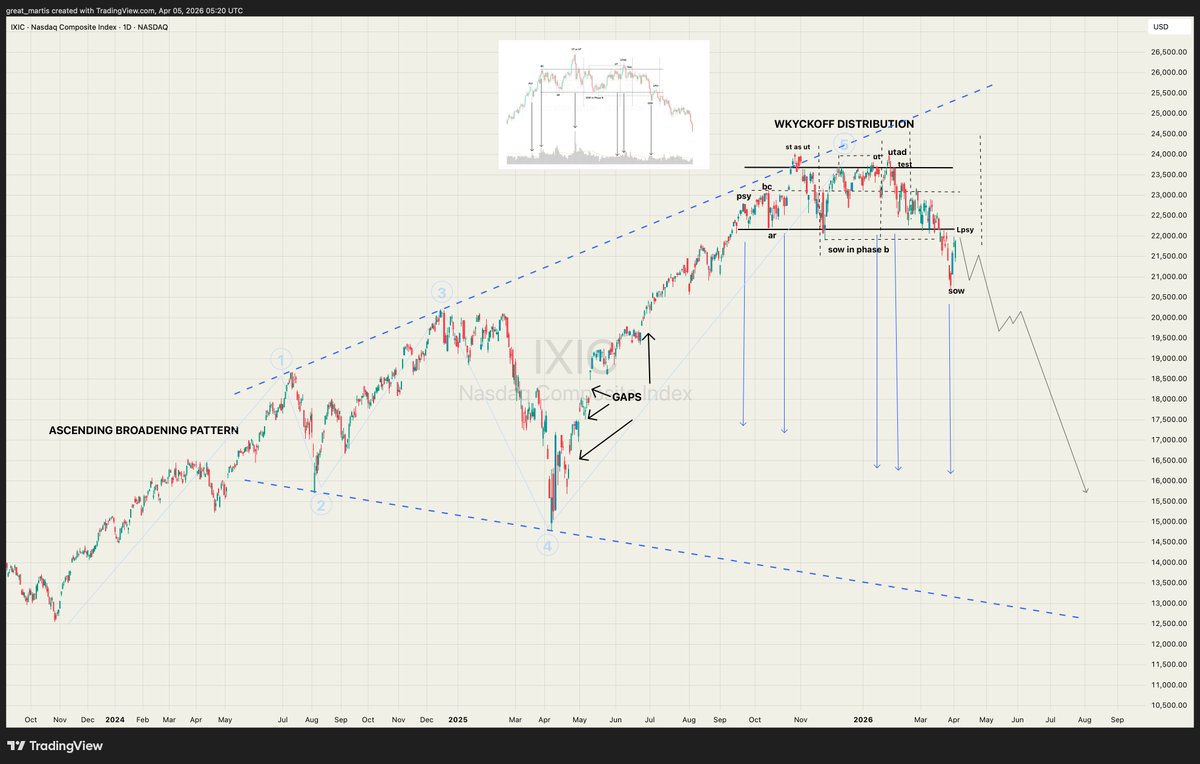
Nasdaq (IXIC) Update ✨
Wyckoff breached:
The Wyckoff Distribution we were watching has now been decisively breached below the key support (that horizontal AR/SOW line in Phase B). The last point of supply (LPSY) failed, the sign of weakness (SOW) has accelerated, and the whole structure has flipped into markdown mode.
But here’s the bigger picture that makes this move extra dangerous the Ascending Broadening Pattern (Edwards & Magee textbook style) that has been building across the entire 2024-2025 rally is now fully activated.
Edwards and Magee describe the Ascending Broadening Pattern as one of the most reliable and most violent reversal formations in technical analysis. It forms when price action creates a megaphone shape: successively higher highs (buyers getting more aggressive on the rallies) combined with successively lower lows (sellers stepping in harder on the reactions). The two trendlines diverge, volatility expands dramatically, and the swings get wider and wilder with each oscillation. They explain this pattern reflects a market that is losing control pure emotional trading where the public is chasing strength while professional money is distributing aggressively. Volume usually spikes on the up-swings and can stay elevated on the down swings, confirming the lack of real conviction behind the advance. Unlike symmetrical triangles or clean channels, this broadening formation screams “indecision at the top” and is almost always a major top reversal pattern.
Add to that the multiple major gaps left behind during the parabolic melt up phase (clearly marked on the chart). Those gaps are still wide open and sitting much lower. In a classic post distribution markdown, price has a very high probability of filling them as it seeks equilibrium especially once the broadening pattern is live and the Wyckoff structure has failed.
We are now in the zone where the real downside acceleration can happen.
Stay sharp ,stay vigilant, remain diligent.
Your truly,
The Great Martis.✨
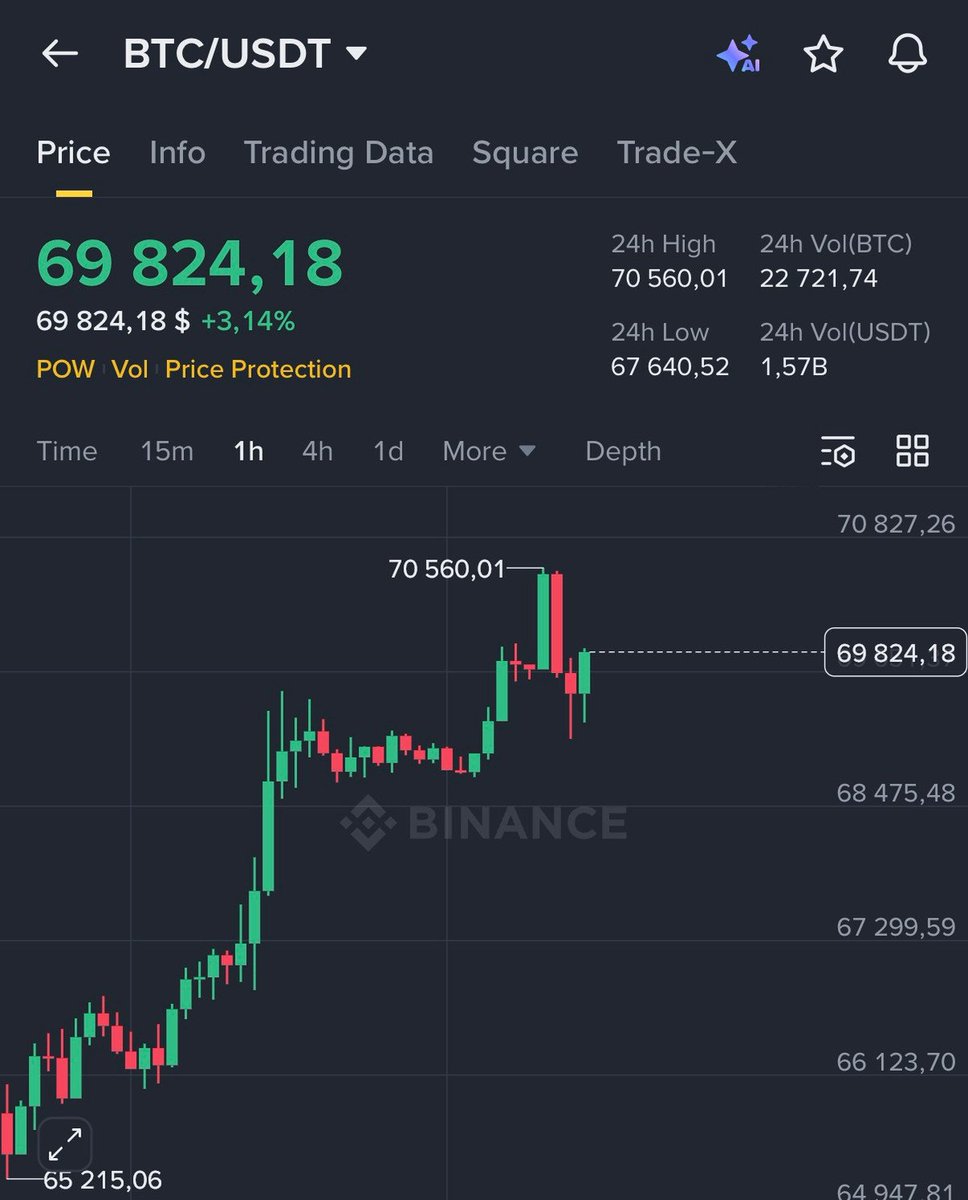
She's beautiful.📉
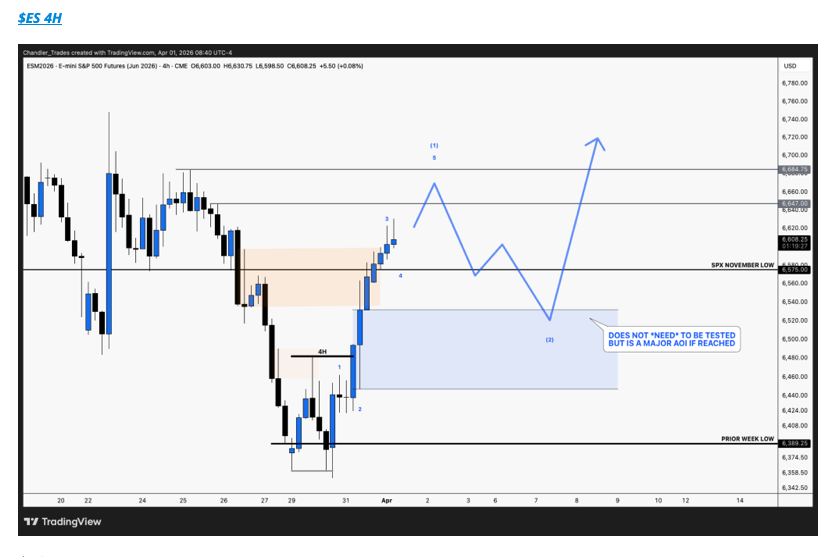
Nothing too surprising here. A bit sharper than ideal, but following the roadmap from yesterday's morning newsletter:
No reason to panic... (unless bulls lose this zone😅)
I promised that if $BTC hits $70,000 by week’s end,
I will give away $20,000 in BTC to 10 people.
So as promised I will be giving away
$20,000 to 10 person today.
Rules: Like, Retweet, and Comment "BTC" 🔔
24h left the end of the week, Grok below will pick winners (must follow & have DMs open)
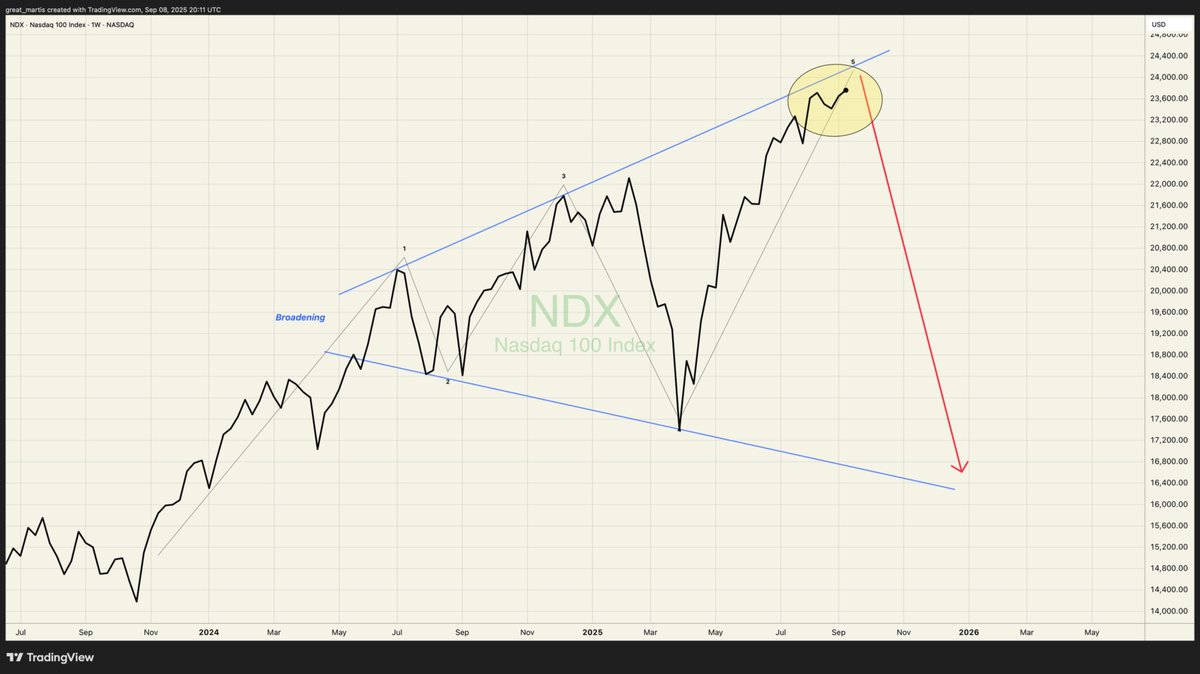
Nasdaq
Broadening pattern update.
Significant technical damage observed again.
As mentioned, these rare, majestic patterns should not be ignored.
Probable paths depicted below.
Hope this helps.
The divergence on the CBDET vs $SPX spread has never been this high in all of the indicator's history. The spread before covid crash in 2020 was about half as extended.
Potential liquidity has all but dried up.
🍿
NASDAQ
The rare broadening top is performing as expected.
As shown below, it has begun topping, which takes time.
This infamous pattern's sell-offs are extremely brutal.
Stay vigilant.
What can I say.
Lower low did not happen with the dovish Fed today. Sadly, as I was hoping to go long. 1.5% UP and volatility was crushed to a new low.
At this point the daily buy signal is in place till around Sept 3rd-5th which is just past labor day holiday. Target 6530-6550
Today was a Demark day 1 so day 9 would be Thurs Sept 4th and lines up well with the daily buy signal. Then Friday Sept 5th ends the week.
That basically puts us in Monday the 8th to Tuesday 16th. That's when things get dangerous and I am planning to short in that price and time area with 2% OTM Oct opex SPX puts. Note: strike price is tbd based on price action.
Remember,
FOMC is Wed Sept 17th
OPEX is Fri Sept 19th.
Going to be a sell the news event imo. No matter what the Fed does. Imo they will likely do a .25 rate cut I would imagine but could be wrong here.
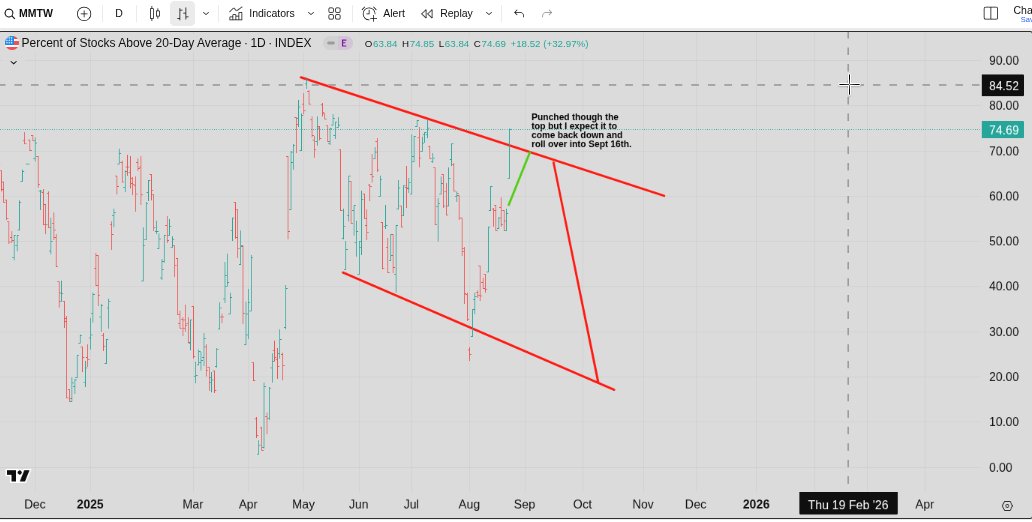
PS: 4hr / Daily pivots are bullish/ NYSE 4hr chart breadth is bullish and so is daily chart MMTW/RSP/MAGS. VIX daily is bearish Notice I have price hugging the top trendline till then. Any drops will be small and brief.
MMTW punched the top (wow) but I am expecting it to come back down and turn down. Topping is a process and these next few weeks will be important for watching this process.
The coming drop I expect is a W4 of the still in progress W1 from April 7th. It should goto the .382 retrace / blue vwap line / 200dma/ 50wma / 6030 gap fill. However, it will likely fall below to get ppl scared and extra bearish. Ultimate low after a bounce can be towards the trendline at 5850.
It will likely fall in 2 waves with a bounce in between ( the bounce typically runs to a high around opex of the month in question) . I updated one of my charts to show that. So early Oct bottom. Up to Oct opex.. Down again to early Nov, up to Nov Opex.
The market can do 1 more drop or just run up from there in W5 of W1 towards April/May 2026 when Powell's term is up (6800 per trendline by then)
PS: Its gonna suck for the new guy who will get the W2 HUGE collapse. Likely back towards 5000 or so. Issue will be the doubling of variable loan rates ($10T are affected), maybe other news as well.
In any case, this a weekly chart correction so will take time to happen to sometime in early/late November possibly. So 2 months should help to get the weekly back to oversold.