$BTC:1D
Chart is in log scale
Resistance: +2SD: 112.9K, +3SD: 118.4K
Linear Mean: LM: 102.2K
Supports: VWAP: 92.2K, -2SD: 91.3K, -3SD: 85.9K
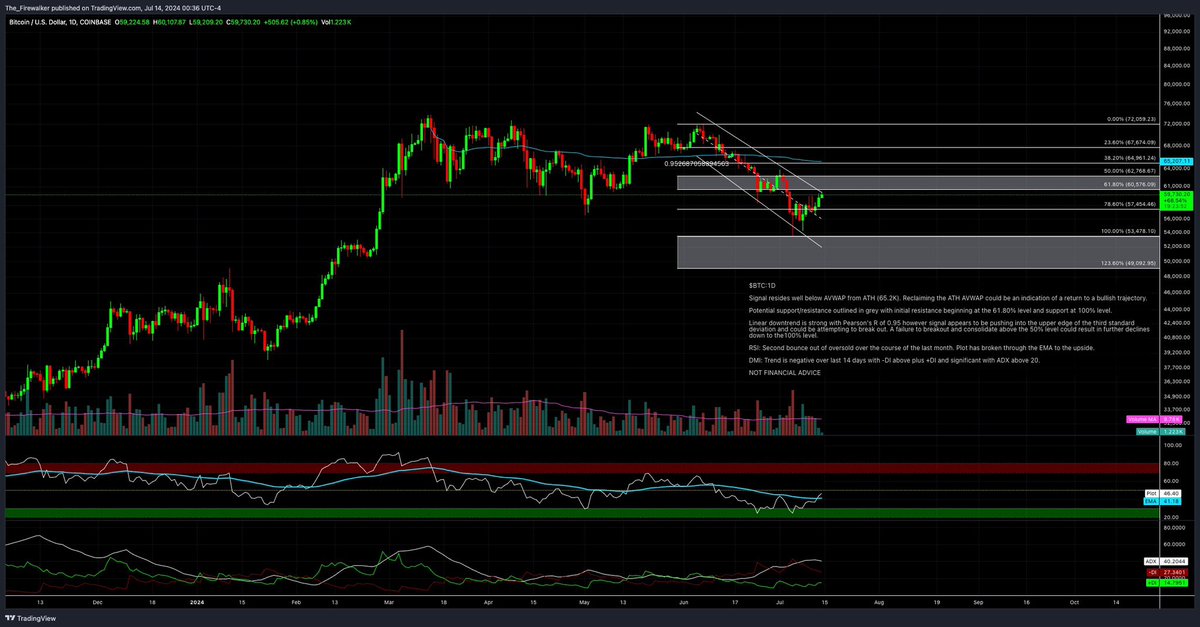
Price resides just below the linear mean (dotted line) and has cushion to the November 5 ‘Election VWAP’ (blue) at 92.2K. Price signal remaining above ‘Election VWAP’ indicates that constructive/bullish posture remains intact relative to the post election move to the upside. Pearson’s R of 0.94 indicates a high tendency for price to centralize around the linear mean price point at 102.2K.
That being said, bearish price to RSI divergence is present (see yellow horizontal lines) with price making higher highs and the RSI making lower highs, indicating waning upside momentum and an increased potential for a pull back in the near term.
Price could potentially fall to between roughly 91.3K and 85.9K before threatening to shatter the trend from late August of 2024 at the edge of the lower third standard deviation. Upside resistance looms from 112.9K to 118.4K.
NOT FINANCIAL ADVICE
#tradingmarket #tradingview #cryptocurrency #btc