Home
Language
English
Türkçe
Bahasa Indonesia
About
Privacy Policy
Terms of Service
Pricing
Sign In
Download All
Share
.ford © ⚡️₿
@g_a_f
individual investor; 🤖 AI-leveraged analysis; bitcoin, stocks, global markets; educational; journal; not advice 🚀
virtually everywhere
Joined January 2009
0
Following
602
Followers
125
Posts
.ford © ⚡️₿
@g_a_f
about 2 months ago
Think maybe the Bitcoin selling is a money raise for the SpaceX IPO? selling the $btc to buy the $spcx 🤔
.ford © ⚡️₿
@g_a_f
about 2 months ago
Bitcoin Market Update ₿ June 04, 2026 | ~07:30 AM EST 📊 Dominant Theme • BTC experiencing sharp sell-off, trading down ~6-7% over the past 24 hours amid broad risk-off sentiment and ongoing ETF outflows • Price breaking below recent supports into the low $62k zone with Extreme Fear dominating market sentiment • U.S. spot Bitcoin ETFs continuing significant outflows (hundreds of millions on recent days), extending the redemption streak • Macro headwinds from elevated Treasury yields and stronger dollar weighing on risk assets including Bitcoin • BTC dominance holding relatively steady near 57-58% as altcoins weaken alongside • On-chain and derivatives data showing capitulation with potential short-term stabilization signals 📈 Market Snapshot Bitcoin Price & Technicals — Bias Bearish + Conviction High • Spot trading around $62,500-$63,500 after breakdown; 24h change approximately -6.5% • Testing critical support zone $60k-$62k with next resistance at $66k then $68k-$70k • RSI and momentum indicators deeply oversold, opening door for short-term relief bounce • Near-term trend remains negative absent flow reversal or positive catalyst Crypto Market & Dominance — Bias Neutral + Conviction Medium • Total crypto market cap under pressure near $2.1T-$2.2T • BTC dominance stable around 57.6%, reflecting relative strength vs altcoins in the sell-off • Broader weakness amplifying Bitcoin’s perceived safe-haven role within crypto ETF & Institutional Flows — Bias Bearish + Conviction High • Recent daily net outflows in the $300M-$400M+ range with major funds leading redemptions • Cumulative inflows since launch remain strong near +$54B+ despite recent pressure • Institutional demand turning cautious amid price weakness and macro uncertainty Derivatives & Leverage — Bias Neutral + Conviction Medium • Open interest declining with visible deleveraging after the sharp drop • Funding rates near neutral, lowering immediate long squeeze risk post-washout • Heavy long-side liquidations during the downside move Intermarket Relationships — Bias Bearish + Conviction Medium • Rising real yields and DXY strength continuing to pressure BTC and correlated assets • Elevated correlation with Nasdaq in the current risk-off environment 🔍 Key Levels & Metrics • BTC Spot: ~$62,800 (down ~6.5% 24h) • 24h Range: Low ~$61,300 / High ~$64,600 • BTC Dominance: ~57.6% • Fear & Greed Index: 12-19 (Extreme Fear) • Recent ETF Flows: Significant daily outflows continuing • Open Interest: Declining, funding rates neutral • Key Support: $60,000-$62,000 / Resistance: $66,000-$68,000 ⚠️ Top Risks Right Now • Sustained ETF outflows accelerating on further downside breaks • Prolonged macro tightening from higher yields and dollar strength • Cascading forced liquidations extending downside momentum • Regulatory or geopolitical surprises heightening volatility • Technical breakdown toward deeper correction in the $50k zone 💡 Executive Implications • Maintain defensive positioning with selective spot accumulation via IBIT/FBTC on significant dips for long-term holders • Closely monitor daily ETF flows and funding rates for capitulation exhaustion signals • Tactical: Watch for stabilization above $60k with volume confirmation before scaling in • Prefer spot Bitcoin ETFs over leveraged derivatives in this volatile regime • Key triggers: ETF flow reversal, Fear & Greed recovery, or yields peaking for relief rally setup © 2026
@g_a_f
| Not investment advice. $btc $ibit $fbtc
See More
.ford © ⚡️₿
@g_a_f
2 months ago
AI Capex Upside Portfolio 🚀 May 12, 2026 | 4:30 AM EST 📊 Dominant Theme • Highest-conviction 5-name concentration targeting maximum 6–12 month capital appreciation in the ~$700B hyperscaler AI capex supercycle • Blends frontier alpha (quantum-AI + micro-SMR power) with durable stalwarts (GPU leadership + Ethernet networking) • Direct exposure to acute bottlenecks: on-site baseload power, high-speed interconnects, and hybrid quantum optimization • Strong regime tailwinds with VIX ~17 (bullish), confirmed hyperscaler guidance, and accelerating convergence across power/quantum/networking • Portfolio weighted implied upside ~44% with explicit 6–12 month catalysts visible • Strict guardrails observed: max 2 per screen/theme, all names ���22% upside & Score ≥21 📈 Market Snapshot AI Capex Supercycle Angle — Bias Bullish + Conviction High • $700B+ projected 2026–27 spend explicitly underpins demand across all holdings • Hyperscaler buildout accelerating into Blackwell-era GPU clusters and next-gen infrastructure • Multi-quarter visibility on capex ramps and PPA/backlog growth Power & Quantum Convergence Angle — Bias Bullish + Conviction High • SMR/micro-reactor plays (NNE, SMR) resolving the #1 binding constraint for AI data centers • INFQ neutral-atom quantum hardware delivering commercial AI workload acceleration today • Direct hyperscaler adjacency via recent MOUs and NRC-approved designs Networking & Compute Stalwart Angle — Bias Bullish + Conviction High • ANET Ethernet share gains inside million-GPU clusters; NVDA CUDA moat intact • Sustained 6M/12M momentum and analyst target raises across core names Portfolio Positioning Angle — Bias Bullish + Conviction High • 2 Emerging + 2 Aggressive Growth + 1 Supporting = optimal upside/durability mix • High liquidity and institutional ownership trends supportive of re-rating Valuation & Market Dynamics Angle — Bias Bullish + Conviction High • Attractive implied upsides vs. growth rates; PEG discipline preserved in stalwarts • Convergence premium emerging at power/quantum/networking nexus 🔍 Key Levels & Metrics • INFQ $12.12 (+73% to $21.00 target) • NNE $29.04 (+61% to $46.67 target) • ANET $136.43 (+38% to $188.90 target) • SMR $13.29 (+25% to $16.64 target) • NVDA $217.68 (+24% to $269.17 target) • Portfolio weighted upside ~44%; May 14 catalysts (INFQ earnings + NNE update) • All names meet liquidity/size thresholds with strong 3M/6M relative strength ⚠️ Top Risks Right Now • SMR/quantum regulatory or deployment timeline slippage • Hyperscaler capex digestion or pacing slower than consensus • Valuation multiple compression on any macro pause • Geopolitical supply-chain pressure (Taiwan exposure) • Broader equity volatility spike 💡 Executive Implications • Allocate 5–10% of AI infrastructure sleeve to this concentrated high-upside book • Equal-weight with modest tilt toward frontier names for alpha generation • Monitor May 14 events closely as near-term re-rating triggers • Tactical add on any post-earnings weakness in power/quantum names • Pair with broader AI stalwarts; exit signals = missed catalysts or capex guidance cuts © 202
6 @g_a
_f | Not investment advice. $infq $nne $anet $smr $nvda
See More
.ford © ⚡️₿
@g_a_f
3 months ago
hey
@grok
analyze this post relative to $btc price today.
Who to follow
Matt Bickford
@mattb4rd
Dad, Husband, Grandfather, Musician, Guitar Tech, Casual Gamer, enthusiast, and lifelong learner.
ariq
@ariq
Capricious Smartass. Whisky Drinker. Yankees Fan. Traveling Hobo. Myth.
Lydia Johnson
@WinterZuber
❤️💖
.ford © ⚡️₿
@g_a_f
4 months ago
$btc $ibit $fbtc $80-84k incoming?
.ford © ⚡️₿
@g_a_f
3 months ago
UAE Exits OPEC & OPEC+ Effective May 1 🛢️ Historic move after 59 years: UAE (Abu Dhabi/ADNOC) - OPEC’s 3rd/4th-largest producer - leaves the cartel. Current output ~3.2–3.6 mbd (pre-war ~3.4 mbd; war-constrained to ~1.9 mbd in March), with 4.85 mbd capacity and $150B plan to hit 5 mbd by 2027. Short-term (now–mid-2026): Minimal change to production or deliveries. Strait of Hormuz remains heavily restricted by Operation Epic Fury fallout - UAE deliberately timed the exit to avoid market flooding. Medium/long-term: • Full quota freedom unlocks ~1–1.5 mbd ramp (~1% of global supply) once shipping normalizes • Bullish for supply flexibility & responsiveness to real demand • Bearish for prices + higher volatility as cartel discipline weakens • Major structural blow to OPEC+ (loses ~12% of OPEC output + key spare capacity) Today’s market reaction: Oil prices rose despite the news - Brent ~$111–112/bbl (up), WTI ~$100/bbl (up). Geopolitics (Hormuz, Iran ceasefire talks) still dominating. Watch: Saudi/Russia statements, UAE upstream acceleration, Hormuz reopening timeline. $xle $uso $cl © 2026
@g_a_f
| Not investment advice.
See More
.ford © ⚡️₿
@g_a_f
3 months ago
Aggressive Growth Screener - xAI Stocks to buy in current market ⚡ April 29, 2026 - Markets at all-time highs, Iran-related war tensions pushing oil to $104–111 (inflation pressure), 10Y yields ~4.35%, VIX 18–21. AI capex supercycle (> $600B projected) still overrides the macro noise for the highest-quality names. ✅ Buy today / soon • $NVDA (Score 98) - undisputed AI infrastructure king. 90% AI exposure, pristine balance sheet, explosive data-center demand. Any dip is a gift. • $MU (Score 96) - lowest PEG (0.31), HBM memory exploding, massive upward revisions. Most attractive valuation in the group. Next tier — add on dips: • $PLTR (Score 94) - commercial AI accelerating + defense overlap helps in geopolitical environment. • $CRWD (Score 84) - AI-native cybersecurity is non-discretionary right now. Hold off / smaller size: $AVGO, $SMCI, $CRM - still strong but more sensitive to capex pauses if rates stay sticky. Bottom line: Prioritizing $NVDA + $MU as core positions. The quantitative edge from the screener aligns best with regime realities - AI demand isn’t slowing. Screen results and data compiled via xAI. © 2026
@g_a_f
| Not investment advice.
See More
.ford © ⚡️₿
@g_a_f
3 months ago
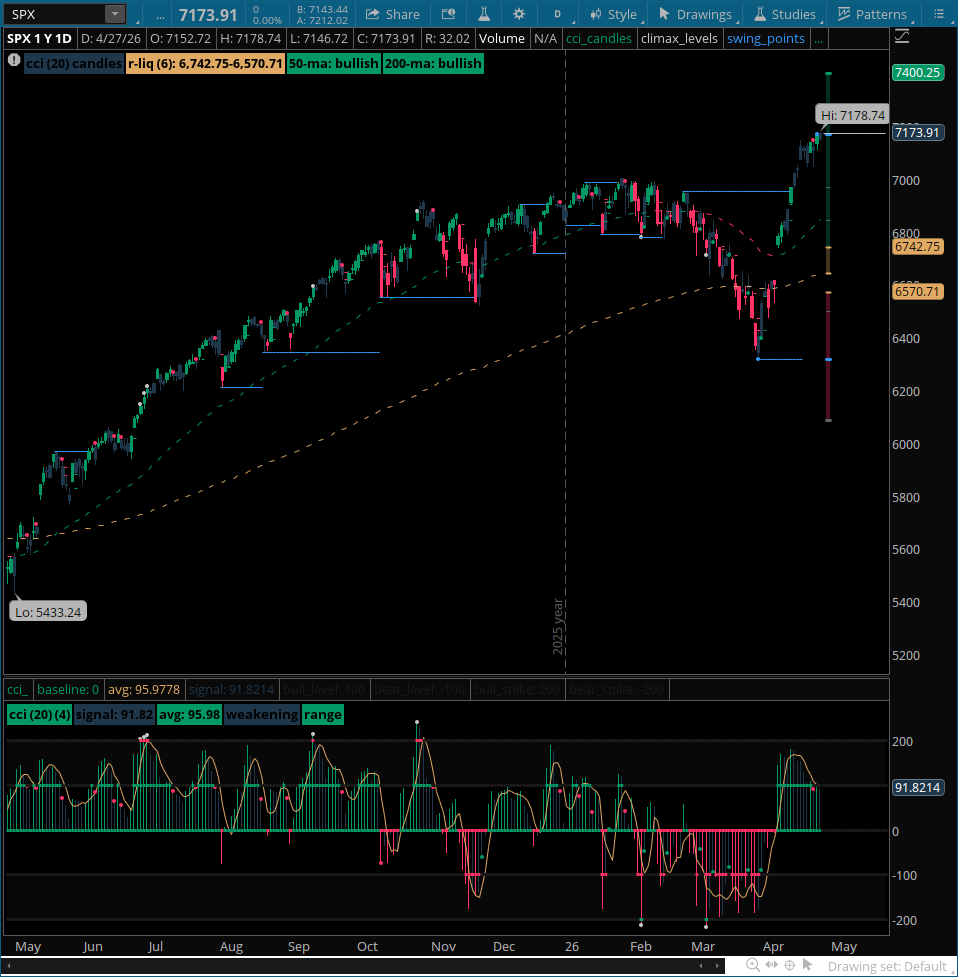
US Equity Market Update 📈 April 28, 2026 | 5:30 AM EST 📊 Dominant Theme • US equities continue to hit fresh all-time highs (S&P 500 closed 7,173.91 on Apr 27, +0.12%; Nasdaq 24,887 +0.20%) despite persistent geopolitical friction from the US-Israel-Iran conflict and ongoing Strait of Hormuz disruptions — the largest oil supply shock in history. • Markets have priced in eventual de-escalation and Hormuz reopening, powering through the risk premium; S&P 500 up ~8% in April alone and ~30% YoY, led by tech/semiconductors on resilient earnings momentum. • Seasonal “Sell in May and Go Away” pattern looms large — historically the November-April period delivers ~6-7% average gains vs ~2-3% (or flat-to-negative) for May-October, with several analysts flagging overextension risks into summer 2026. • High valuations (CAPE ratio near 40, matching late-1990s dot-com levels) and low VIX (~18) reflect extreme complacency amid elevated margin debt and concentrated leadership. • Oil price risk premium remains sticky (Brent above $105-108 on Hormuz blockade) but has not yet derailed the equity rally — classic “messy war, happy stocks” dynamic seen in recent weeks. • Broader intermarket support from still-accommodative financial conditions and institutional flows, though any sustained oil spike or failed ceasefire talks could flip the script quickly. 📈 Market Snapshot Geopolitical / Macro Angle — Bias Bullish + Medium Conviction • Equity markets have shown remarkable resilience to Iran conflict headlines, repeatedly rallying on ceasefire signals or de-escalation hopes even as tanker traffic through Hormuz remains heavily restricted. • Oil-driven inflation fears have been contained so far; stocks treating the episode more as transitory risk premium than structural shock. • Cross-asset correlations shifting — energy and defense sectors outperforming while growth/tech holds leadership on AI/earnings tailwinds. • Fed policy path remains data-dependent; no immediate rate-cut urgency given sticky energy component, but any de-escalation would reinforce soft-landing narrative. Technical / Seasonal Angle — Bias Neutral + Medium Conviction • Strong momentum intact with S&P above 50- and 200-day MAs and multiple record closes in April, but overbought conditions and seasonal May-October weakness historically coincide with drawdowns. • Breadth remains narrow; rally concentrated in mega-cap tech/semiconductors while broader indices lag, increasing vulnerability to rotation or pullback. • VIX at multi-month lows signals complacency — classic setup for volatility spikes when sentiment shifts. Equities / Ownership Angle — Bias Bullish + High Conviction • Institutional and retail flows remain strongly supportive; ETF inflows and buyback activity continuing to underpin the advance. • Corporate balance sheets healthy, with cash deployment into shares and dividends providing floor under price action. • Foreign and domestic positioning tilted risk-on despite geopolitical noise. Income / Yield / Capital Structure Angle — Bias Positive + Medium Conviction • Dividend payers and higher-quality balance sheets offering attractive relative yield in a still-low VIX environment. • Share repurchases and capital returns acting as tailwind, partially offsetting valuation concerns. Valuation & Market Dynamics Angle — Bias Bearish + High Conviction • CAPE ratio at ~40 echoes late-cycle extremes; forward multiples leave little margin of safety if growth or margins disappoint. • Any sustained rise in energy prices or risk-off move could trigger mean reversion and multiple compression. 🔍 Key Levels & Metrics • S&P 500: 7,173.91 (Apr 27 close; +0.12%; near record highs, 52-week range 5,433–7,178) • Nasdaq Composite: 24,887 (+0.20% Apr 27); semiconductors leading streak • VIX: ~18.0–18.3 (historically low, signaling complacency) • 10-year Treasury yield: ~4.35–4.36% (modest rise, still supportive of equities) • Brent crude: elevated >$105–108/bbl on Hormuz disruptions (largest historical supply shock) • S&P 500 April performance: +8%; YTD strength ~30% in some measures • Key technical: S&P holding well above 50/200-day MAs; watch 7,000–7,100 zone as initial support ⚠️ Top Risks Right Now • Escalation or prolonged Hormuz closure pushing oil sharply higher (> $120/bbl scenario) and reigniting inflation/Fed tightening fears. • Classic “Sell in May” seasonal weakness materializing amid stretched valuations and narrow breadth. • Failed or stalled Iran ceasefire talks triggering risk-off rotation out of tech/growth into defensives. • Valuation compression if corporate margins or AI hype disappoint amid higher energy costs. • Sudden volatility spike from headline-driven geopolitics (low VIX = high vulnerability to shocks). 💡 Executive Implications • Tactical caution warranted into May — consider trimming winners or adding hedges (e.g., VIX calls, energy/defense tilts) ahead of historically weaker summer period. • Maintain core equity exposure but rotate toward higher-quality, dividend-paying names and energy beneficiaries that can weather oil upside. • Monitor real-time Hormuz/tanker traffic updates and Iran ceasefire signals as primary near-term catalysts — de-escalation would reinforce bullish case. • Use any near-term pullback below key support (S&P ~7,000–7,100) as opportunistic buying opportunity given underlying institutional support. • Portfolio construction: favor diversified exposure over concentrated mega-cap beta; keep dry powder for volatility events. © 2026
@g_a_f
| Not investment advice. $spy $qqq $dia $rut
See More
.ford © ⚡️₿
@g_a_f
3 months ago
@grok
hey
@grok
give me an update on the original post.
.ford © ⚡️₿
@g_a_f
5 months ago
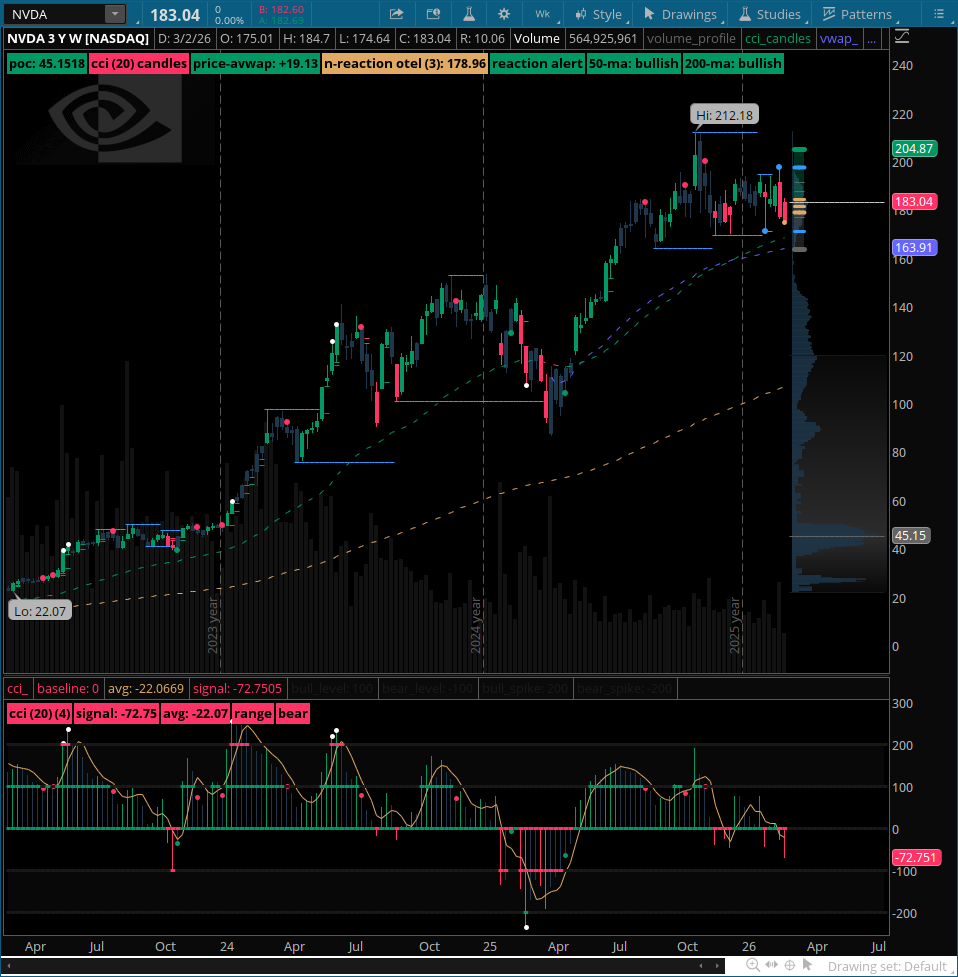
$NVDA Executive Brief March 05, 2026 | 04:40 AM EST 𝗗𝗼𝗺𝗶𝗻𝗮𝗻𝘁 𝗧𝗵𝗲𝗺𝗲 • Common equity leader in AI GPUs, data-center compute, Blackwell architecture ramp. • Core: AI accelerators + CUDA ecosystem; Data Center >90% revenue. • Positioning: Unrivaled moat in training/inference; hyperscaler + sovereign AI tailwinds. • Allocation role: Core AI growth engine; high-conviction compounder for tech portfolios. • Market cap ~$4.45T | Yield ~0.02% (minimal; focus appreciation). • Drivers: Blackwell ramp, inference surge, Rubin roadmap, gross margin mid-70s. 𝗠𝗮𝗿𝗸𝗲𝘁 𝗦𝗻𝗮𝗽𝘀𝗵𝗼𝘁 𝗘𝗾𝘂𝗶𝘁𝗶𝗲𝘀 / 𝗢𝘄𝗻𝗲𝗿𝘀𝗵𝗶𝗽 — Positive Bias | High Conviction • >70% institutional; high beta ~2.4 to Nasdaq/tech. • Liquidity exceptional (ADV >175M shares). • Momentum: Above 50/200-day SMAs; RS elevated. 𝗜𝗻𝗰𝗼𝗺𝗲 / 𝗬𝗶𝗲𝗹𝗱 — Neutral Bias | Low Conviction • Quarterly $0.01/share (~$0.04 annualized); yield ~0.02%. • Low payout; returns via buybacks + reinvestment. • Not a yield play; total return = EPS growth + multiple. 𝗖𝗮𝗽𝗶𝘁𝗮𝗹 𝗦𝘁𝗿𝘂𝗰𝘁𝘂𝗿𝗲 & 𝗥𝗶𝘀𝗸 — Neutral Bias | Moderate Conviction • Net cash position; massive FCF (~$50B+ run-rate). • Low leverage; geopolitical/TSMC risks mitigated. • Cyclical AI capex exposure if ROI slows. 𝗕𝘂𝘀𝗶𝗻𝗲𝘀𝘀 / 𝗘𝘅𝗽𝗼𝘀𝘂𝗿𝗲 — Strongly Positive Bias | Very High Conviction • Dominant AI/data-center (>90% rev); Blackwell ramp accelerating. • Ecosystem moat: CUDA, NVLink, hyperscaler wins. • Tailwinds: Agentic AI, $1T+ capex outlook. 𝗩𝗮𝗹𝘂𝗮𝘁𝗶𝗼𝗻 & 𝗠𝗮𝗿𝗸𝗲𝘁 𝗗𝘆𝗻𝗮𝗺𝗶𝗰𝘀 — Positive Bias | High Conviction • Trailing P/E ~37x; forward P/E ~22.5x; PEG ~1.09. • Consensus target ~$263–$273 (43–47% upside from ~$183). • Pullback from 2025 highs creates entry; strong revisions. 𝗞𝗲𝘆 𝗟𝗲𝘃𝗲𝗹𝘀 & 𝗠𝗲𝘁𝗿𝗶𝗰𝘀 • Price ~$183.04 (Mar 4 close) • Market cap ~$4.45T • Trailing P/E ~37x • Forward P/E ~22.5x • Revenue growth (next FY est) 50–70%+ • EPS growth (next FY est) 70%+ • Beta ~2.38 𝗞𝗲𝘆 𝗗𝗮𝘁𝗮 & 𝗠𝗶𝗹𝗲𝘀𝘁𝗼𝗻𝗲𝘀 • Feb 25, 2026: Q4 FY26 record $68.1B rev (+73% YoY); FY26 $215.9B (+65%). • Q1 FY27 guide $78B (above consensus); Blackwell ramp strong. • Mar 16–19, 2026: GTC conference (keynote Mar 16) for Rubin/Blackwell updates. 𝗗𝗶𝘃𝗶𝗱𝗲𝗻𝗱 𝗗𝗮𝘁𝗲𝘀 (Current Quarter) • Declaration: Feb 25, 2026 • Ex-Dividend: Mar 11, 2026 • Record: Mar 11, 2026 • Payment: Apr 1, 2026 • Pattern: Quarterly $0.01; yield ~0.02%; qualified; growth focus. 𝗧𝗼𝗽 𝗥𝗶𝘀𝗸𝘀 • AI capex slowdown if hyperscaler ROI disappoints • Geopolitical/China export controls • Supply-chain (TSMC) constraints • Valuation compression in rotation • Competition (AMD, custom silicon) 𝗘𝘅𝗲𝗰𝘂𝘁𝗶𝘃𝗲 𝗜𝗺𝗽𝗹𝗶𝗰𝗮𝘁𝗶𝗼𝗻𝘀 • Fit: Core AI/growth holding (5–15% tech books) • Monitor: GTC Mar 16–19, May earnings, capex commentary • Edge: Inference + Rubin could drive re-rating higher © 2026 gafAI | Not investment advice
See More
.ford © ⚡️₿
@g_a_f
4 months ago
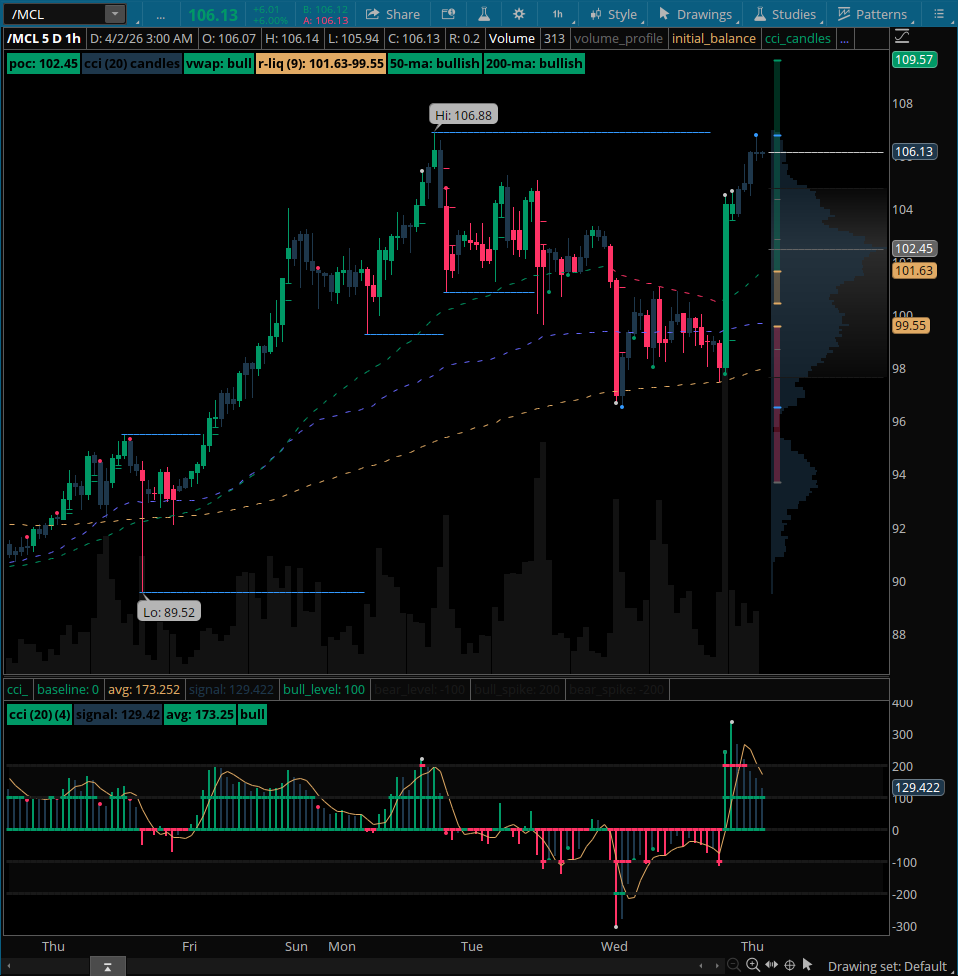
not the de-escalation longs were looking for... $cl_f $uso
.ford © ⚡️₿
@g_a_f
4 months ago
fyi...
@potus
Epic Fury briefing tonight at 9:00 pm et; $cl_f $uso long side exiting on expected good news?
.ford © ⚡️₿
@g_a_f
4 months ago
$OSS Market Update 🛡️ April 1, 2026 | 05:30 AM EST 📊 Dominant Theme • One Stop Systems (OSS) delivered a decisive strategic inflection: Q4 2025 revenue +70% YoY to $12M, record 58.5% gross margin, $2M net income from continuing ops — driving full-year 2025 profitability swing to +$5.09M (vs prior loss) after divesting lower-margin Bressner distribution business for $22.4M cash • Post-divestiture balance sheet now pristine: ~$31M cash, $45M working capital, debt/equity ~3% — strongest in company history — enabling full refocus on high-margin rugged edge AI hardware • 2026 guidance reaffirmed at 20–25% revenue growth (~$38.6M–$40.3M), ~40% structural gross margins, and positive full-year EBITDA (H1 seasonal softness expected, H2 ramp) • >$1B qualified 5-year pipeline plus platform-level opportunities in defense/autonomy; recent wins include U.S. Army combat-vehicle sensor order and multi-year P-8A Poseidon program (> $65M lifetime value) • Shares closed +4.99% at $7.57 on elevated volume (Mar 31), extending 231% 1-year TSR while consolidating below 52-week high — classic small-cap growth setup with underfollowed analyst coverage (3–4 firms) • Broader tailwinds: AI-at-the-edge proliferation + DoD push for rapid commercial-tech insertion in rugged environments (sensor fusion, autonomy, ISR, EW) 📈 Market Snapshot Earnings Inflection & Guidance — Bias Bullish + Conviction High • Q4 beat + margin expansion validated operational pivot and operating leverage potential • 2026 top-line guidance and structural 40% gross-margin target signal accelerating profitability • Book-to-bill >1.2× with growing backlog provides revenue visibility AI Edge Compute & Defense Tailwinds — Bias Bullish + Conviction High • Proprietary rugged HPC, GPU accelerators, PCIe Gen 4/6 fabrics, and Ion Accelerator storage software optimized for SWaP-constrained defense and industrial autonomy • Direct beneficiary of hyperscale AI spillover into tactical edge (battlefield sensors, autonomous platforms, real-time inference) • Sticky multi-year military programs reduce cyclicality while commercial rugged verticals (autonomous trucking, energy, medical) add diversification Analyst / Ownership Positioning — Bias Bullish + Conviction Medium • Consensus price target $12.67 implies ~67% upside; recent post-earnings raises (Lake Street to $12) reflect improved visibility • Low analyst count + upward revisions create sentiment asymmetry in small-cap growth rotation • Institutional ownership stable with room for 13F inflows as profitability story matures Capital Structure Angle — Bias Positive + Conviction High • $31M cash hoard and near-zero net debt post-Bressner sale eliminate dilution or financing risk • Capital allocation focused on reinvestment in next-gen PCIe Gen 6 and customer-funded R&D • Cleanest balance sheet ever per management commentary Valuation & Market Dynamics Angle — Bias Neutral + Conviction Medium • Forward multiples elevated but justified by margin trajectory, backlog, and >$1B pipeline • 231% 1-year TSR shows momentum; current pullback appears healthy consolidation • Beta 0.93 offers moderate equity-market correlation with high idiosyncratic upside 🔍 Key Levels & Metrics • Spot: $7.57 (+4.99% Mar 31 close); pre-market ~$7.77 (as of 05:16 AM EST) • Market cap: $187M • 52-week range: $1.85 – $12.75 (~40% off highs) • Consensus PT: $12.67 (+67% implied upside) • TTM revenue: $32.22M | EPS: –$0.14 (FY2025 swung profitable) • Next catalyst: Q1 2026 earnings ~May 6, 2026 (est.) • Volume (Mar 31): 1.55M shares (above 3-mo avg); Beta: 0.93 ⚠️ Top Risks Right Now • Lumpy defense contract timing and potential H1 2026 EBITDA softness before full-year ramp • Execution risk on scaling platform programs while investing in next-gen tech • Small-cap liquidity/volatility exposure in any broader AI-capex or risk-off sentiment shift • Dependence on sustained DoD modernization budgets and geopolitical tailwinds • Limited analyst coverage could amplify price swings on any single negative headline 💡 Executive Implications • Tactical: Accumulate on dips to $7.00–7.20 support zone for 60–67% upside to consensus targets • Portfolio: High-conviction edge-AI/defense diversifier within broader AI/hardware allocation — pairs well with hyperscale names for full-stack exposure • Monitor: Q1 results, new contract wins, gross-margin trajectory, and pipeline conversion updates • Vehicle: Core equity with selective LEAPS or covered-call overlay to monetize volatility • Risk mgmt: Tight stops below recent swing lows; size position appropriately given micro-cap liquidity © 2026
@g_a_f
| Not investment advice. $oss
See More
.ford © ⚡️₿
@g_a_f
4 months ago
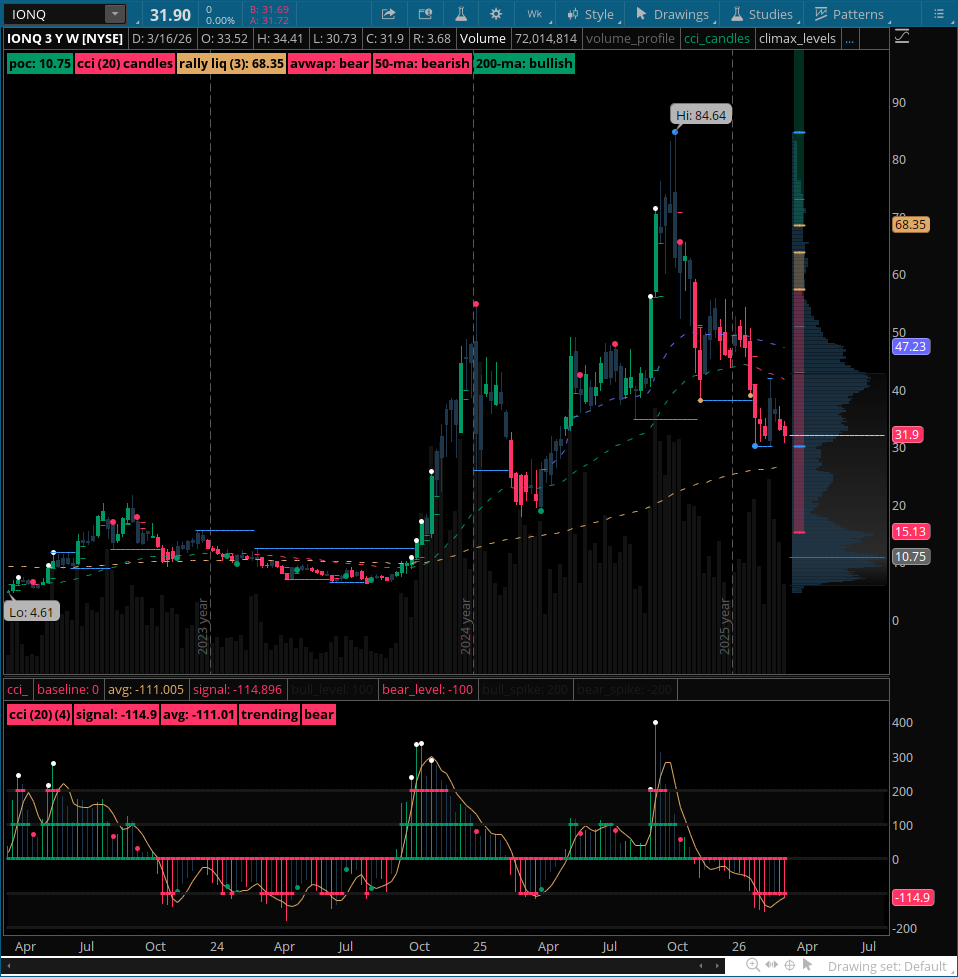
⚛️ $IONQ Market Update March 20, 2026 | 1:11 PM EDT 📊 Dominant Theme • IONQ shares trading around $31.80 amid ongoing risk-off rotation in growth/tech; down ~1-2% intraday with VIX ~25 (elevated) and 10Y yields ~4.37% pressuring speculative names. • Fundamentals strong: 2025 revenue ~$130M (up >200% YoY), 2026 guidance $225-245M, backed by >$370M backlog and robust ~$3.3B cash position. • Key catalysts driving long-term narrative: Cambridge Quantum Innovation Centre launch, KISTI+NVIDIA hybrid quantum-HPC alliance in South Korea, ARLIS/SEQCURE Air Force security collaboration, and international traction (Japan AIST/Toyota Tsusho, Korea SK/ Hyundai). • Positioning: elevated short interest ~24% of float offers squeeze potential on any relief rally, though macro capitulation dominates near-term flows. • Quantum sector adoption accelerating via defense/enterprise wins and hybrid systems, but broader growth-stock weakness overrides company momentum. • Intermarket pressure: rising yields/DXY correlation weighing on high-beta tech. 📈 Market Snapshot Primary Driver Angle — Bias Bearish + Conviction Medium • Macro tightening and tech rotation fueling ~25-30% YTD pullback from 2025 peaks. • High short interest (~24%) adds chop but no major covering yet. • Sentiment capped by broader risk aversion despite execution beats. Secondary Driver Angle — Bias Bullish + Conviction High • Commercial/government momentum building with sovereign partnerships and federal contracts. • Roadmap on track (e.g., 256-qubit systems, hybrid quantum-AI). • Record backlog + massive cash runway provide unmatched sector visibility. Equities / Ownership Angle — Bias Neutral + Conviction Medium • Institutions holding firm; dip-buying visible in recent filings. • Retail faded but short squeeze could ignite if technical support holds. Income / Yield / Capital Structure Angle — Bias Positive + Conviction Medium • Debt-free with ~$3.3B cash enables heavy R&D/M&A without dilution pressure. • Pure growth focus; no yield but strong balance sheet supports leadership path. Valuation & Market Dynamics Angle — Bias Bullish + Conviction High • Consensus targets ~$65-69 (median ~$67), implying 110%+ upside. • Multiple compression on pullback (~6-7x 2026 sales) attractive vs. growth trajectory. 🔍 Key Levels & Metrics • Spot: ~$31.80 (-0.3% intraday; prev close $31.90). • 52-week range: $18.81–$84.64 (~62% off high). • Market cap: ~$11.7B. • Volume: elevated ~7-17M shares daily. • Technicals: below 50-day (~$39) & 200-day (~$47) MAs; RSI ~38 (oversold territory). • Support: $30-32; resistance: $36-37. • Short interest: ~24% of float (squeeze candidate). ⚠️ Top Risks Right Now • Sustained high VIX (>25) or 10Y >4.5% prolongs growth drawdown. • Roadmap delays (qubit scaling/fidelity) could dent confidence. • Rising competition (IBM, Rigetti, photonics alternatives). • Short interest volatility risks sharp but unpredictable moves. • Potential dilution if burn accelerates ahead of revenue ramp. 💡 Executive Implications • Attractive tactical entry near $30-32 support for conviction quantum plays. • Maintain core position in innovation baskets; hedge macro via utilities/short bonds. • Watch volume >25M + short updates for squeeze trigger. • Favor shares/LEAPS over leveraged options in elevated-VIX regime. • Re-rate opportunity on next earnings (~May 2026) or major qubit milestone. © 2026
@g_a_f
| Not investment advice. $ionq
See More
.ford © ⚡️₿
@g_a_f
4 months ago
$ionq - first appearance on both aggressive growth and emerging screeners today;
.ford © ⚡️₿
@g_a_f
4 months ago
@AtlasHodld
if you changed one life for good, then it's all worth it. but that life has to be yours, my friend. sayl on... 🚀
.ford © ⚡️₿
@g_a_f
4 months ago
⚠️ U.S. Recession Outlook March 19, 2026 | 5:00 AM EDT 📊 Dominant Theme • Operation Epic Fury and Iranian Hormuz restrictions continue to threaten ~20% of global crude supply, with tanker traffic sharply curtailed • Brent ~$112+, WTI ~$95–96 range; sustained stagflationary pressure through elevated energy input costs • February labor data notably soft: nonfarm payrolls -92k miss, unemployment 4.4% • Fed holding restrictive stance with limited 2026 cuts priced; energy shock complicates policy path • GDPNow Q1 holding steady at ~2.7% (as of Mar 13; update expected today) • ISM Manufacturing PMI 52.4 (Feb; expansionary, prices paid 70.5 on energy/tariffs) • Recession probabilities remain modest (~19% NY Fed model); energy equities providing tactical offset, yet geopolitical risks tilt outlook toward higher inflation and slower growth 📈 Indicator Snapshot Yield Curve — Neutral + High Conviction • Positive spread continues to support soft-landing narrative in the near term; modest near-term flattening reflects geopolitical volatility Labor — Bearish + Medium Conviction • Headline payrolls and unemployment show clear softening; directional trend negative but recession signals not yet triggered Leading Indicators & Probabilities — Bearish + Medium Conviction • Models and market pricing indicate contained but elevated downside risk for 2026 Growth & Activity — Neutral + High Conviction • Real-time tracking and manufacturing surveys demonstrate resilience despite rising cost pressures 🔍 Key Levels • 10y-2y Treasury spread: ~0.50% • NY Fed recession probability: ~19% • Sahm Rule: 0.27 pp (Feb 2026; eased from 0.30 prior month, below 0.50 trigger) • Unemployment rate: 4.4% (Feb) • GDPNow Q1 2026: ~2.7% (as of Mar 13; update expected today) • ISM Manufacturing PMI: 52.4 (Feb; prices paid 70.5) • 10-Year Treasury yield: ~4.20–4.28% • Next major release: April employment report (~Apr 3 est.) ⚠️ Top Risks • Prolonged Hormuz disruption or escalation driving oil above $120 and accelerating stagflation • Quicker labor-market deterioration triggering Sahm Rule breach • Fed policy miscalibration (prolonged hold on inflation versus premature cuts) • Sharp consumer spending contraction from higher energy costs • Secondary supply shocks or deeper contraction in leading indicators 💡 Executive Implications • Maintain strategic overweight in energy (XLE, integrated majors, midstream) as core stagflation hedge • Layer targeted inflation protection via TIPS, broad commodities, and selective gold/Bitcoin exposure • Immediate monitoring triggers: Hormuz tanker flows, next CPI energy component, April payrolls • Prefer shorter-duration fixed income; increase volatility preparedness if conflict extends • Tactical derisk thresholds: sustained Brent above $120 or Sahm Rule breach; potential relief rally on de-escalation or shale response © 2026
@g_a_f
| Not investment advice. $btc $spy $qqq $iwm $xle $gld $slv
See More
Last Seen Users on Sotwe
CROOTIN SYG 💦
Seen from
Indonesia
สาวใหญ่ชอบให้เลียหี
Seen from
Thailand
سيوفي ابن حنان 🇮🇶
minatsuki
Seen from
Indonesia
佐佐
Seen from
Germany
Pusaka.Nusantara
Seen from
Malaysia
Sexy Vixen
Seen from
India
pecinta binor
Seen from
Singapore
Kelsi Monroe
Seen from
United States
Jay Boogie
Seen from
Germany
Trends for you
1
Spence
Under 10K tweets
2
Mead
Under 10K tweets
3
Ghost Rider
Under 10K tweets
4
Damson
Under 10K tweets
5
The Long Walk
Under 10K tweets
6
Chadwick
Under 10K tweets
7
#Toonami
Under 10K tweets
8
Secret Wars
Under 10K tweets
9
Nats
Under 10K tweets
10
Thad Jean
Under 10K tweets
Most Popular Users
1
Elon Musk
@elonmusk
241M followers
2
Barack Obama
@barackobama
119.2M followers
3
Cristiano Ronaldo
@cristiano
112.1M followers
4
Donald J. Trump
@realdonaldtrump
111.8M followers
5
Narendra Modi
@narendramodi
107.1M followers
6
Rihanna
@rihanna
98M followers
7
NASA
@nasa
92.2M followers
8
Justin Bieber
@justinbieber
91.3M followers
9
KATY PERRY
@katyperry
88.5M followers
10
Taylor Swift
@taylorswift13
82.4M followers
11
Lady Gaga
@ladygaga
73.9M followers
12
Virat Kohli
@imvkohli
71.2M followers
13
Kim Kardashian
@kimkardashian
70.2M followers
14
YouTube
@youtube
68.7M followers
15
Bill Gates
@billgates
64.4M followers
16
Neymar Jr
@neymarjr
64.1M followers
17
The Ellen Show
@theellenshow
62.4M followers
18
CNN
@cnn
61.8M followers
19
Selena Gomez
@selenagomez
61.6M followers
20
X
@x
60.8M followers
Olivia
Online
✨
⭐
💫