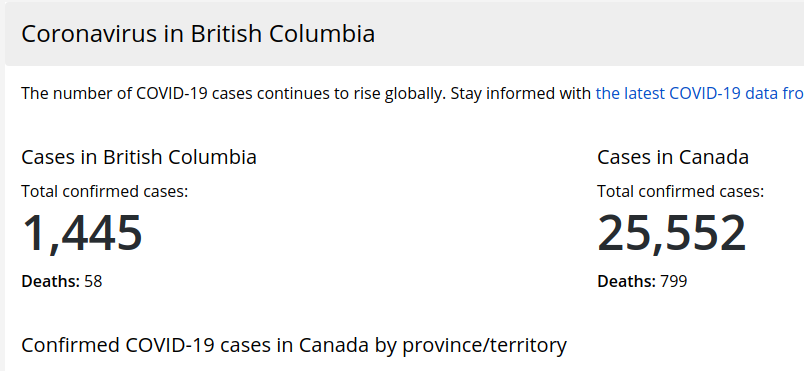
@OrcSorcerer @JamesRobertsCBC @DanDicksPFT oh ..thanks , I thought u got the raw data source ..3.1% comes from CBC reports : 25552 confirmed cases / 799 deaths ..which pulls data from J Hopkins which pulls data from Canada Health ..not clear why CBC doesn't pull directly from Canada Health Agency..thx u👍
@OrcSorcerer @JamesRobertsCBC @DanDicksPFT can you point me to the source of that ? I get the numbers, daily, from the Public Health Agency..and the mortality rate/confirmed cases should be ~ 5.1% ;
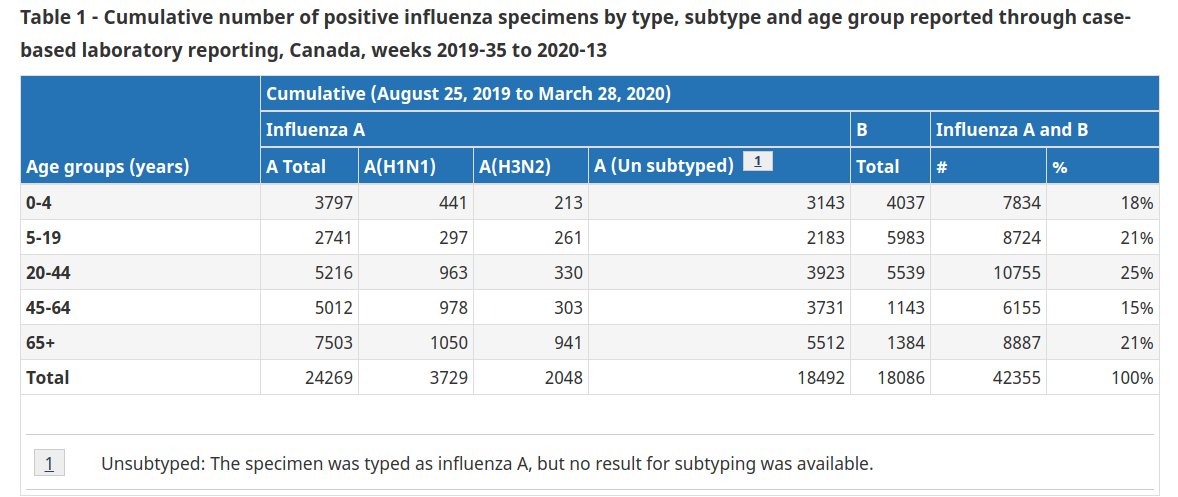
@EdtheSock@DanDicksPFT They do have a point, you know..although they lack the mathematical argument ...influenza 2019-today: 42,335 / CoVid-19 since 4 Feb 2020-today: 14,151 ..source: https://t.co/DU1jjLkcLo and https://t.co/Cgvc5gvKdC
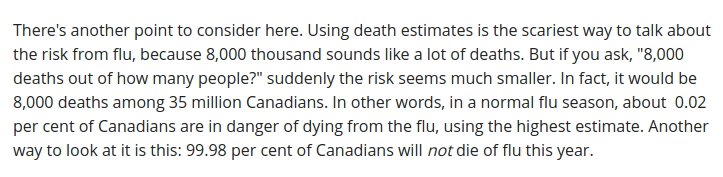
@adamnutts @SarahAlyshia @RMComedy @DanDicksPFT I doubt u even read the article in detail ...being frugal won't help in understanding the underlying issues ...it shows a wrong modus operandi when collecting vital data..the article written in 2012 by CBC exposed the flaws..fast forward 2020 ..
@adamnutts @SarahAlyshia @RMComedy @DanDicksPFT ?? sorry , caught what ? misrepresenting data is a major flaw ..we cannot afford mistakes to be made at this level..not when lives are at stake ..data science have very strict rules.. wrong data in , wrong decisions out.
@SarahAlyshia @RMComedy @DanDicksPFT Coronaviruses makes a subfamily called Orthocoronavirinae...Influenza subfamily is called Orthomyxoviridae...not the same. The procedures of collecting and classifying the data are unchanged..unfortunately
@zookmann@abytw @FabPurpura @DanDicksPFT there are other sources for rx studies ...it's about the content not the form ...scientist don't waste time on graphics...wanna know where all the data behind the nice and colored graphs comes from ? here it is J Hopkins UC repository: https://t.co/dY88Q8csUL