Good morning ☕️
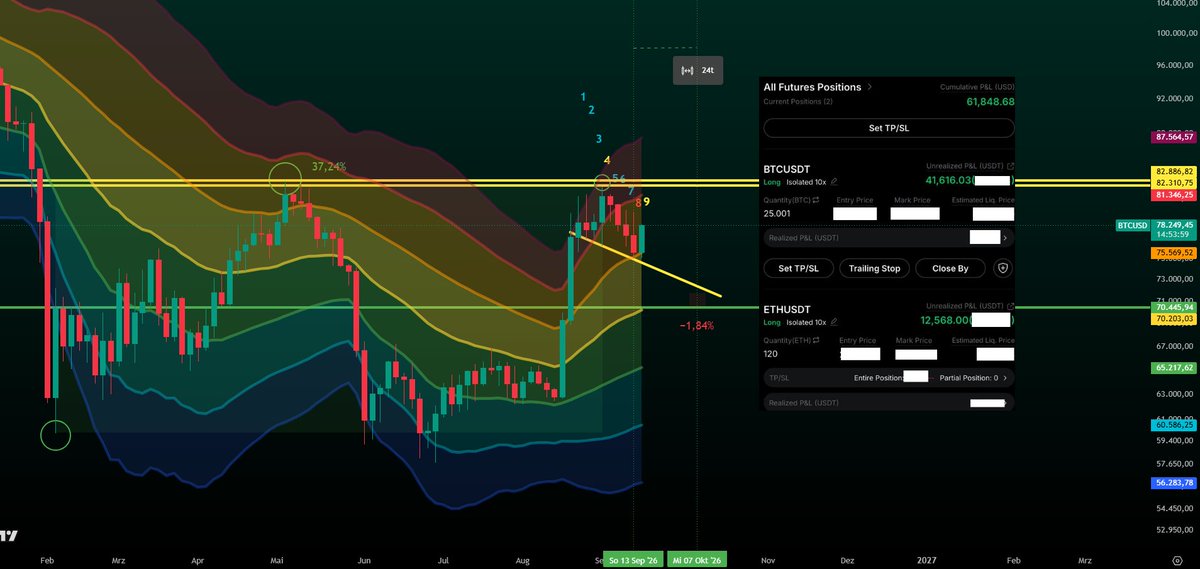
As I said, there is a chance that Bitcoin goes below the green TEM zone, exactly like it did in 2023, before pumping back to the previous highs.
Bitcoin printed a wick below the green zone today.
Bitcoin could go sideways toward 85–87k from today, but i doesnt mean to play out like that on the LTF.
There is also a chance that $87,330 was the top. 🚨
This is a high-timeframe (1W) pattern!
Delays or deviations may occur on lower timeframes than 1W.
If Bitcoin reclaims the $86,800–$87,300 zone, I will open a short position.
If Bitcoin drops toward $79,800, I will open a long position and rebuild my swing long from $79,800 down to $70,500, with a max target of $67,500.
Next week should turn bearish.
Bullish sentiment will break, and the same bears that flipped bullish will turn bearish again. ⌛️
What I expect over the next two weeks:
Scenario 1:
From Sep 28 to Oct 7, a dump to $79k, hold $79k.
From October into November, road to $99k–$106k.
Scenario 2:
Dump to $79k, 5% bounce, then dump back to $70.5k into Oct 12.
After that, pump toward mid $90k's by November.
It doesn't necessarily mean it has to happen again!
After Bitcoin formed a lower high in 2023 after 1 day and 20 hours, it moved sideways to the downside for 8 hours and then continued its rally to form a higher high, which then triggered the dump.
As already mentioned in my previous post, a lower high at $87.2k was planned for Wednesday 10 a.m. (it happened at 6 a.m. though, 4 hours earlier than expected).
If this scenario repeats on the LTF, you can see what to expect.
If Bitcoin repeats it 1:1, a wick below the green TEM zone is still possible.
There is also a chance that $87,330 was the top.
If Bitcoin pumps this week, I think next week will be horrible for the late longs, the perfect trap.
Build liquidity over the weekend and dump!
The same bears who were still short last week before Monday are now long. ✅
The crowd missed the bottom and only now piles in at the top. ✅
First they flip the bears into bulls, then pump it over 83k so the latecomers know the bull market is officially confirmed, then dump it. ⌛️
Only 3 days left, the next week should be red. ⌛️
Late longs get wrecked, not a theory, that is the pattern. Fear at the bottom turns into greed at the top.
Greed at the top turns back into fear at the bottom. Show up late and you get crushed in the middle.
The chart is not the problem, the herd’s timing is. 🎯
Since this is a high-timeframe (1W) pattern, delays or deviations may occur on lower timeframes than 1W.
It doesn't necessarily mean it has to happen again!
bitcoin:native
When in 2023, in the same area (marked by the yellow line on the LMACD), the weekly LMACD printed a bullish crossover, ETH pumped 25-26%.
Measured from the last weekly candle inside the green zone of the TEM, ETH found its peak within 35 days.
If the same percentage move repeats from the crossover point, the target sits at $3,069–$3,300.
Or the top is in.
ethereum:native
As mentioned in the previous post, I said Bitcoin would pump back toward the $87,000–$88,000 range by Wednesday. ✅
Comparing 2023 directly with 2026, Bitcoin reached level on the first high (currently 87.3k+), printed a lower high on the second attempt, and then formed a higher high on the third.
I expect Bitcoin’s final pump this week, by Friday at the latest.
Whether that results in a higher high or a lower high remains to be seen.
I will be incorporating this price zone into my short positions.
If the pattern on the lower timeframe were to repeat with such precision, it cannot be ruled out that Bitcoin will print a higher high by Friday.
If the percentage intervals between the respective highs repeat only partially, the $88,000–$89,400 range would be the maximum I expect.
Prices above $89,400 would imply that Bitcoin could see a fast move toward the $90,000–$94,000 range.
" Measured from the point where the black bar left the overheated zone, it took exactly 20 hours for Bitcoin to reach its peak before the dump in 2023. The difference this time is that Bitcoin entered the overheated zone twice in 2026, so it took another 20 hours to form the next top.
If the pattern repeats 1:1 without any deviation on the lower timeframe, Bitcoin could go sideways and drop a bit before pumping back to 87/88k and then dumping at the start of next week or the top was already formed at 87,330. "
bitcoin:native
Measured from the point where the black bar left the overheated zone, it took exactly 20 hours for Bitcoin to reach its peak before the dump in 2023.
The difference this time is that Bitcoin entered the overheated zone twice in 2026, so it took another 20 hours to form the next top.
If the pattern repeats 1:1 without any deviation on the lower timeframe, Bitcoin could go sideways and drop a bit before pumping back to 87/88k and then dumping at the start of next week or the top was already formed yesterday at 87,330.
Since this is a high-timeframe (1W) pattern, delays or deviations may occur on lower timeframes than 1W.
It doesn't necessarily mean it has to happen again!
bitcoin:native
I was right, once again. 🎯
Bitcoin hit $82,000.
Voilà. 🌹
As soon as the black bar left the overheated zone on the Paranoia Indicator, it pumped and Bitcoin made a new local high in about 20 hours.
If the pattern repeats, a rejection could occur at $82,000/$83,000 and we could see Bitcoin this week between $78,000 and $83,000 before it drops back toward $70,500.
Pump and dump.
If it rejects here, I’m looking for $73,300–$70,500 between Sept 28 and Oct 7.
Once Bitcoin breaks through that rejection with power, I’m very confident $87,000–$88,000 is the next target.
It doesn't necessarily mean it has to happen again!
Since this is a high-timeframe (1W) pattern, delays or deviations may occur on lower timeframes than 1W.
bitcoin:native
I already said in my earlier post that I expected the Saturday top and that Bitcoin would be sitting in the red zone of the Paranoia Indicator.
A small correction after that is also visible on the chart.
I’ve observed that when the black bar left the red zone in 2023, the pump continued.
I’m seeing the exact same pattern today.
It takes roughly one day from the first breakout point to the local top (marked with green circles).
The funny part is that the timestamps match exactly, in 2023 the local top formed at the same time of day as yesterday, Saturday 2026.
After that came a correction into the yellow zone of the TEM, and at the same time the black bar left the overheated area of the Paranoia Indicator.
It can’t be ruled out that Bitcoin drops again toward $79,800–$78,500!
Should that happen, I’ll enter new scalp positions before the move toward $82,000 continues.
Since this is a high-timeframe (1W) pattern, delays or deviations may occur on lower timeframes than 1W.
It doesn't necessarily mean it has to happen again!
bitcoin:native
Dear bears, the bear market is over and i appreciate your patience and your money. 🐻
Took $100,000 off the table as realized profit from the long.
I previously closed the long position for a $290,000 profit.
Together with the $100,000, I’m simply at $390,000.
It’s all public, by the way.
Trade what you see, not what you think. 💯
The rejection zone remains $82,300–$83,800.
If that rejection holds, selling continues and price drops toward $70,500.
That is still the base case.
A smaller long position stays open in case the rejection fails and Bitcoin drives hard into $85k–$86k.
The next high could form between today and Monday. ⌛️
The $85k–$86k zone is the exact percentage extension, but only if the 2023 pattern repeats by percentage.
In 2023 Bitcoin rejected at its former high.
That is exactly the scenario I expect, the May high gets tested and a rejection takes place.
Rule number one: always protect your capital. 🎯
We’re in the early stage of a bull run.🖐️
Another trade, another win. ✅
bitcoin:native
I was right again and I’ve been right for months.
For weeks, I’ve been showing you the perfect pattern, daily, with high precision on the LTF.
Here’s a beautiful 3D view!
Calling $62,200 as the final low. ✅
We’re in the early stage of a bull run. ✅
🔮
Bitcoin could face rejection around $82,000–$83,000 and slowly dump back toward $70k–$71k. ⌛️
As soon as Bitcoin pumps even a little above $82,300, the bears will know the bear market is officially over.
750 days after the halving we’ve only ever printed a new high when the bear market was already finished and the bottom was already in.
bitcoin:native