@TripleDTrader Love how you and Christian @cfromhertz post your numbrers triple D. Since 3/4 of the year is in the book, if you don't mind, how does your YTD number look, (I'm gonna guess 20%-25% ) 🙂
Last wk, S&P/Nas/Mag7 +0.4%/+0.1%/-0.8%. Cooler inflation (CPI, PPI) & economic data (consumer sentiment, retail sales) but +5% oil steepened the yield curve but lowered odds of a rate hike.
Looking forward, I continue to believe the impact of Agentic AI with the advent of OpenClaw on January 30th has at least a year to run:
1) Token production has gone up roughly ~7.5x from the end of January more than offsetting the nearly 50% token cost reduction seen since open-weight model usage started to take off in May.
2) Combined annualized run-rate revenues for OpenAI and Anthropic which ended last year at $29B seems to be around $100B currently with Anthropic getting profitable in Q2.
3) Capex from the Big6 hyperscalers accelerated from 84% y/y/ in CQ1 to 92% in CQ2 with forecasts for nearly 100% in Q3. But this is being supported by cloud revenue growth at the 3 Big Public cloud vendors of $AMZN $MSFT $GOOGL accelerating from 23% y/y in Q1:25 to 35% in Q1:26 to 43% in Q2:26. Arguable more important is public cloud operating margins expanded from 34% to 37% and 39% during those time periods.
4) The $500B financing deal backstopped by up to $125B from $NVDA adds even more lower cost money to fund AI capex spend for the non-hyperscaler players. Nvidia gained 0.5% last week.
5) The liquidation of Situational Awareness and retail accounts during July cleared out some of the frothiness in the AI related names
In terms of negatives:
1) The cost of money (yields on government bonds) remain near the highest levels for the 30 yr tenor at 5.3% since 2007.
2) Given large scale offensive US military actions are seemingly off the tablein favor of financial sanctions, probably driven by current election polls, I now believe Iran is likely to hold the Strait of Hormuz hostage until past the US mid-terms. This would be akin to them releasing the US hostages in 1981 (they were held for 444 days) just hours after President Reagan was sworn in replacing Carter. There were severe financial sanctions then also.
3) Since 1990, which happens to be the Gulf War, from the end of July through November 9th, which covers the reaction to all mid-term results, the performance is worse than non mid-term years. For mid-term years the median S&P500 gain from 7/31-11/9 is 0.9% with gains 56% of the time but the median peak loss from 7/31 is 6.2% (intra-period median peak loss of 9.9%.) For non mid-term years the median gain is 2.7% from 7/31-11/9 with gains 59% of the time and the median peak loss from 7/31 is 3.5% (intra-period median peak loss of 5.2%.) This year with the momentum seen by the Socialists which are not big business friendly, I see more risk than normal.
4) The easy money on the AI technical rebound from oversold levels on 7/29 due to the forced sale by Situation Awareness is probably over. There were negative stock reactions to headline beat and raise earnings on both revs & EPS for AI infrastructure winners $CSCO (-8% for the week but still up +45% YTD), $AMAT (-6%/+97%) and $COHR (-14%/+77%). While negatives can always be found, their biggest crime was arguably their recent bounce from 7/29-8/7 of 8%, 24% and 71% respectively and their market beating YTD gains.
In summary, I remain bullish. Even from the end of July through November 9th during mid-term years since 1990, the S&P has an additional median gain of 4.2% to its peak before giving some of that back closer to the election. Given some of the negatives, especially the reaction to solid earnings data, I would add some hedges back on further market gains and get more selective. Consumer discretionary hedges should also make sense if oil is higher for longer.
I believe value should continue to accrue to the infrastructure layer which includes 1) the public cloud vendors such as Amazon, Microsoft, Google and 2) the semiconductor companies. $INTC, my favorite semi company, still gained 0.8% last week despite: 1) a $20B equity offering which causes ~5% dilution and 2) being up 178% YTD. This clears the funding overhang.
All the best in the week ahead.
I initiated a position in $BE in the Family Portfolio today.
My thesis centers on access to power as one of the biggest constraints facing the AI infrastructure buildout and a bottleneck that should only intensify as falling AI costs drive greater usage and demand.
That bottleneck gives Bloom’s speed-to-power a massive advantage and the opportunity is massive but I will say that the short report also raised legitimate questions around scandium supply.
CEO K.R. Sridhar responded by saying Bloom has visibility to support ~25 GW of deployments, is not dependent on China and believes theres enough economically recoverable scandium to support the market (response was encouraging but it doesn't provide complete external verification).
I still lack full transparency into scandium requirements per gigawatt, Bloom’s inventory or contracted supply, where the material originates and how the economics change as production scales which is why I'm keeping the position speculative.
Last wk S&P/Nas/Mag7 +1.0%/+1.6%/+4.7%. The forced asset sale by Situational Awareness helped drive a sharp rally on 7/30.
On 7/29, I wrote, “From a technical standpoint, I believe forced liquidations and margin calls in both retail accounts and hedge funds that typically run with leverage over the past couple of weeks is leading to a technical bottom… In summary, my view is that we could have seen at least a short-term bottom today with a strong rally ahead of us in the sectors most caught in the latest speedbump.”
On Thursday 7/30, the Morgan Stanley TMT (Tech Media and Telecom) Momentum Index rebounded a record 19% on Thursday and added another 1% on Friday. This followed a decline of 54% from 6/22-7/29. It is now down 44% from 6/22. This is why I focus on avoiding “speed bumps” as I warned about on my 6/20 post. It is hard to predict how bad they will be and down 50% requires a 100% gain to get back to even. I feel like the near-term low on the current speedbump was seen on 7/29.
Looking at Mag7 results this earnings season, stock reaction to earnings results mostly came down to two factors: 1) did estimates go up for CQ3 if capex went up and 2) did you report results before or after the Situational Awareness (SA) forced sale.
$MSFT results strengthened my recent view that co-Pilot could be a winner in enterprise AI longer-term. As I wrote in my earnings preview. “It operates natively within the Microsoft 365 ecosystem where enterprise work already happens.” There are ~450M M365 paid seats but only ~30M Co-Pilot. Microsoft guided above consensus for CQ3 while capex remained unchanged. Azure also saw growth improve sequentially from 39% to 43% y/y with guidance to 45% for CQ3. Helped by the SA forced sale, the stock saw the 5th highest one day percentage stock move in history at +16% on Thursday.
$META unfortunately had both revs & operating income go down for Q3 while revising up capex & opex. They also did not announce any definitive plans around a public cloud offering or API for their foundational models to monetize this spend. The stock declined 8% in reaction on Thursday which likely would have been worse if not for the SA forced sale.
$AMZN while guiding both revs & operating income below consensus for Q3 and increasing capex, had AWS rev growth accelerate from 28% in Q1 to 37% in Q2 which was the highest growth rate since Covid in Q4:2021. AWS normalized operating margins expanded 1% sequentially. The stock rallied 15% on Friday in reaction to earnings following a 4% rally on Thursday as investors continued to regross in the AI names.
But this brings me to $GOOGL which remains my long-term winner in consumer AI with the complete AI stack. Google like Amazon guided capex higher while implied revs & operating income declined for Q3. But Google Cloud Platform performance crushed AWS performance. GCP saw revs accelerate from 63% in CQ1 to 82% in CQ2 while operating margins expanded 3% sequentially. But Google unfortunately reported a week prior to the SA forced sale and saw their stock decline 7% in reaction the next day.
$AAPL was the anti-AI trade leading up to their results and their stock hit an all-time high intra-day on Wednesday. The stock as a result declined 1% on Thursday as investors regrossed AI names on the SA forced sale and fell 7% on Friday in reaction to revenue & gross margin guidance that was below consensus.
Big picture, I think the severe drawdown in the AI favorites from 6/22-7/29 was good for the market. It reminded investors of the need to be vigilant and the perils of excessive leverage/risk taking. Long-term bond yields hitting new 20 year highs last week and the unresolved Iran war are factors I am monitoring.
In summary, out of the mega-cap earnings the past two weeks and the forced SA sale, my favorites are $GOOGL, $AMZN and $MSFT. I increasingly view value as shifting from the model layer which is increasingly getting commoditized to the infrastructure layer which includes the public clouds. I think the short-term bottom in the current speed bump was on 7/29.
Best of luck in the week ahead.
Forced liquidations due to excess leverage typically mark near-term historical bottoms. Situational Awareness at ~4x leverage & over $20B in assets at its peak is now wound down. While I heard there were at least 3 other funds in trouble, today’s rally may have fixed their issues.
I also wanted to put today’s rally in context. I gave the stats in my post yesterday about the historic meltdown and why “In summary, my view is that we could have seen at least a short-term bottom today with a strong rally ahead of us in the sectors most caught in the latest speedbump.”
The 10.7% rally today in the Morgan Stanley Momentum Index beats all but the 11.1% gain on 4/3/2001 during the dotcom bust. All the other moves in the top 10 occurred during either Covid (3x), the GFC (2x) or the dotcom bust (3x).
For the more concentrated Morgan Stanley TMT (Tech Media & Telecom) Momentum Index today’s gain of 19.1% crushes the prior 11.9% gain seen on 12/5/00 during the dotcom bust. 5 of the other top 10 gains were seen just since November of 2025 during the recent meteoric rally. There were 3 more during the dotcom bust.
While some give back is certainly likely in the days ahead given the ferocity of this one day move, I believe we have seen the near-term bottom yesterday due to the forced liquidations. I am hopeful the “speedbump” I started expecting back on my June 20th post is now behind us. Getting oil prices back into the $70 range with a decline in bond yields would certainly increase the odds even more.
I believe we are still early in the adoption of Agentic AI and the 10-100x increase in tokens needed since January relative to Chat-based AI.
@TripleDTrader This is wild ….but the whole thing was done overnight in one trade to some large hedgefund according to David Faber yet we were going down for couple of weeks. …we need to dissect this on premarket prep tomorrow.
Given a couple of my friends misunderstood my short tweet yesterday, let me clarify. My post on Hynix was to acknowledge a datapoint for those calling THE TOP of the AI cycle.
I believe it is important as an investor to not just focus on what is supportive of your investment case but even more so to focus on what is directly against it, especially if it is a universally acknowledged loved idea like AI.
Having said that, let me be clear. I still strongly believe this is a “speedbump” which is what I have been writing about since my original post on June 20th.
But a “speedbump” can be ugly as I have pointed out before. Starting in both late 1995 and 1997 there were drawdowns of over 50% in the semiconductor index. But the semi index finished up roughly 850% from the end of 1994 to the peak of the internet buildout in March of 2000 despite this.
Also back then, those drawdowns had fundamental drivers. In 1995, Windows 95 did not lead to the upgrade cycle expected and companies were sitting on a bunch of DRAM inventory. Intel wrote off about $1B in DRAM inventory as an example. There is no excess memory inventories on balance sheets today.
In 1997, the Asian currency crisis forced a slowdown in end-demand. The Iran war and continuation of the Ukraine conflict are both disruptive but there is no general slowdown in demand being caused by them that I can see.
From a technical standpoint, I believe forced liquidations and margin calls in both retail accounts and hedge funds that typically run with leverage over the past couple of weeks is leading to a technical bottom.
From June 22nd, the peak of the momentum trade, the S&P is down only 2.1% and the Nasdaq is down 6.6%. But the SOX index (the tip of the spear in the AI trade) is down 28.6%, the Morgan Stanley Momentum Index is down 38.0% and their Momentum TMT (tech, media and telecom) Index is down 53.5%. The ferocity of these moves in roughly one month has never been seen before in some cases. I believe this has sped up the cleansing process with prime brokers not wanting another Archegos situation.
From a fundamental standpoint, the advent of Agentic AI started arguably at the end of January 30th with the formalization of OpenClaw. This requires 10-100x more tokens than chat-based AI. No question that token minimization is going on at the top 1% of companies which was the main reason for my speedbump concerns but the other 99% are still ramping.
In summary, my view is that we could have seen at least a short-term bottom today with a strong rally ahead of us in the sectors most caught in the latest speedbump. Time as always will tell.
$AAPL and $MU are now in a major lobbying fight over memory chips.
Apple wants the White House to clear CXMT supply for non-US products and calls Micron’s 80% margins gouging while Micron says buyers like Apple starved suppliers and built the shortage that quadrupled prices.
@FurtherPR1@SchwabNetwork@sam_vadas@MarleyKayden@stocktradernet@TripleDTrader I watch Schwab very often, will deffinetely tune in Triple D. Oliver is gone, but Nicole, Sam, Marley are a joy to watch (especially on up days 🙂) for those who don't know Schwab's live feed is available to watch on their thinkorswim app, as well as YouTube (schwab network live)
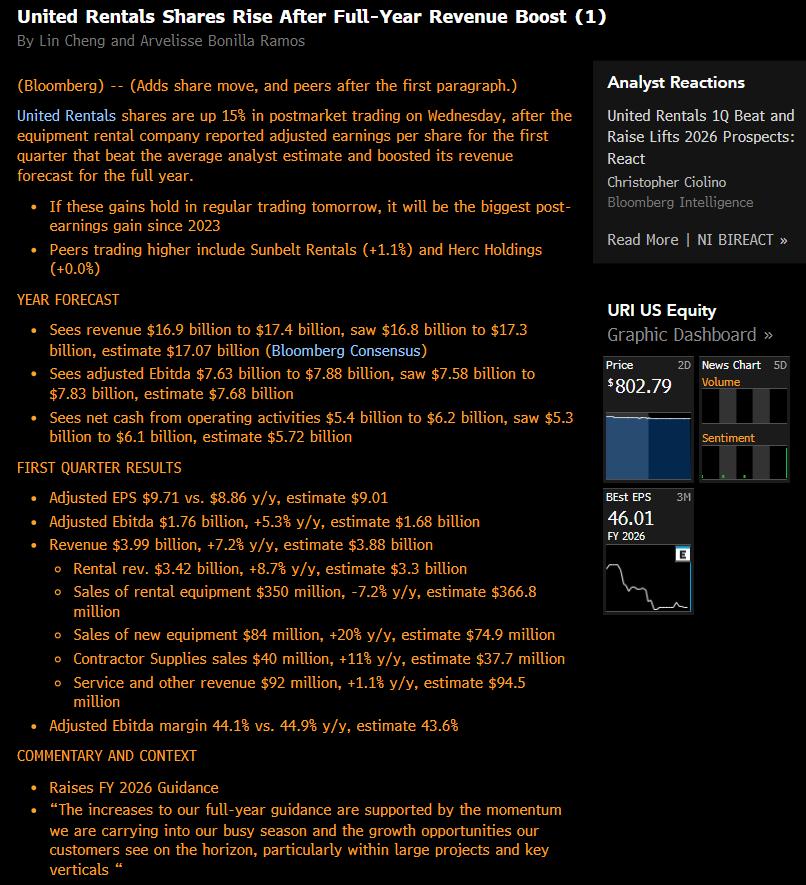
$URI United Rentals Shares Rise After Full-Year Revenue Boost (Bloomberg)
shares are up 15% in post market trading on Wednesday, If these gains hold in regular trading tomorrow, it will be the biggest post-earnings gain since 2023
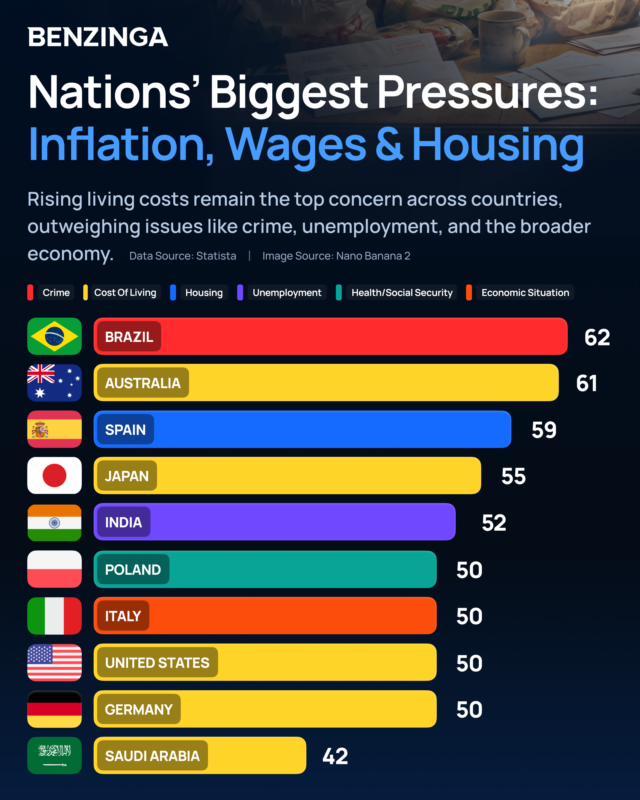
Rising living costs are still the biggest pressure across much of the world.
Brazil tops this list overall, while cost of living leads in countries like Australia, Japan, the U.S. and Germany.
What do you think is the biggest pressure people are feeling right now?