Methodology: The Noll-Scully ratio measures competitive balance by comparing the actual spread of team winning percentages to what we’d expect if every game were a coin flip.
A ratio of 1.0 represents perfect parity, with higher values indicating less parity.
In 2026:
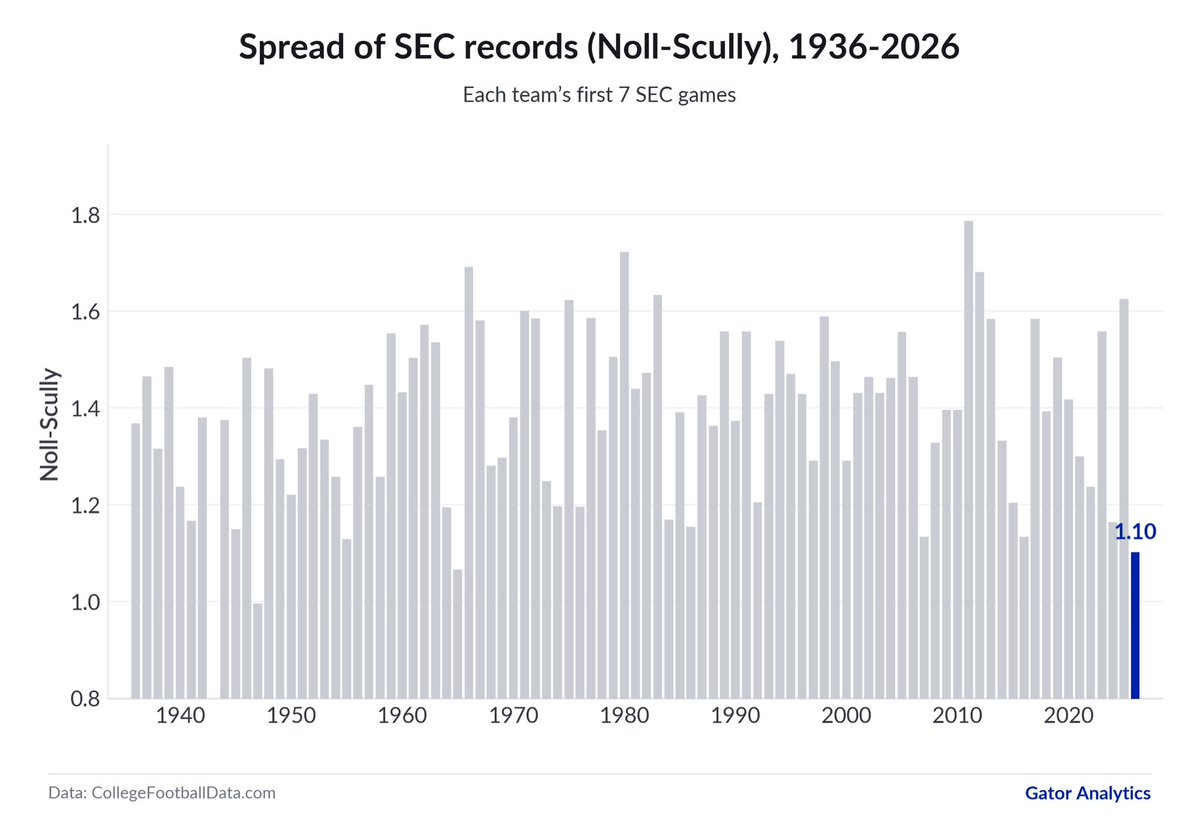
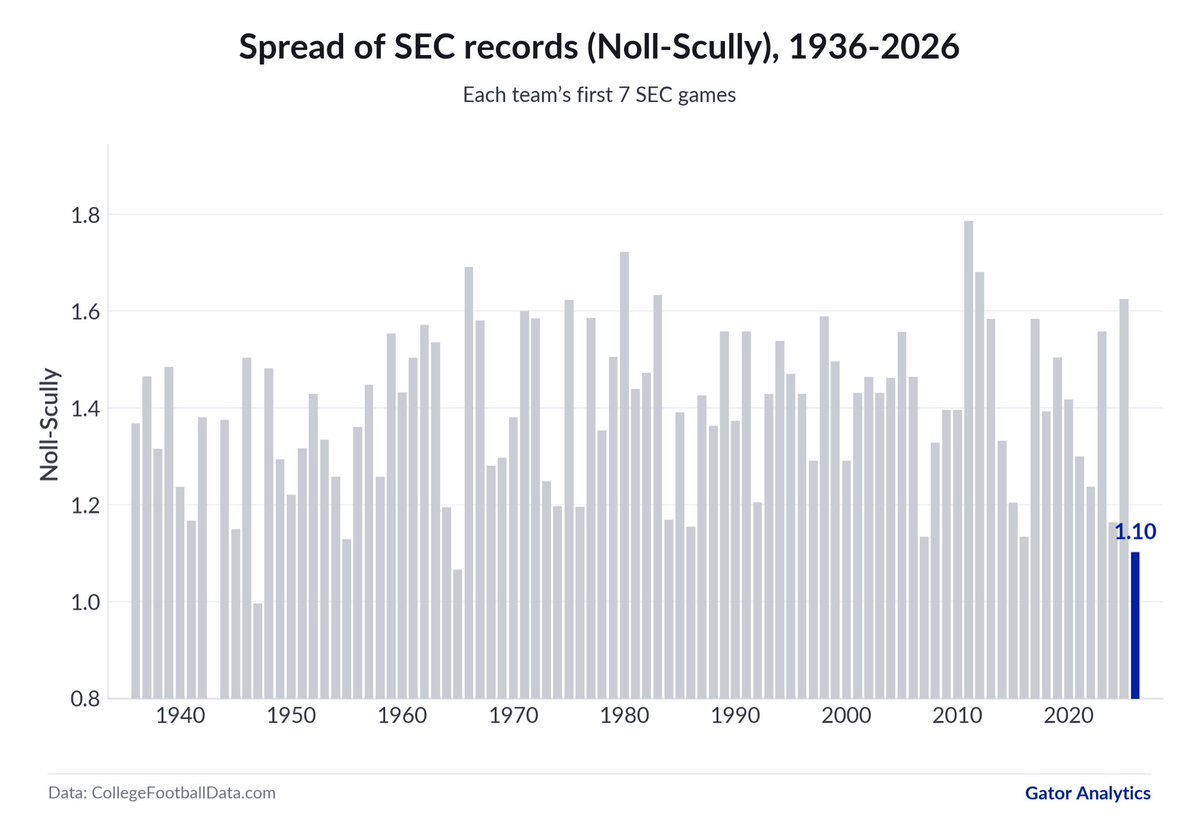
SEC: 1.10: lowest since 1965.
FBS: 1.33: lowest since 1963.
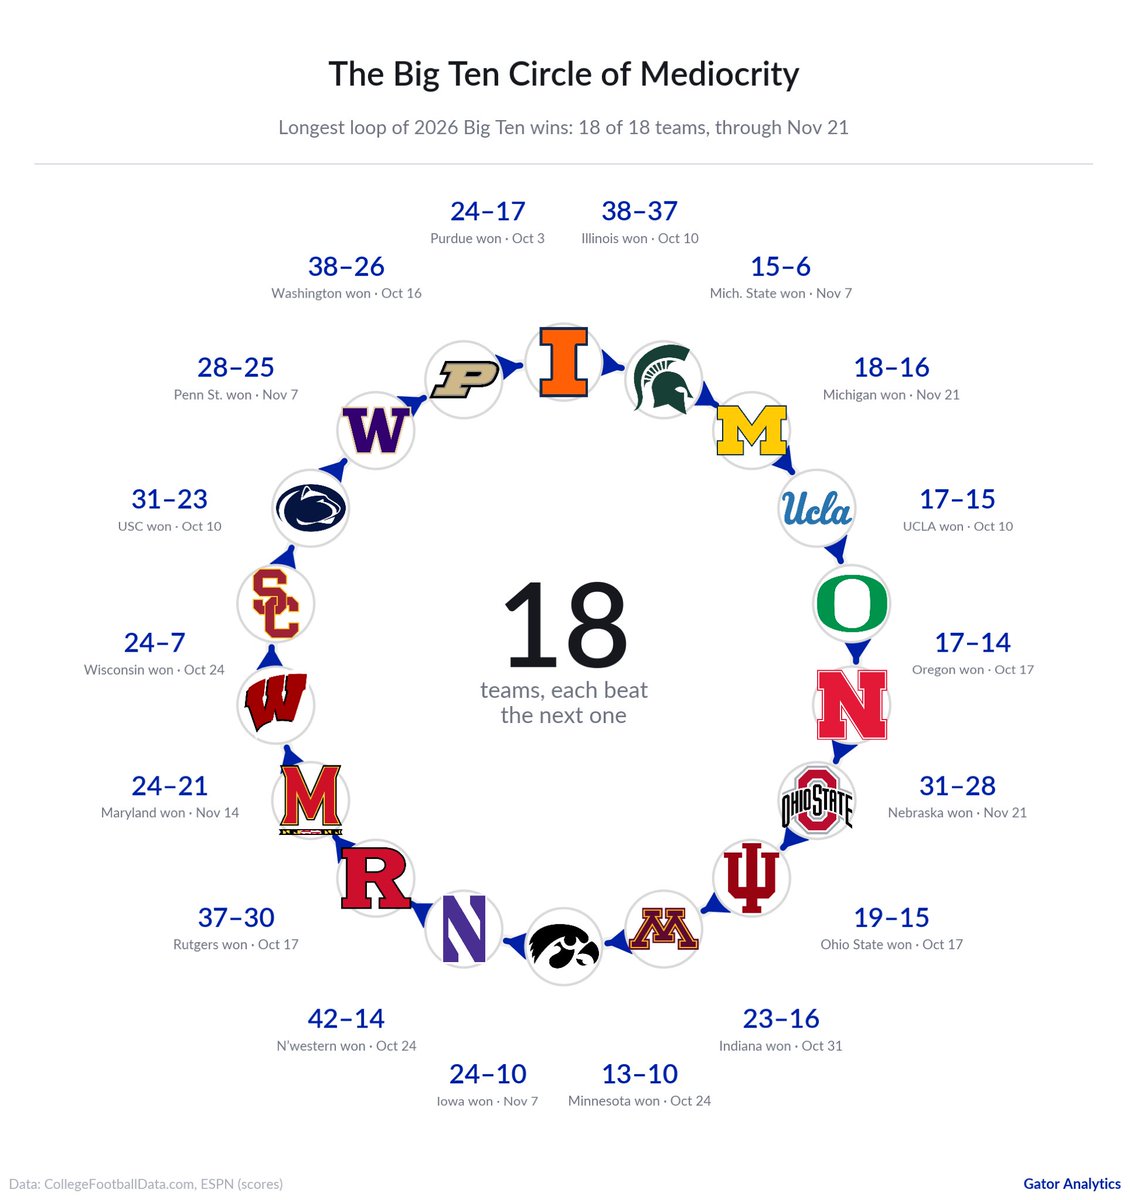
There just aren’t that many easy games anymore.
I posted the SEC chart yesterday, but wanted to include the FBS comparison to emphasize just how unusual this season is.
Both the SEC and FBS have arguably their most parity in 50 years. Comparable seasons go back to the 1960s, with fewer teams and ties still allowed.
For Sumrall to go 7–4 so far in this environment in Year 1 is impressive.
This shows how Florida performed in each half against Vandy, ranked against ALL SEC team halves this season.
Florida’s defense went from the 3rd percentile in EPA per play allowed in the first half to the 92nd in the second.
From one of the SEC’s worst defensive halves this season, by that metric, to one of its best. Great halftime adjustments 🐊
For me, today was the deciding game in whether I’d consider this a successful first season for John Sumrall.
With that win, Sumrall finishes with a winning SEC record, something Billy Napier never accomplished at Florida.
A loss would’ve felt like more of the same. Ill take it.
Fun fact: at this point in the season, the 2026 SEC has the third-most parity in conference records since 1936, behind only 1947 and 1965, according to the Noll-Scully metric.
SEC teams are beating each other at a rate that has produced one of the tightest conference standings in 90 years.
Methodology: The Noll-Scully ratio was developed by sports economists Roger noll and gerald scully to measure competitive balance in sports leagues.
I compared the actual spread of SEC winning percentages to what we’d expect if every game were a 50/50 matchup.