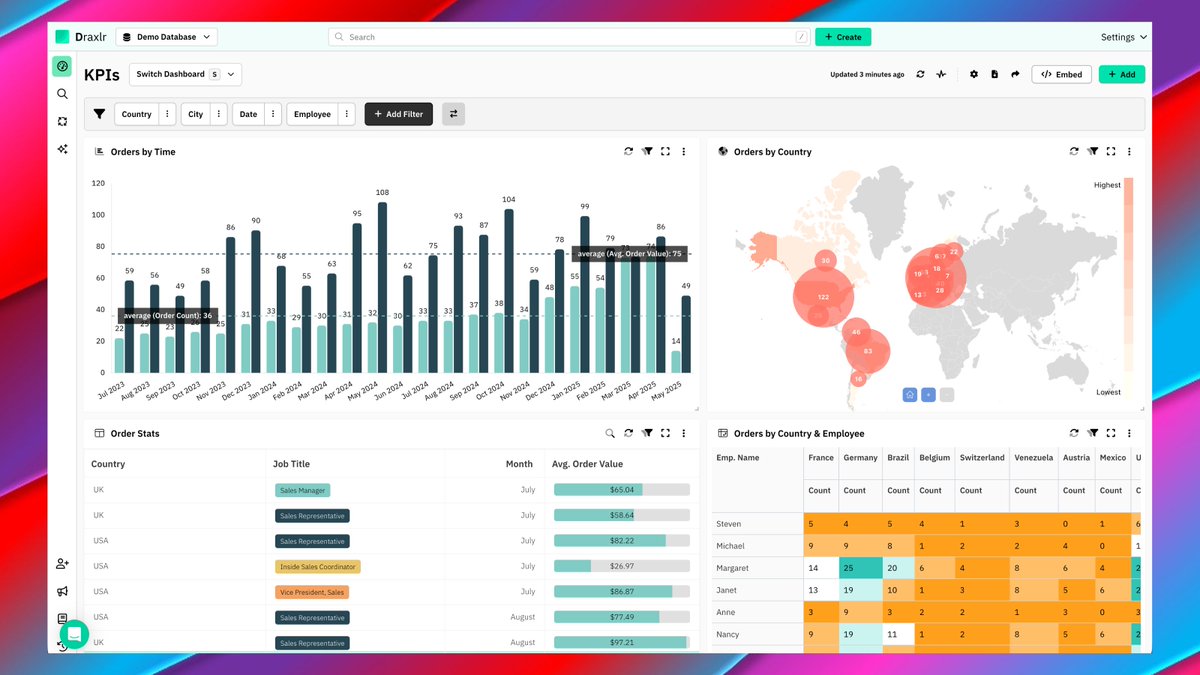
AI-powered SQL dashboards are genuinely insane right now.
just told it what I wanted, it built the chart, styled it, and dropped it straight into my dashboard
took less than a minute 💀
Most teams don't need the same dashboard summary.
But most BI tools make you choose one report, one list, one filter.
Here's how Multiple Dashboard Email Schedules in Draxlr solves this:
1. Create multiple summaries from a single dashboard
2. Assign a different email list to each summary
3. Pre-apply filters so each team only sees what's relevant to them
#Draxlr #SQLDashboards #DataAnalytics #BusinessIntelligence #SelfServeAnalytics #AIPowered
@supabase@neondatabase@databricks@PostgreSQL
AI is only as good as the context you give it.
Draxlr's AI Context Training lets you paste your docs so it understands your schema & business logic first.
Better context → better SQL. Every time. 🧠
@neondatabase@supabase@databricks
#Draxlr #AIPowered #AIForData #DataAnalytics #BusinessIntelligence #SQL #SelfServeAnalytics
Really excited to partner with @supabase and make it easier for teams to turn their database into clear, actionable dashboards.
Thanks for the shoutout 🙌
Draxlr allows you to build advanced dashboards to analyze your database!
We have partnered with them so that you can connect your Supabase Database with a click of a button. Learn more in this article:
https://t.co/D0vvw02amF
Draxlr allows you to build advanced dashboards to analyze your database!
We have partnered with them so that you can connect your Supabase Database with a click of a button. Learn more in this article:
https://t.co/D0vvw02amF
If you're using Supabase and still manually writing SQL for every little thing…
You’re wasting hours.
Draxlr’s AI + Supabase =
✨ Text-to-SQL
✨ Instant charts
✨ Powerful Dashboards with embedding
This video shows data going from a basic question ("Count of orders") to a beautiful, interactive monthly breakdown in seconds using https://t.co/L0gyzuZcNS
@supabase
👇#Supabase #DataAnalytics #AIBuilders