📰 Trade smarter in just 3 minutes. Get institutional-grade market insights designed for traders and investors.
Subscribe for FREE👉 https://t.co/EbWb9Fc19v
On NQ, when price reaches an opposing gamma-exposure (GEX) wall, it pierces through ~96% of the time. The walls act like magnets. Fading price right at the wall is a trap.
NQ · 2023-05 → 2024-06 · intraday ORB-window trades
$NQ #QQQ#futures#daytrading#trading#emini #priceaction #tradingstats #quant #stockmarket
📊 Morning GEX: 0-7 DTE composite (Jun 16)
NQ: positive gamma, dealers positioned to dampen moves (mean-reverting / pinning bias).
ES: positive gamma, dealers positioned to dampen moves (mean-reverting / pinning bias).
Charts show net dealer gamma by strike with key support/resistance walls and the gamma flip level.
GEX levels are available all day long for Elite and ATS members in our dashboard.
$NQ #ES #GEX #GammaExposure #0DTE #OptionsFlow #SPX
NQ trades nearly 24 hours, but the regular cash session is only 9:30 AM to 4:00 PM ET. About 42% of the average day's net move happens overnight, between the 4:00 PM close and the 9:30 AM open, while the US session is shut. Mean overnight move 0.59% vs 0.81% in cash hours, and on 39% of days the overnight move is bigger than the entire cash session.
NQ · 2022-05-01 → 2026-06-04 · N=1,055 sessions
$NQ #QQQ #futures #daytrading #trading #emini #priceaction #tradingstats #quant #stockmarket
@stingray_agent It has everything in there, but I'm looking at a glance for risk adjusted, and I'll pull the graphs I just showed you and look them over. The distribution curves will usually show something funky pretty quick.
We wanted to share how we internally prevent overfitting:
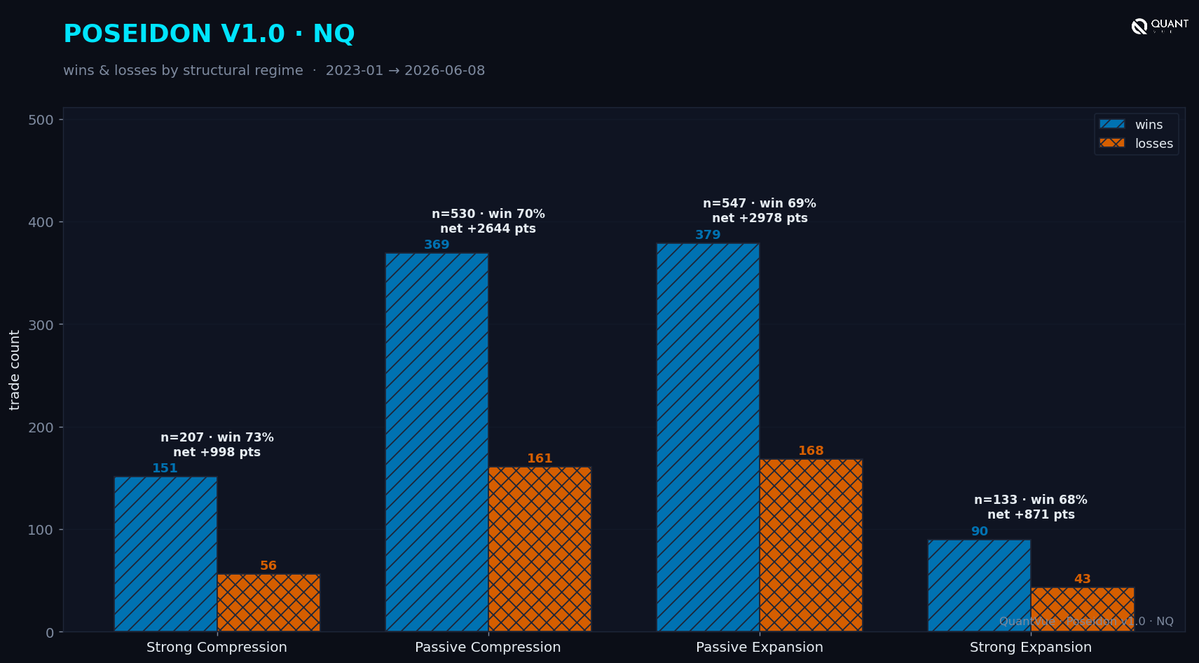
Most backtests are fiction. You tune the params until the equity curve looks great, and it dies the day it trades live. So before anything we build ships, it runs a 13-step validation gauntlet. Every step is scored on data the strategy was never tuned on and it gets viewed precisely once. Here is the whole process, in plain terms. Shown is an algo we just launched, Poseidon, as an example.
The point of all 13 is simple. Make it as hard as possible to create a viable strategy. We WANT to break it. We WANT it to die. And if it manages to survive, then it was meant to be.
Build and validate the pieces first
1. Validate and freeze each component on its own before combining them. If the param tuning already happened at the component level, the combination isn't a fresh fishing trip. Each component follows the same process as the rest of the steps, and then the combination is re-ran separately.
Stress-test the edge out-of-sample
2. Walk-forward, multiple out-of-sample folds. Train on the past, test on the next unseen window, roll forward, repeat. The edge has to hold in every fold, not only on average.
3. Purged cross-validation. Hundreds of recombined train/test paths, each with a gap between train and test so no information leaks across the seam.
Control for luck and over-searching
4. Count the trials. Tally every variant you test and penalize the final score for how many you tried. That stops a "winner" from being the luckiest of many attempts. This is called a deflated sharpe.
5. Family-wise correction. A statistical haircut (Holm) so the final pass bar isn't a naked single test.
6. Minimum-history pre-flight. Confirm you have enough market history to justify the number of variants searched before sealing anything.
Pre-register, then open once
7. Three-way split. Fit parameters on the development data only. The held-back period is never touched in tuning.
8. Freeze the rules in writing. Before opening the held-back data, lock the exact strategy and the pass/fail bar, and sign off. No edits after.
9. Single holdout pass. Run the held-back period exactly once, against the pre-set bar.
10. Risk check. Confirm any risk advantage, like lower drawdown from confidence-based sizing, carries to the held-back data and not just the training data.
11. Direction check. Invert the directional gate on purpose. If performance doesn't collapse, your gate was a coin flip.
12. No second look. Once the holdout is opened, nothing gets re-tuned. Pass as written, or it doesn't ship.
The only real test
13. Forward / live testing. Data that did not exist when the model was built. This is the test nobody can fool, and it's where overfit models go to die. The one shown is actually holding up really well since it launched, given the wild volatility.
In one list:
1. Independent component settings locks
2. Walk-forward expanding fold validation
3. Combinatorial Purged Cross-Validation
4. Effective-N + Deflated Sharpe
5. Holm / FWER haircut
6. MinBTL pre-flight
7. 3-Way Split / Tuning in Test Set
8. Strategy Spec Sealed and Registered
9. Sealed and Touched Once Holdout Opened and Tested
10. Risk-Reduction Checks (ensuring OOS meets/beats train)
11. Direction Classifier Check (ensuring OOS concordant/discordant trades hold up vs train)
12. No Re-Tuning After Step 9 - It's a One-Shot Holdout
13. Forward Testing (detailed above)
Educational only, not investment advice.
#algotrading #quant #systematictrading #backtesting #tradingsystems #quantfinance #machinelearning #futures $NQ
Regime overfit checking is part of step 7 before we push into the holdout. If it's over represented in wins or losses in any particular regime then we're going to go look at it. Doesn't necessarily mean a failure mind you, but it's something to look at. This particular strategy came out fairly broad with normal curves that I'd expect to see.
💡 Algo Tip: Beware overfitting
More parameters fit history better and predict the future worse. If a rule needs five conditions to work, it probably won't.
$NQ #ES#futures#daytrading
People love to claim an LSTM can predict price. So we built one and tried to break it honestly using ONLY OHLCV as the inputs.
Setup: a real LSTM on pure NQ 1-minute OHLCV, predicting next-bar direction. About 11,000 parameters. Honest by-date split (train through 2022, validate on 2023, test on 2024 and later), 201,898 sealed test bars it never saw.
Result: 50.45% accuracy. A plain logistic regression got 50.19%. A coin flip is 50%. The edge over the baseline is +0.26%, and its 95% confidence interval includes zero. Statistically, it does nothing.
Here's an interesting piece: Costs finish it off. Average next-bar move is 6.2 points, a round trip costs half a point. You need 54.05% accuracy to break even. The model delivered 50.45%, which is -0.44 pt per trade, about -$8.89 every time you act on it.
So where do the "my LSTM nailed it" screenshots come from? Leakage. Swap the honest by-date split for a random 80/20 split and the same model jumps to 51.67%. That bump is purely a dishonest artifact. Adjacent, overlapping windows bleed across the split. Stack a few of those shortcuts and you manufacture an edge that isn't reality but looks amazing on X.
Raw price carries no next-bar directional signal, so a fancier model has nothing to learn from. This is an information problem. A model can't find a signal if none exists, and despite what people might tell you pure OHLCV does not carry a signal. It might as well be a random walk.
The fix is to change the information or the target: engineered features, longer or path-based horizons, regime conditioning, exogenous inputs like flow, GEX, or news. Then grade every one against this same baseline, by-date and net of costs.
#machinelearning #quant #algotrading #datascience #LSTM #trading #futures
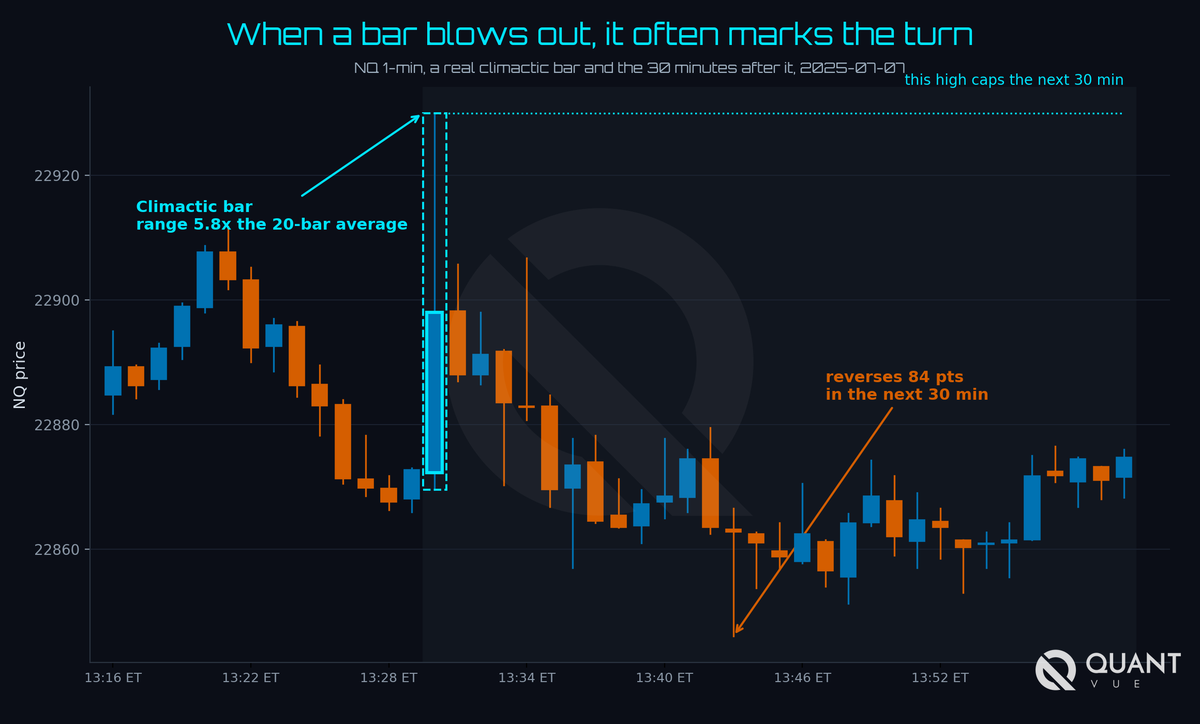
On NQ, a 1-min bar whose range exceeds 1.5× its recent average marks the next 30-minute extreme ~43% of the time, vs ~28% for an average bar. It's an interesting statistic that could potentially be used as part of an entry ensemble filter.
NQ · 2015-01-01 → 2026-05-19 (RTH) · ~2.3M 1-min bars
$NQ #QQQ #futures #daytrading #trading #emini #priceaction #tradingstats #quant #stockmarket
💡 Algo Tip: Model costs from day one
Commissions, slippage, and spread can turn a 'profitable' backtest into a losing system. Build them in from the start and not as an afterthought.
Your IDE's backtesting software should have a layer to model this - if it doesn't then build it.
$NQ #ES #futures #daytrading
NQ: large overnight gaps (≥0.75%) fill only 30.8% of the time. The bigger the gap, the less likely it fills. That's not necessarily a revolutionary idea (it's further away, of course it doesn't fill as often), but it's an interesting statistic.
NQ · 2022-05-01 → 2026-06-04 · N=289
$NQ #QQQ #futures #daytrading #trading #emini #priceaction #tradingstats #quant #stockmarket
💡 Algo Tip — AI brute force is still brute force
Telling Claude to grind out a million backtests doesn't make the winner real in forward testing. It's just automated and AI powered overfitting.
$NQ #ES#futures#daytrading#algotrading#quant