MikshuAlpha
Pre-market analysis: Wednesday 15th July, 2026
1. Market Summary
Yesterday’s soft CPI print produced the expected relief rally, but the important detail was where the buying occurred.
$SPY opened at 750.91, reached 753.34 and closed 0.36% higher at 751.83. $QQQ gained 1.22%, while $IWM rose only 0.35% and equal-weight SPY fell 0.36%. This was a concentrated mega-cap and technology rally rather than a broad risk-on session. VIX fell 3.85% to 16.50.
My bias remains bullish above the $SPX 7,496 to 7,497 gamma flip, with 7,550 acting as the immediate pin and 7,600 as the primary upside magnet.
• Above 7,496: dips should continue to be absorbed and volatility suppressed.
• Above 7,550 after PPI: 7,575 then 7,600 becomes the likely path.
• Below 7,496: the positive-gamma framework weakens and is potentially a trapdoor, opening 7,480 and potentially 7,400.
The most likely outcome is not an explosive breakout. It is a controlled positive-gamma grind higher into Friday’s OPEX, provided PPI does not challenge yesterday’s disinflation narrative.
Different positioning models disagree over whether total gamma rebuilt or declined yesterday. One model shows a rebuild to positive $646 million, while another shows aggregate gamma falling from roughly 108k to 62k. The key point is that both models remain positive and identify almost exactly the same regime boundary near 7,497. Gamma is supportive, but expiry is steadily removing some of the cushion.
Directional lean: risk-on, but selective and catalyst-dependent.
2. Macro analysis
United States
June CPI delivered a comprehensive downside surprise:
• Headline CPI: -0.4% month-on-month
• Headline CPI: 3.5% year-on-year versus 3.8% expected
• Core CPI: flat month-on-month
• Core CPI: 2.6% year-on-year
• Shelter inflation: weakest since January 2021
The reaction was justified because the weakness extended beyond petrol. Shelter, services, insurance and several core-goods categories all softened. Expectations of a July Fed hike collapsed into the low teens.
Today’s PPI release at 8:30 ET is therefore the final major inflation hurdle before OPEX. The market will focus particularly on core PPI, trade-services margins and whether pipeline inflation remains elevated after May’s 1.1% monthly increase. The annual headline rate is expected to remain high, around 6.2%, so a merely elevated year-on-year print is less important than the monthly direction and composition.
The earnings backdrop remains constructive:
• Goldman Sachs, JPMorgan and Bank of America showed exceptionally strong trading and investment-banking activity.
• BlackRock reported record assets of $15.34 trillion and $192 billion of quarterly inflows.
• BNY raised its revenue outlook after record quarterly results.
• Johnson & Johnson beat expectations and raised guidance.
This confirms that capital markets, deal flow, asset prices and institutional activity remain healthy. It is a positive read-through for the broader earnings season, although it benefits financial-market businesses more directly than the entire economy.
China
China’s Q2 GDP growth slowed to 4.3%, the weakest pace in three and a half years and below expectations. Retail sales grew only 1.0%, property investment fell 18% during the first half, and fixed-asset investment remained weak. Industrial production and exports were stronger, with exports rising 27%, but the economy remains heavily dependent on external demand rather than domestic consumption.
This is negative for broad China-sensitive cyclicals and commodities, but it also increases the probability of additional targeted stimulus from Beijing.
Eurozone
The ECB remains vigilant about renewed energy inflation but is not signalling an urgent July hike. Officials have not yet seen meaningful second-round wage or inflation-expectation effects, although markets continue to price further tightening later in the year.
More importantly for today’s tape, ASML delivered a major beat, raised its 2026 outlook and announced additional capacity expansion due to persistent AI and advanced-chip demand. That directly supports global semiconductor equipment, memory and AI infrastructure names.
Japan and Asia
ASML’s results drove a strong regional semiconductor response. South Korea’s KOSPI rose roughly 6.2% and Japan’s Nikkei gained around 1.5%, reversing much of the recent liquidation-driven semiconductor damage.
The Bank of Japan is still expected to hold its policy rate at 1% later this month, but weak-yen inflation and wage pressure keep further tightening in play beyond July.
Geopolitics and oil
Oil is the main contradiction to the benign CPI narrative. Brent has moved back above $85 as US-Iran tensions and disruption risks around Hormuz remain unresolved. June CPI reflected temporarily lower energy prices; July inflation could look materially less friendly if oil stays elevated.
3. Momentum and breadth
Headline index strength is running ahead of underlying participation.
• Only 46.32% of Nasdaq stocks are above their five-day average.
• Technology breadth is weaker, with just 37.83% above the five-day average.
• Russell 2000 breadth is healthier over longer periods: 53.74% above the 20-day, 62.24% above the 50-day and 65.15% above the 200-day.
• The advance-decline impulse is close to neutral rather than showing a broad thrust.
This confirms a market where mega-cap technology can carry the indices while a large part of the market consolidates or rotates underneath.
A separate medium-term timing framework still lacks a fresh daily buy signal and retains seven active Hindenburg Omens. I would therefore classify the current environment as tactically bullish, not a full breadth all-clear.
The bullish interpretation is that market damage has remained contained while individual leadership groups continue to form. The bearish interpretation is that another narrow index high without improving short-term breadth increases vulnerability after OPEX.
4. Volatility
The volatility complex remains supportive:
• VIX: 16.50 area
• VVIX: 93.53
• VIX1D: 10.57
• Second-month versus front-month VIX futures: 1.06, confirming contango
• Total put-call ratio: 0.867
• Equity put-call ratio: 0.773
There is no evidence of systemic stress or urgent demand for convexity. Event premium collapsed after CPI, and the term structure remains orderly.
The elevated options-volume put-call reading likely reflects remaining geopolitical protection rather than fresh inflation hedging. This is consistent with institutions unwinding CPI protection while retaining some Iran and oil insurance.
VIX call decay should also produce charm-related selling pressure in July VIX futures into Friday, provided no fresh geopolitical catalyst appears.
Active trap setup:
A benign PPI print followed by failure to hold 7,550 would probably produce pinning rather than genuine downside.
A hot PPI print followed by a break of 7,497 is materially different. With gamma support thinning into expiry, that could trigger a faster volatility expansion towards 7,480 and 7,400.
5. Credit and liquidity
Credit continues to validate the bullish index structure.
• HYG versus TLT is at 0.9477, close to the top of its annual range.
• LQD versus HYG has fallen to 1.35, showing high yield outperforming investment grade.
• Regional banks remain close to recent highs.
• There is no meaningful deterioration in credit-risk appetite.
Absolute HYG remains less impressive than the relative ratios, and the 2-year versus 10-year Treasury curve is still inverted by roughly 39 basis points. Credit is supportive, but it is not signalling an unrestricted cyclical boom.
Funding conditions are benign. SOFR is approximately five basis points below IORB, indicating ample cash in the repo system and no visible short-term dollar-funding pressure.
Credit and liquidity verdict: supportive of buying dips.
6. ETF and Sector rotation
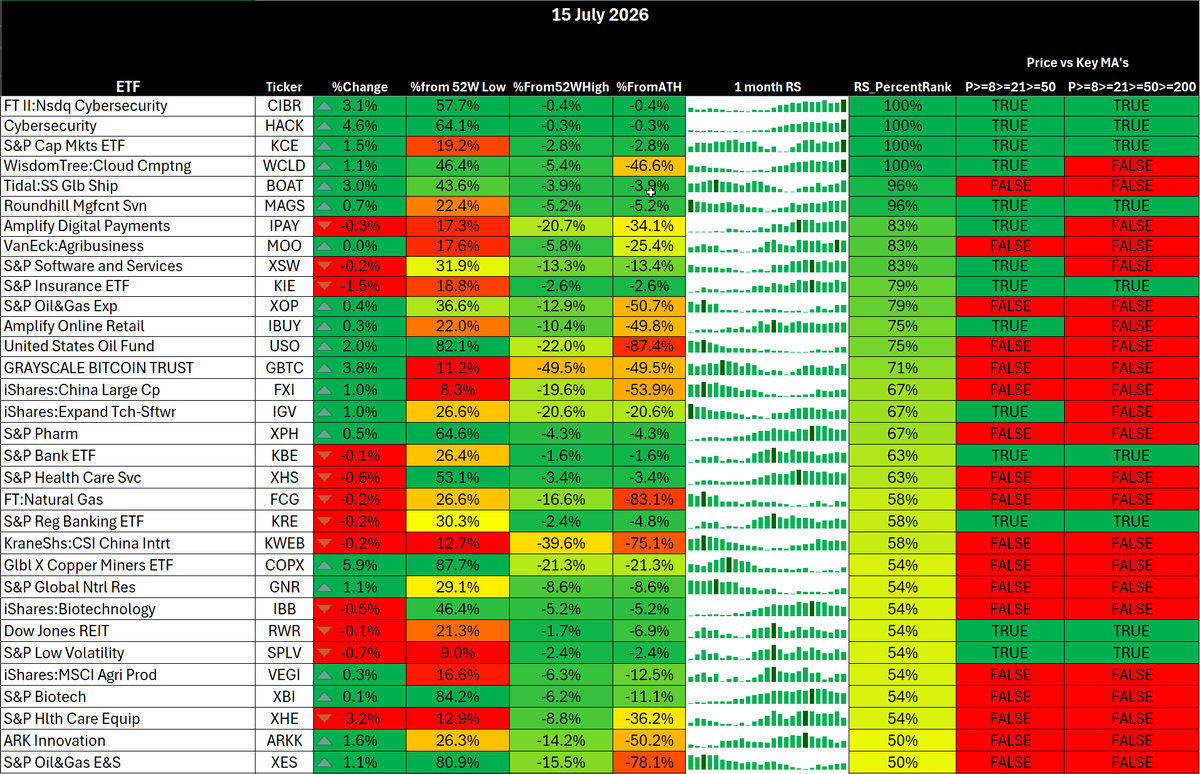
The RS Dashboard confirms an unusually concentrated rotation.
Leadership
Top RS leaders: $HACK, $CIBR, $KCE, $WCLD and $MAGS.
• HACK gained 4.58% and CIBR gained 3.15%, placing cybersecurity firmly at the top of the market.
• KCE gained 1.45%, confirming capital-markets leadership following the bank earnings.
• WCLD gained 1.14%, showing that software weakness is not universal.
• MAGS remains above its key moving averages and continues to benefit from mega-cap concentration.
Cybersecurity is the cleanest thematic leadership pocket. However, the group is now close to its highs after a sharp acceleration, so it should be bought through controlled consolidations rather than chased vertically. Indeed at this point I am waiting for a pullback in these names.
Main sectors
• Financials: $XLF is the clearest major-sector leader. It is above its full moving-average stack and only around 1.1% below its high.
• Energy: $XLE sits just below formal leader status and continues to benefit from rising oil.
• Technology: $XLK gained 1.29% and remains above its major moving averages, but it is still a one-month relative laggard. The index is being carried by selective mega-cap strength rather than broad technology participation.
• Semiconductors: $SMH gained 2.51% and SOXX gained 2.58%, but both remain below their short-term moving-average stacks and materially below their highs. This is an important rebound and potential repair, but not yet a confirmed return to leadership.
• Defensives: XLP fell 1.38%, XLV fell 1.93%, XLRE fell 0.49% and XLU was marginally lower. Defensive underperformance supports the risk-on interpretation.
• Consumer discretionary: $XLY remains the weakest major sector and is below its key moving averages. This is consistent with weak China consumption, selective US spending and a market led by AI infrastructure rather than broad consumer demand.
Breadth divergence
QQQ gained 1.12%, while equal-weight QQQ rose only 0.06%.
SPY gained 0.36%, while equal-weight SPY fell 0.36%.
That is the clearest message in the ETF data: the tape is bullish at index level, but participation remains narrow.
7. Summary
The market remains risk-on above SPX 7,496, with 7,550 acting as the pin and 7,600 as the immediate upside target.
A benign or cool PPI print should allow further volatility compression, semiconductor follow-through and a positive-gamma grind towards 7,575 and 7,600. ASML’s beat, strong Asian semiconductor performance and record capital-markets earnings reinforce that view.
The rally is not yet broad. Nasdaq short-term breadth is below 50%, technology breadth is only 37.83%, equal-weight indices are lagging and semiconductors have not fully repaired their moving-average structures.
Primary setup: favour QQQ and SMH exposure if PPI is not hot, SPX holds 7,550 and semiconductor leadership persists after the cash open.
Bearish invalidation: a sustained break below 7,496, particularly alongside VIX reclaiming 17.50 to 18, changes the regime and targets 7,480 then 7,400.
Conviction: bullish, but maintain disciplined size until PPI clears and breadth confirms. The path of least resistance is higher, though the likely expression remains a grind rather than a momentum explosion.
Pre-market analysis – Monday 23rd March 2026
1. Market Summary
Clear risk-off regime with trend continuation bias.
$SPY broke down decisively on Friday, losing structure and closing below key support and firmly under the 200DMA, with price now pressing the lower bound of the multi-week descending trend. The bounce into close was mechanical, not structural.
Overnight price action confirms no bid of size:
Pre-market flush to ~642
Sitting marginally above trendline support
No evidence yet of demand absorption
This is still orderly distribution, not capitulation:
VIX elevated but not extreme
No disorderly liquidity event yet
Selling remains controlled and systematic
Near-term posture
Bias: sell strength, not buy dips
Expectation: continued downside with intermittent reflex bounces
Swing conditions: poor for longs until a volatility event or capitulation confirms
2. Macro Analysis
Macro backdrop continues to tighten financial conditions while removing support.
Key drivers:
Post-OPEX positioning reset
Market has lost its stabilising gamma support
This materially increases susceptibility to directional moves
Geopolitics escalating (US–Iran)
Oil risk remains elevated
Keeps inflation expectations sticky
Reinforces policy constraint narrative
Rates and policy constraint
Market repricing fewer cuts post-FOMC
Growth slowing while inflation persists
Creates a policy trap environment (growth weak, inflation sticky)
Volatility setup
Large players positioning for higher vol (notably VIX upside bets)
Put skew rebuilding despite drawdown
Cross-asset confirmation
Bonds and metals both weak
Indicates deleveraging, not rotation to safety
Conclusion:
Macro is not just a headwind — it is actively removing downside buffers while increasing tail risk
3. Momentum and Breadth
Broad internal deterioration continues and is now accelerating.
Breadth metrics (SKFD/NCFD):
Clear lower highs and breakdowns
Persistent negative divergence vs price
% above short-term MAs collapsing
No internal thrust
No sign of washout reversal yet
Russell participation weak
Small caps rolling over sharply
Confirms risk-off and liquidity tightening
Advance/Decline structures
Rolling over without capitulatory spike
Suggests more downside before exhaustion
Key read:
This is distribution -> breakdown phase, not capitulation -> reversal
4. Volatility
Volatility regime is shifting structurally higher.
$VIX:
Now ~30–31
Elevated but still below panic thresholds (~35–40) seen two weeks ago
$VVIX:
Elevated but not exploding
No vol-of-vol panic yet
Term structure:
Still stressed
No clean reversion to contango
Positioning:
Large upside VIX bets (April 40 calls) indicates expectation of vol expansion, not compression
Gamma regime:
Persistent negative gamma = amplified directional moves
Implication
Volatility has room to expand
Market can still accelerate lower before any true bottom
5. Credit and Liquidity
Mixed but leaning deteriorative.
HYG/TLT: Slight stabilisation but not strong risk signal
No aggressive credit bid
LQD/HYG: Flat to slightly rising
No clear defensive rotation
KRE (regional banks): Rolling over again
Important negative signal for liquidity conditions
SOFR-IOER spread: Stable but elevated volatility earlier. Funding stress not acute, but fragility remains
Yield curve (2s10s): Steepening from deeply inverted levels, consistent with late-cycle slowdown narrative
Conclusion
No systemic stress yet
But liquidity is tightening, not improving
6. ETF and Sector Rotation
Leaders
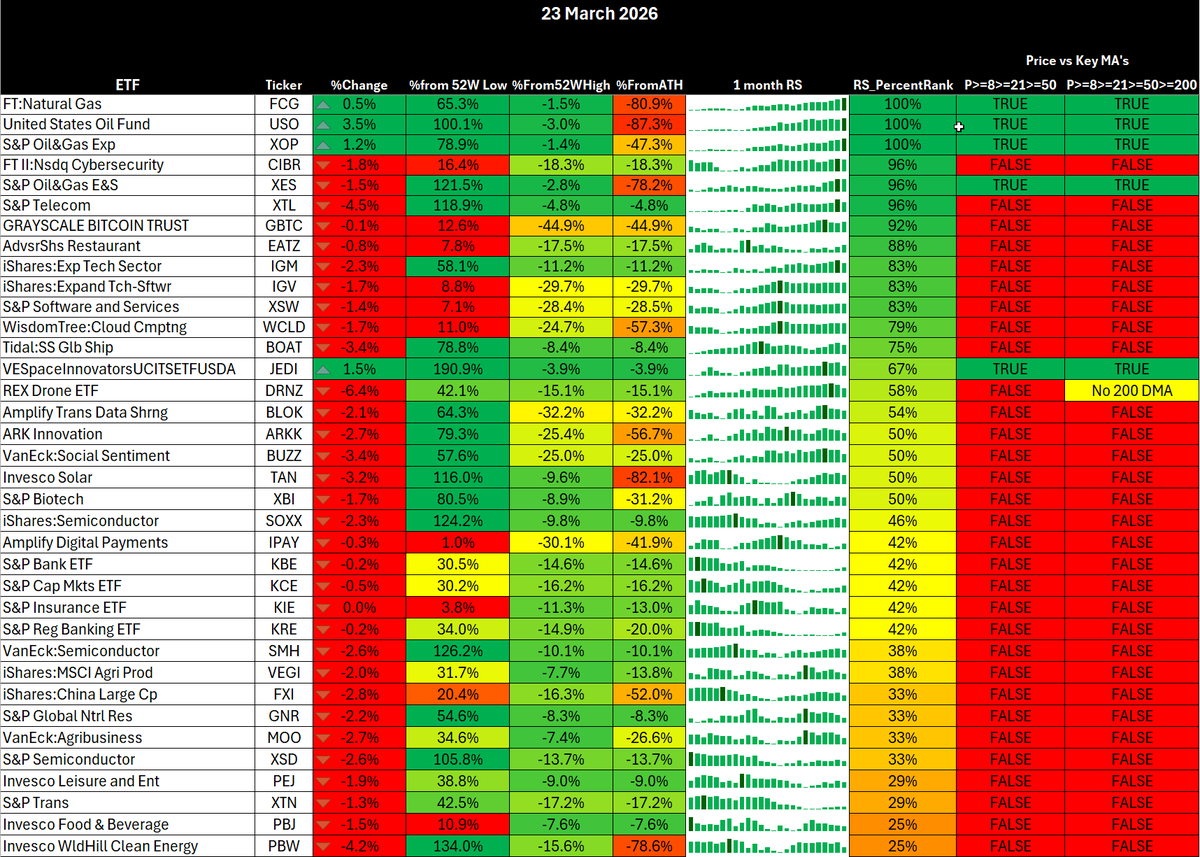
Relative strength is defensive, not constructive
Defensive cluster holding up best
$XLP, $XLV, $XLU showing relative resilience
Strength is coming from capital preservation flows, not growth
Select pockets stabilising
Some low beta / dividend exposures attempting to base but none showing leadership strong enough to shift regime
Interpretation: Leadership is passive and defensive, which is consistent with late-stage risk-off, not early-stage recovery
Laggards
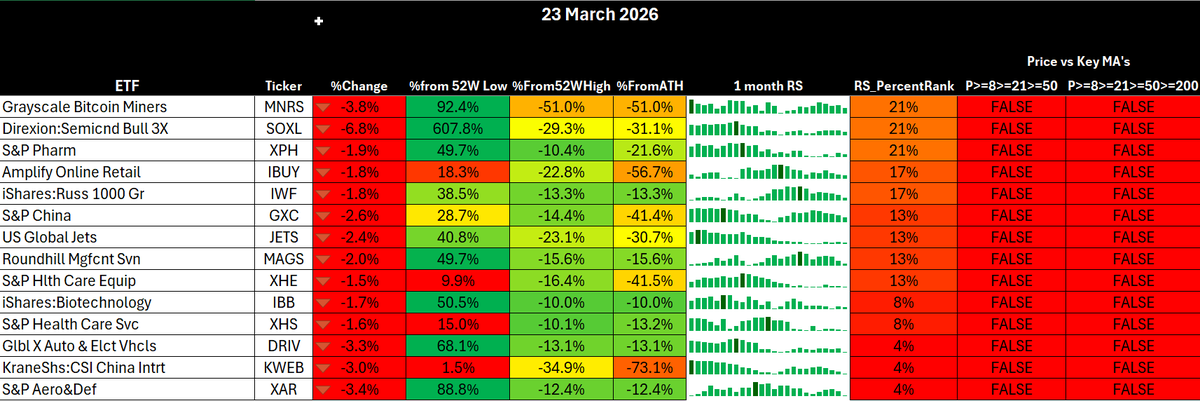
Growth and cyclicals remain the clear underperformers
$XLK, $XLY, $SMH all firmly in laggard territory
Weakness is broad, not isolated
Financials deteriorating further: $XLF weak and $KRE particularly concerning given its continued downtrend
Semiconductors still leading downside pressure and no stabilisation signal yet despite extended drawdown
Interpretation: This is still a growth unwind + liquidity tightening trade, not rotation
Structure and Regime Read
Top RS names dominated by defensives
Bottom RS dominated by growth, tech, cyclicals
Majority of ETFs: Either below key MAs
Or failing to reclaim them
No evidence of: Rotation into risk
Broad-based participation
Early leadership formation
Key Watch (Critical for regime shift)
$MAGS and $SMH
Needs to stabilise and reclaim relative strength
Must move from laggard to neutral at minimum
Without this, no sustainable rally
$XLV / $XLP: If these start to roll over, it signals next leg lower, not recovery
Bottom Line
Market is not rotating
Market is deleveraging
Leadership = defensive
Weakness = systemic across growth
Until you see:
Growth stabilising
Semis basing
Tech reclaiming RS
Any bounce remains a relief rally, not a regime shift
7. Summary
This is a structural risk-off environment with increasing downside potential.
Key pillars aligned:
Trend: bearish across timeframes
Vol: elevated with room to expand
Positioning: put skew rebuilding, negative gamma persists
Macro: restrictive, uncertain, and worsening
Breadth: weak with no capitulation
Leadership: absent
The most important takeaway: The market has lost its shock absorber post-OPEX while macro risk is rising.
Loss of dealer support
Increased susceptibility to large directional moves
Realised volatility likely to expand
My bias
Primary: sell strength
Secondary: wait for capitulation, not anticipate it
Invalidation: sustained reclaim of key levels + breadth thrust + vol compression
Tactical framing
Expect:
Early-week weakness
Reflex rallies (short covering)
Further lows ahead
Key signals to watch for a bottom:
VIX > 35–40 spike
Breadth washout + reversal
Tech / Mag7 relative strength improvement
Until then:
This is not a dip-buying market.
It is a patience and positioning market.
go mark the high and low of the London session on your chart right now
this range predicts where New York will hunt liquidity before it trends
almost nobody marks it before the session opens
a trader in my community made $30k last week using exactly this
here's the exact sequence:
THE EXTREMES OF THE RANGE:
between 6pm and 12am EST, institutions build the trap
they either:
accumulate in the middle of the range (sweep incoming to one side)
distribute to the opposite side (discplacement)
the London open at 2AM tells you WHICH
STEP 1: mark the Asia session high and low before you sleep
STEP 2: at 2AM London open, watch which side price takes out first
STEP 3: if price sweeps the extreme high/low but CLOSES back inside the range = hunt to the downside incoming
that's it
EXAMPLES:
overnight sweeps extreme high, closes back below → short entry on displacement candle targeting the sellside of the range
overnight sweeps extreme low, closes back above → long entry on displacement candle targeting buyside of the range
London breaks extreme high and closes above with momentum → continuation long into New York open
most traders open their charts at 9:30 with no idea where price has already been
they're "finding support and resistance in real time", building their levels after the institutions already swept them
informed traders marked the extremes on the HTF
they already know which side got hunted
the 9:30 open is just their confirmation window
THIS IS WHY YOU'RE ALWAYS LATE:
the range is built overnight
overnight sweeps one side before most traders wake up
New York open is where price finally gets the volume and actually moves
you can either KNOW the range before London opens or you can DISCOVER it after you've already missed the move
the HTF ranges tells you which side is about to get hit
go mark it tonight. 30 sessions. track every sweep
you'll never open a chart at 9:30 blind again
I walk through my entire system live every morning inside my free Discord . marking levels, calling the sweep, entering the trade in real time. same model. no guesswork
link in bio
Hi @MikshuAlpha , I have been following you for a while since I joined Tenet group as a member.. I am wondering if you are offering coaching sessions to new students. I am unable to DM you, hence posting the question here.. I am in your Telegram channel and learning new things everyday.. thanks for all you do. 🙏
Every indicator you're using is probably useless.
Here's what actually makes money: Trend.
The filter:
Check Ripster Clouds on daily (need 2 green)
Check Ripster Clouds on weekly (need 2 green)
4 green clouds total = safest stocks to trade.
Missing clouds? Pass.
Trend beats setups.
Trend beats indicators.
Trend beats everything.
🎁 My Next Giveaway is money maker
Giving away 6 Month Free Breaking News & Squawk Service to 3 People !
@TheTradeXchange So Many winning plays using them specially in Trump Era!!
Enter>
✅RT/Like this & follow @TheTradeXchange
🧠Tell me what breaking news is A+
Nov 25