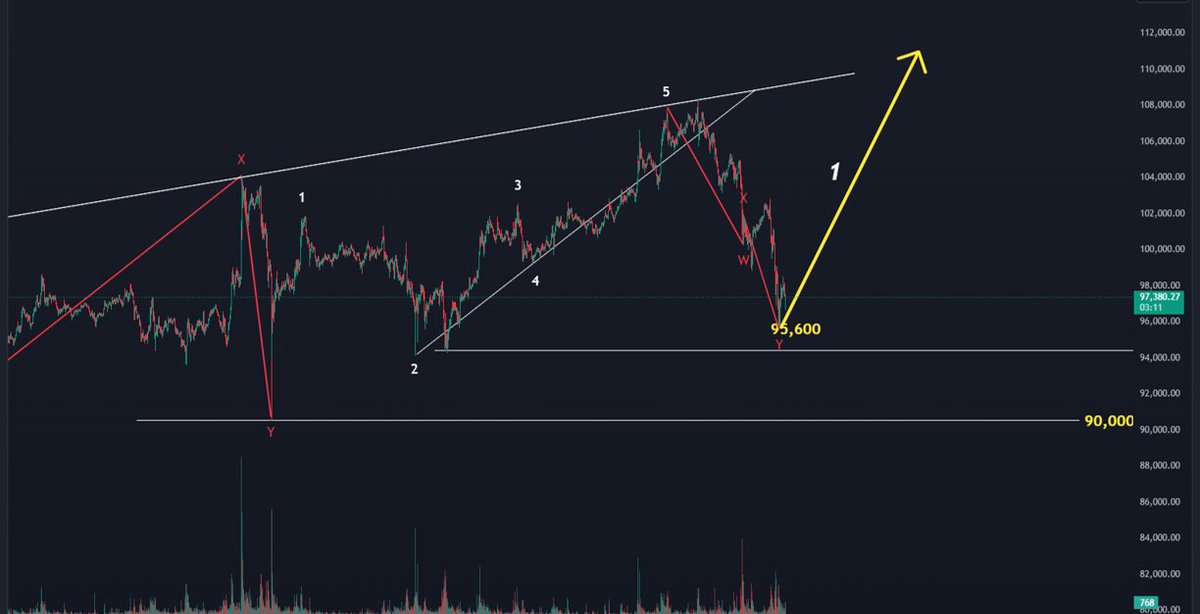
$BTC (4)
3. Complex Correction Scenario After a rebound within a complex correction, there is a possibility that the price could decline to around 85,000 USD.
You can use this analysis to guide your trading decisions for today.
$BTC (2)
1. Common Retracement Zone After an #Impulse Wave The price might enter a typical retracement phase following the completion of an impulse wave.
$LINK (3)
Key Point Keep an eye on Bitcoin's movement, as it plays an important role in determining the overall market trend.
If you'd like to stay updated on chart analysis, don’t forget to follow!
$LINK (2)
This is because the next wave, Wave 3, tends to be significantly strong. Current Situation It is still too early to say that the correction has been completed. Currently, trading volume is decreasing, but if it increases again, a clear direction is likely to emerge.
$LINK (1)
#Chainlink Chart Analysis
Unlike other #altcoins , Chainlink has shown a pattern of significant ups and downs.
Based on this pattern, it appears to follow the Elliott Wave 1212 structure.
After the 1212 wave, there is typically a large #upward movement.
$BTC (5)
The current movement could be a temporary rebound, with the downtrend likely to continue.
Considering these two scenarios, it’s advisable to trade cautiously and focus on risk management.
If you'd like to keep up with further chart analysis, don’t forget to follow!
$BTC (4)
Scenario 2: Continuing WXY #ComplexCorrection
In this scenario, the WXY complex correction, which I’ve mentioned before, is still ongoing. If this is the case, Bitcoin may drop further to around $83,000, where the Y wave is expected.
$BTC (3)
This pattern is characterized by the price not falling below the A wave and instead showing an upward trend. For this kind of upward movement, Bitcoin needs to reach at least $98,000, as mentioned earlier.
$BTC (2)
Scenario 1: #RunningFlat Formation
In this scenario, Bitcoin's movement resembles a running flat pattern. If a running flat occurs, it suggests that the correction has ended and that Bitcoin is eager to rise quickly.
$BTC (1)
#Bitcoin Chart Analysis
It seems that Bitcoin has been showing signs of an uptrend since January 1, 2025. However, to confirm a definitive #upward trend, Bitcoin must rise to at least $98,000.
Therefore, I’ve prepared two potential scenarios for today:
$ETC (3)
I am unsure whether this indicates an impulse wave or if there will be one more wave down after a fourth wave correction, but it seems the correction might be nearing its end.
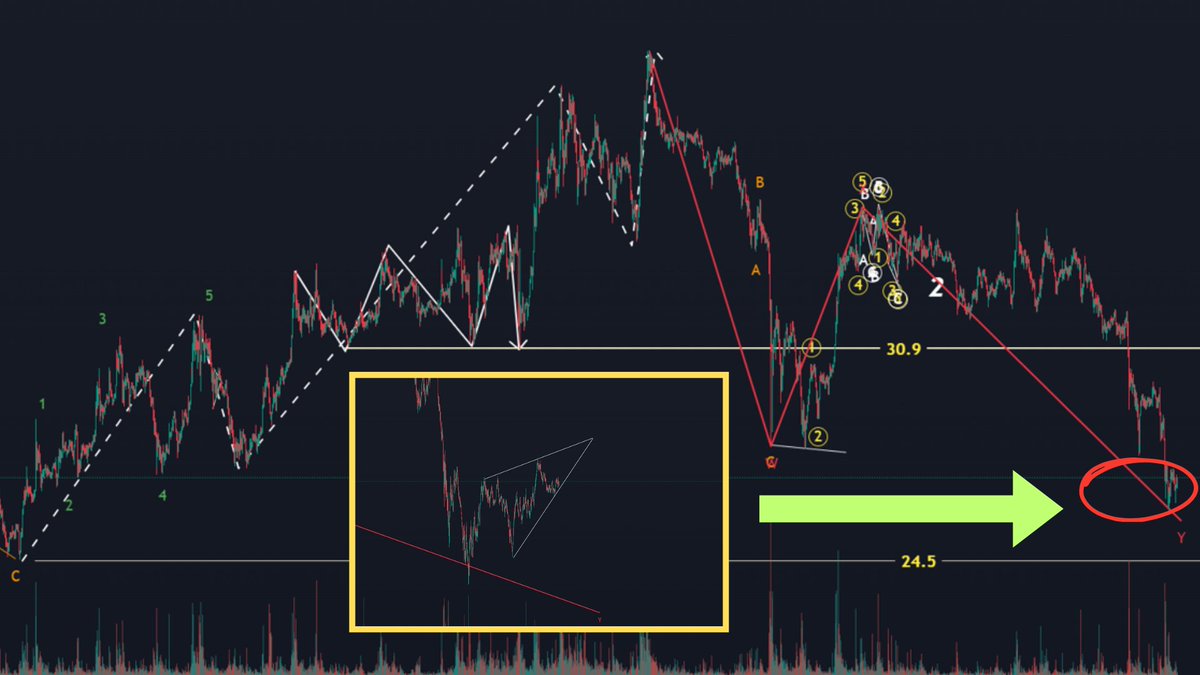
As long as the price does not fall below $24.5, I expect a significant #upward movement.
$ETC (2)
If Ethereum Classic does not drop below $24.5, I anticipate a potential 3-3 wave #upward movement.
In the short term, a #risingwedge pattern is forming.
$ETC (1)
#EthereumClassic Chart Analysis
Ethereum Classic recently rose to $39 and is now undergoing a correction.
From a chart perspective, the $24.5 level is highly significant.
This is because I believe $24.5 marks the starting point of a new wave.
$BTC (5)
Summary
In today’s scenarios, there’s a common point for a short-term long position, but if Bitcoin declines, we should prepare for the possibility of a major drop.
For continued chart analysis, don’t forget to follow.
$BTC (4)
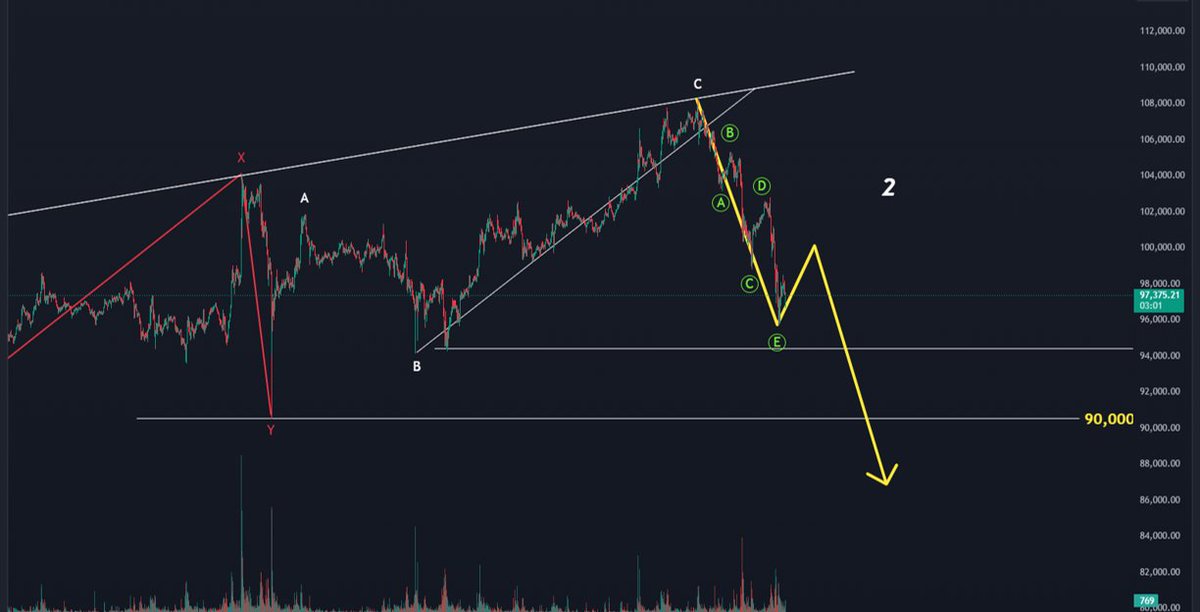
- However, confirmation of a major decline would require Bitcoin to fall below $90,000.
- Until then, a significant downward movement is less likely.
$BTC (3)
2. #Bearish Scenario
- The previous upward movement is analyzed as an ABC wave pattern.
- In this case, the correction would likely be seen as a 12345 downward impulse.
- If so, there is potential for a drop to as low as $80,000.
$BTC (2)
1. #Bullish Scenario
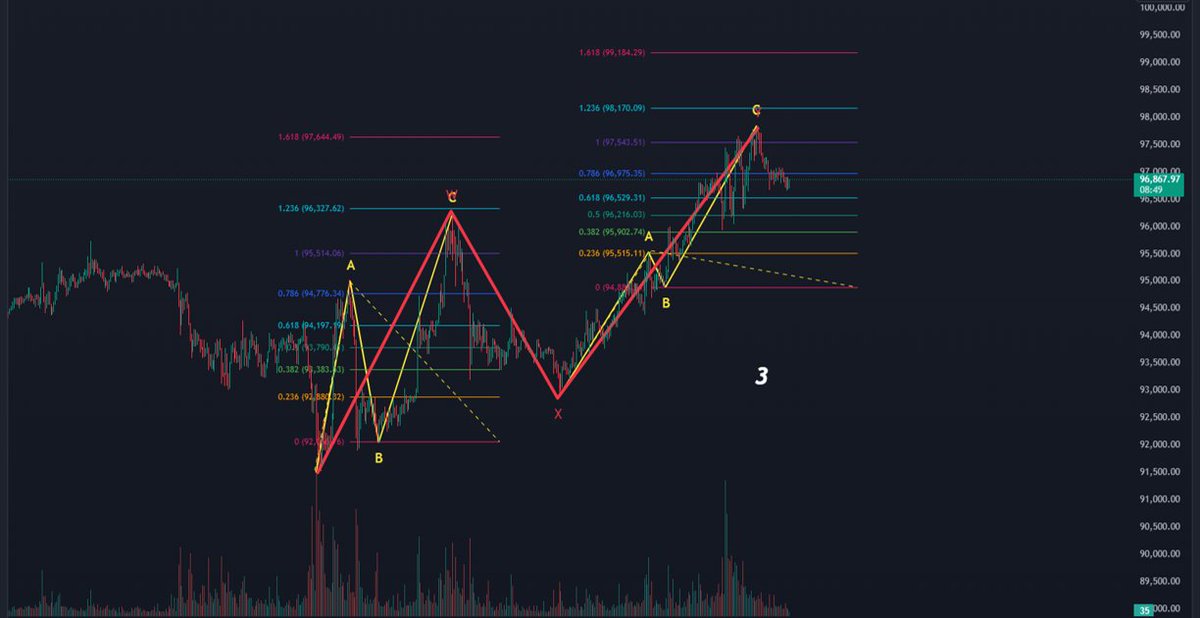
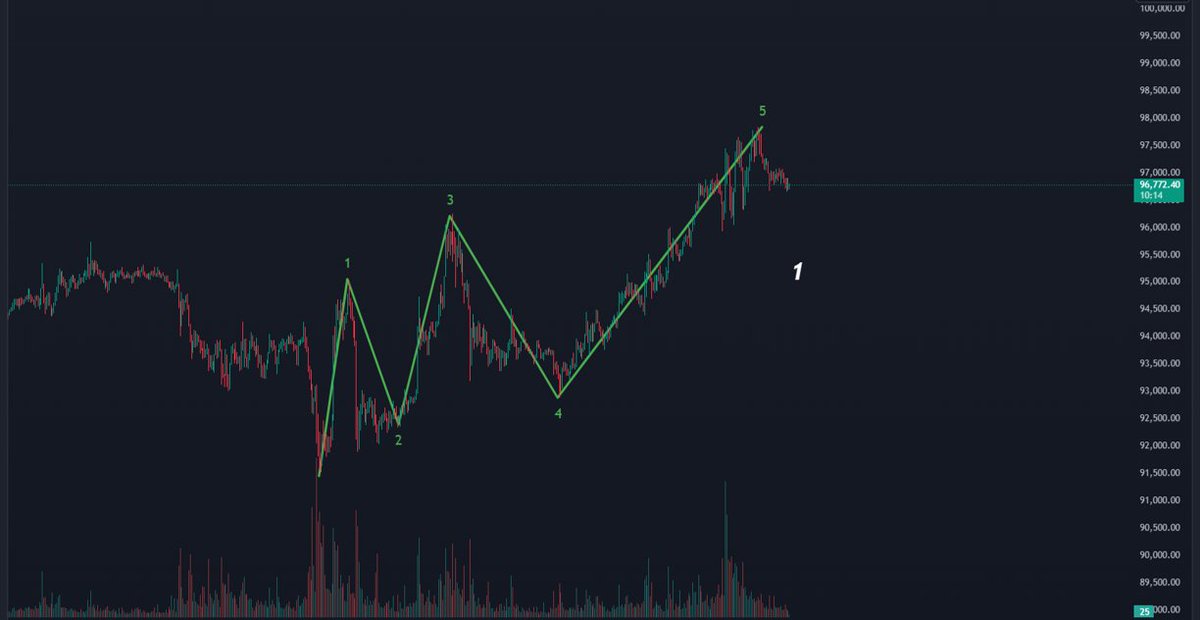
- The previous upward movement is viewed as an impulsive wave.
- The corrective wave is being considered as a WXY pattern, specifically a 335-X-535 wave.
- If the $95,600 support level holds, there is a possibility of an upward movement.
$BTC (1)
#Bitcoin Chart Analysis
Today, my thoughts remain divided between two perspectives:
I’ve prepared one #bullish scenario and one #bearish scenario.