Happy Halloween, DC! 🎃
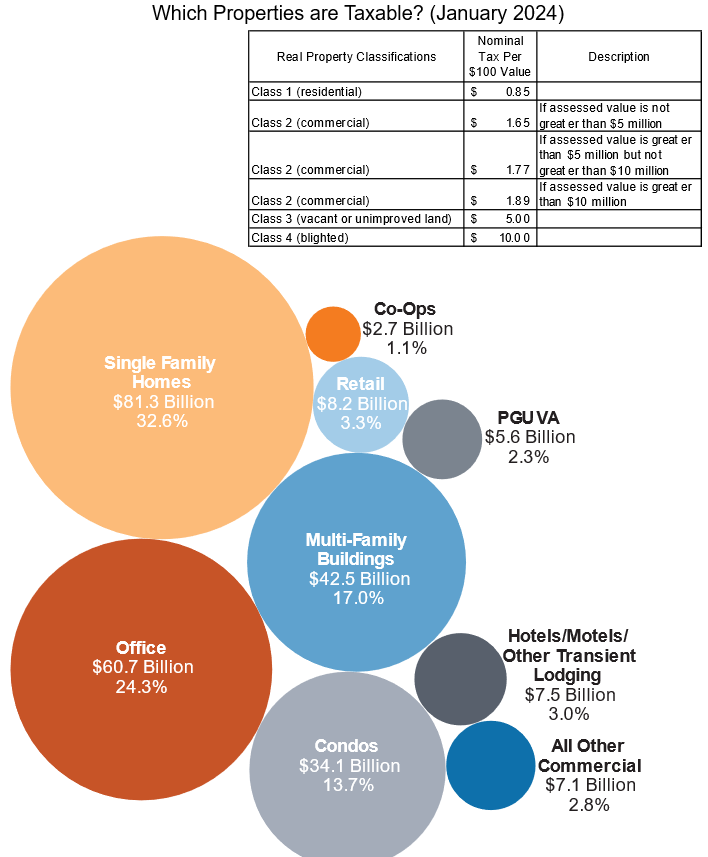
No tricks here, only a treat: a visual guide to DC's tax system with over 50 graphics illustrating property, sales, income taxes and more
- Full guide: https://t.co/eFsx0hsC0A
- Our favorite snippets: https://t.co/O2GH8t1cNX
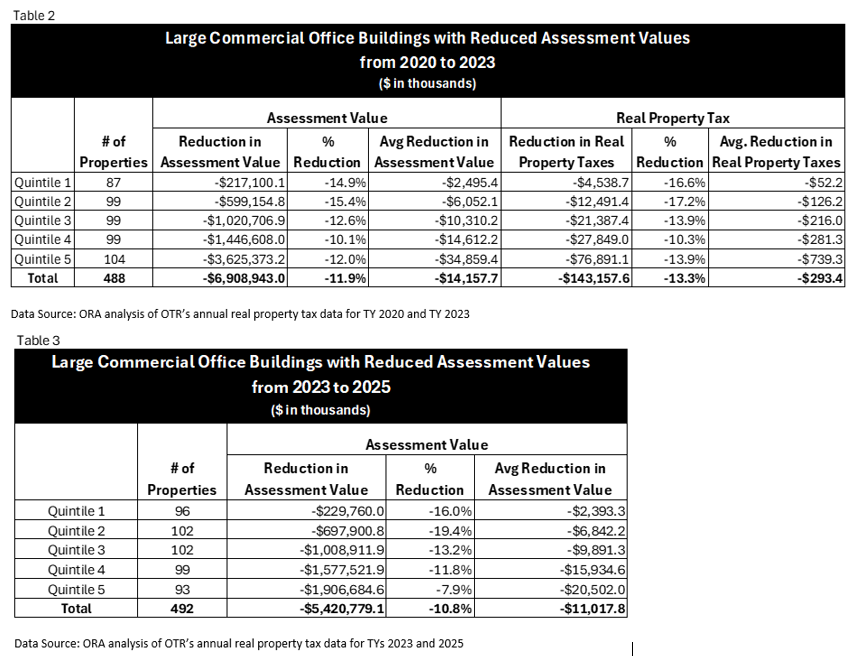
We analyzed 500+ large, high-value office buildings in DC, and found 86% or more are expected to lose value at some point between 2020 and 2025, with a combined loss of more than $12B in building value. https://t.co/c5ICkM7MW7
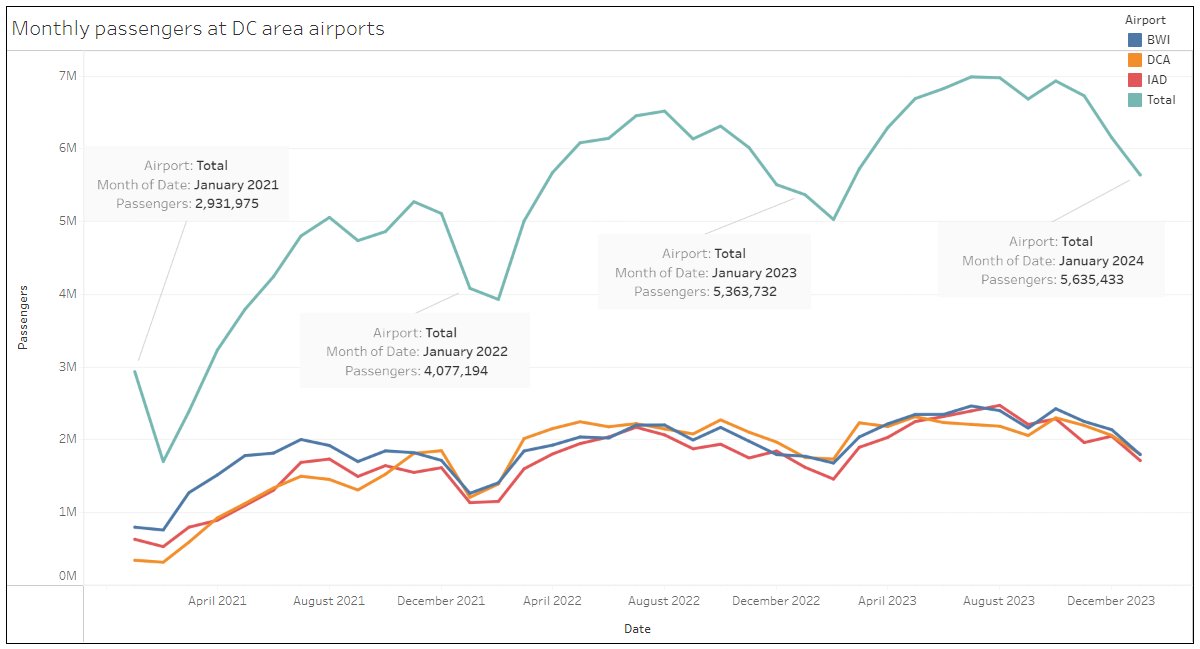
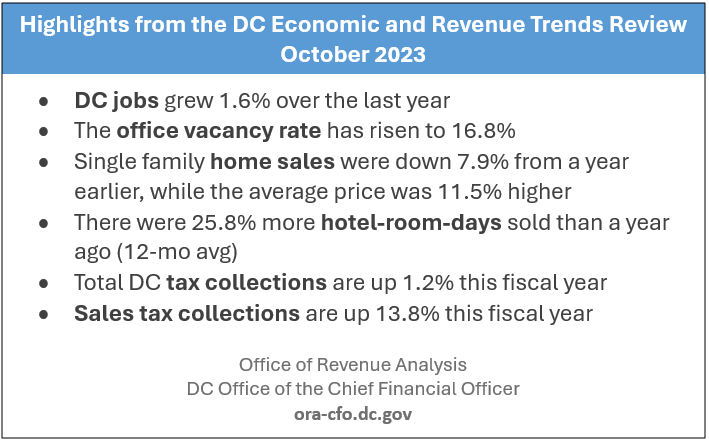
The number of DC area airport passengers continues to grow, with total passengers in 2023 exceeding pre-pandemic levels from 2019 by 1%. Read more in our monthly DC Economic and Revenue Trends Review https://t.co/OdRPjtOrRC
In March, the BLS released its annual revisions to jobs estimates. The revisions show that District job recovery post-pandemic was slower than previously estimated. https://t.co/mVBChB28xd
#jobs#economy#WashingtonDC
HPAP demographics: 71% of HPAP participants were Black, and 21% were white. More than two-thirds of participants were women. (Per data from 2016-2021) (4/8)
Our new study analyzes participation data from three of DC’s home purchase programs: the Employer-Assisted Housing Program (EAHP), Home Purchase Assistance Program (HPAP), and the Inclusionary Zoning Program (IZ): https://t.co/zMTKK8R1P2
Here are our major findings: 🧵(1/8)
‘Empire State of Mind’ blaring in the background as NYC demonstrates a garbage truck picking up a garbage can, while calling it ‘the future,’ is one of the greatest videos I’ve ever watched.
DC Residents reported qualifying childcare expenses on average of $1,900 in 2021, when the average claim for the childcare tax credit rose to $603. Residents of Wards 7 & 8 benefited the most from the expansion. Read more here: https://t.co/LMkqoLTJ2f
#childcare#data#Economics
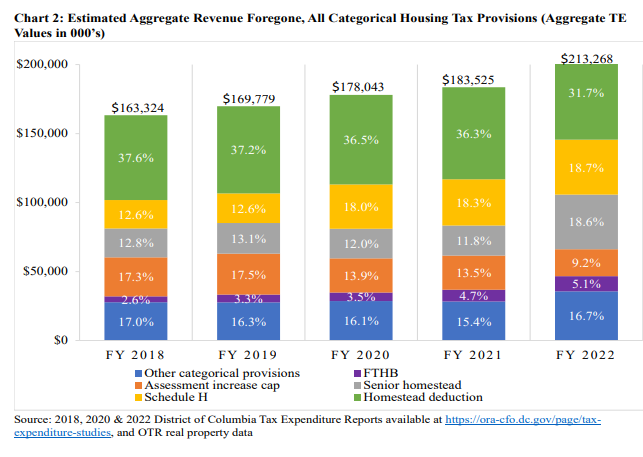
Did you know? In FY22, the Homestead Deduction was 31.7% of all categorical housing tax provisions taken? Learn more about the Homestead Deduction and other home provisions in DC from the Housing Expenditure Review Report: https://t.co/vNj0WlNyDd
#housing#policy#taxpolicy
Data nerds: need some Thanksgiving reading? Check out our latest DC Economic and Revenue Trends Review. It's a collection of data relevant to the DC economy that we update monthly. See our full collection of data here https://t.co/dKgIgFj2Wj
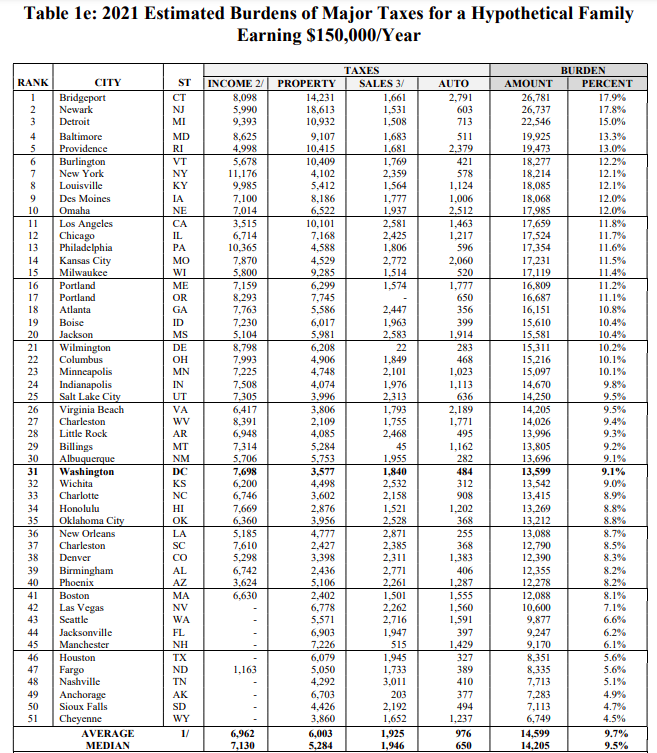
Our tax burden studies compare the taxes a family of three would pay in the largest city of every state and DC. We look at income, property, auto, and sales taxes combined and separately. Read more here: https://t.co/6IXatAu2T4
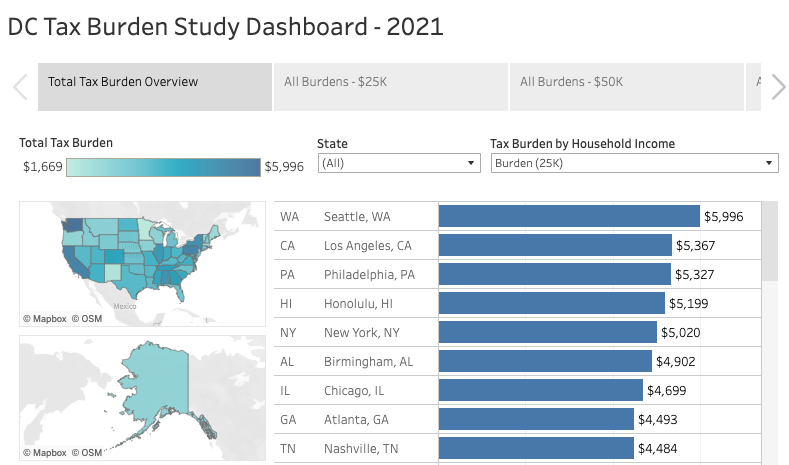
Check out our dashboard comparing the taxes a hypothetical family of 3 would pay in DC and the largest city in each of the 50 states. We look at income, property, sales, and auto taxes combined for household incomes of $25k, $50k, $75k, $100k, and $150k. https://t.co/6IXatAu2T4
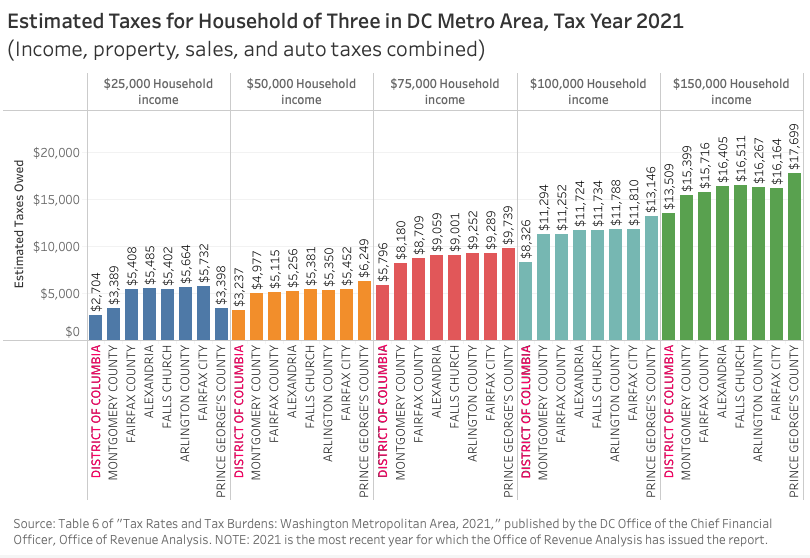
A family of three in DC making up to $150k will pay less in taxes (income, property, auto, and sales taxes combined) than in surrounding jurisdictions. Read our studies on how DC taxes compare to those in the DC metro area and all 50 states https://t.co/6IXatAu2T4
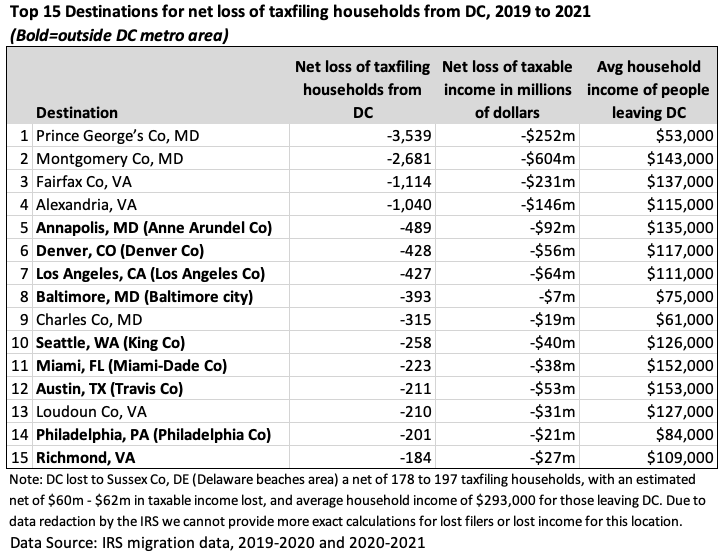
During the pandemic years DC lost about 16,000 taxfiling households, bringing with them $3B in income. Below are the top destinations of these migrants. Read more: https://t.co/fGG1ED6lLL
The man should have gotten Alzheimer’s disease in his early forties — he had a gene mutation that guaranteed it, or so it seemed. But another mutation helped him avoid the disease for decades. https://t.co/d5Cz5gUTwA