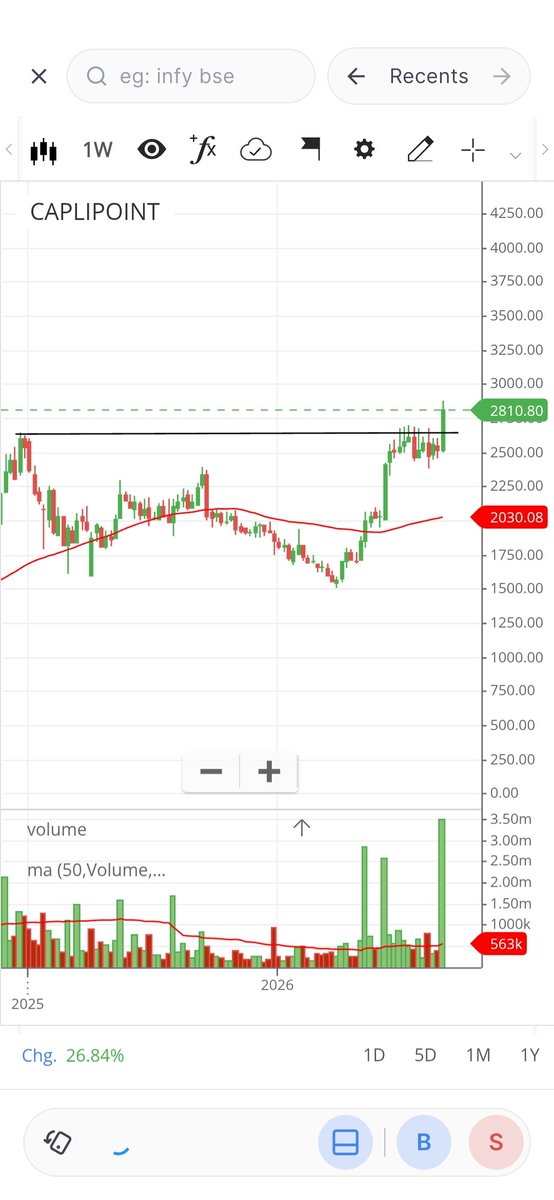
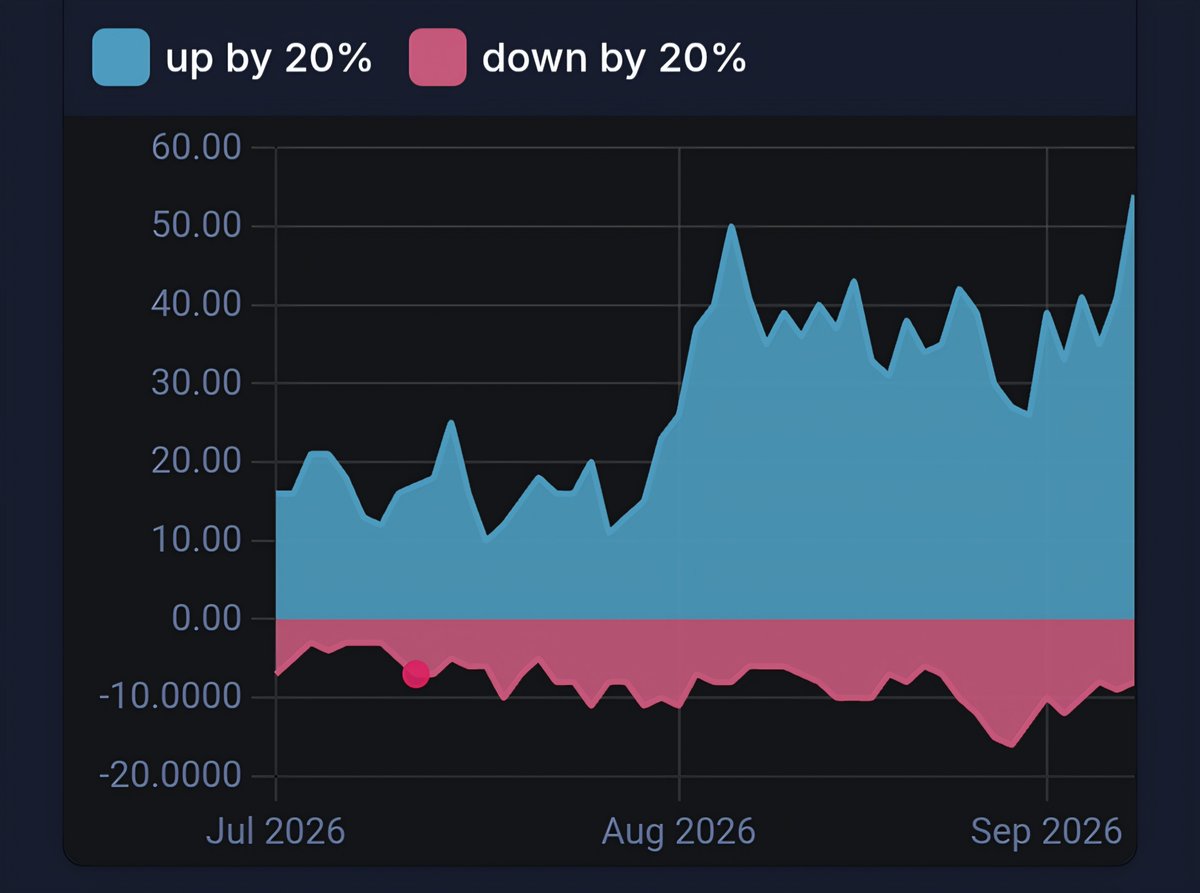
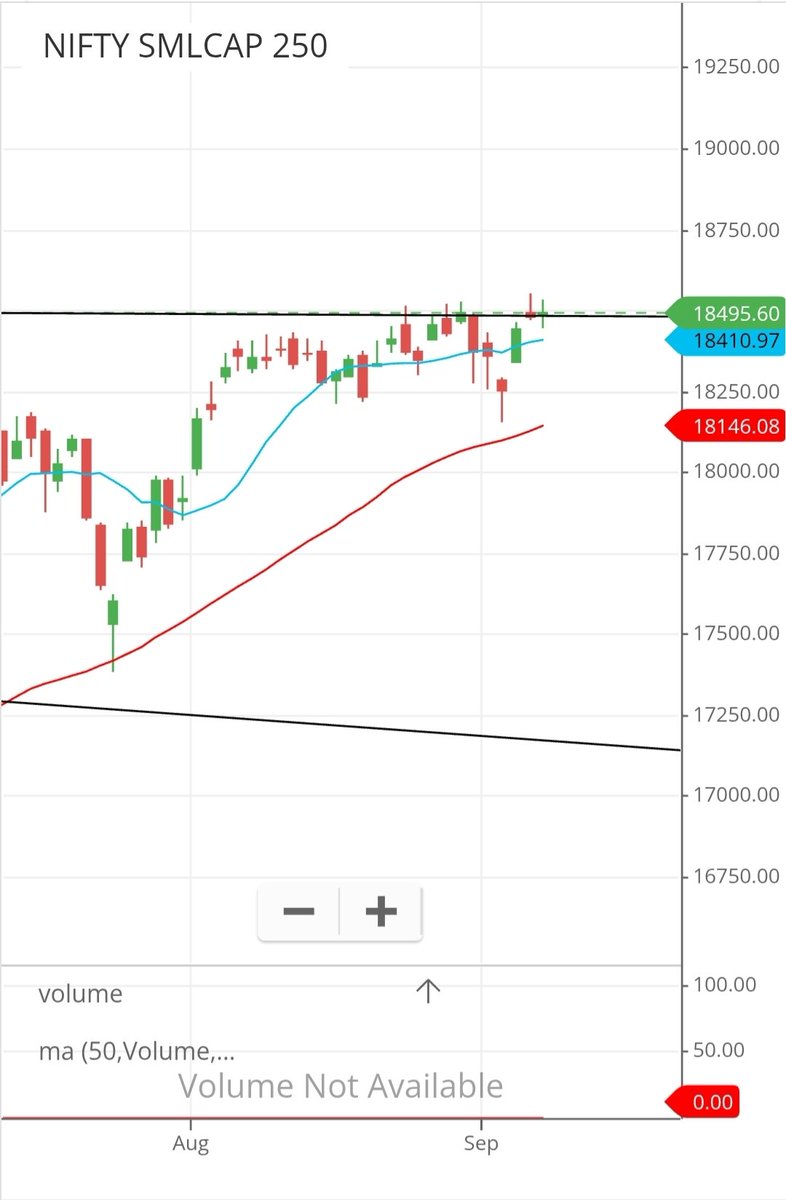
#nifty50 is trading at important support level 23600. If this level breaks then next support is at 23100 and then 22250. Where as small cap index is trading near ATH. Clear divergence between two index.
🔥 MARKET UPDATE | 8 SEPTEMBER 2026
Index may remain volatile, but stock-specific triggers are getting interesting 👇
🛡️ DEFENCE: India clears procurement proposals worth ₹1.10 LAKH CR 🔥
Radars, helicopters & other military systems in focus. Big long-term trigger for the domestic defence ecosystem.
⚡ GE VERNOVA T&D: Emerges L1 for massive 6,000 MW HVDC Power Grid project.
👉 Renewables ↑ → Transmission ↑ → Grid Capex ↑
⚡ ADANI POWER: Gets LoI to acquire GVK Energy, including a 330 MW hydro project in Uttarakhand.
🏗️ GARUDA CONSTRUCTION: MoU for estimated ₹1,800 Cr Saudi EPC opportunity involving a 93-storey Jeddah tower.
🏦 INSURANCE: Strong August numbers
🔥 LIC: +45.3% YoY
🟢 HDFC Life: +17.8%
🟢 ICICI Pru: +9.9%
💰 FII: Turned net buyers with ~₹280 Cr purchases — small but encouraging after recent selling.
💊 NEULAND LABS: Approves ₹126 Cr capex for future manufacturing expansion.
🚀 REC: Issues India's first pilot tokenised corporate bond under SEBI's Regulatory Sandbox.
⚠️ BIGGEST RISK: CRUDE >$97
Oil ↑ → Import Bill ↑ → INR Pressure ↑ → Inflation Risk ↑
🎯 MARKET VIEW
Rather than predicting every Nifty candle, follow where the CAPEX + BUSINESS TRIGGERS are coming:
🛡️ DEFENCE
⚡ POWER
🔌 TRANSMISSION
🏗️ INFRA
📌 In a volatile market, stocks showing:
Fresh Trigger 🔥 + Earnings 📊 + Relative Strength 📈 + Volume 🔊
deserve more attention.
If the INDEX is weak but the STOCK refuses to fall — keep it on your radar. 👀
⚠️ Educational purposes only. Not investment advice
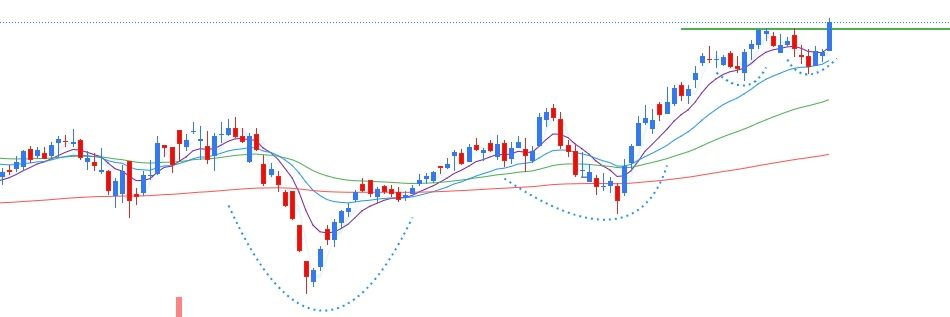
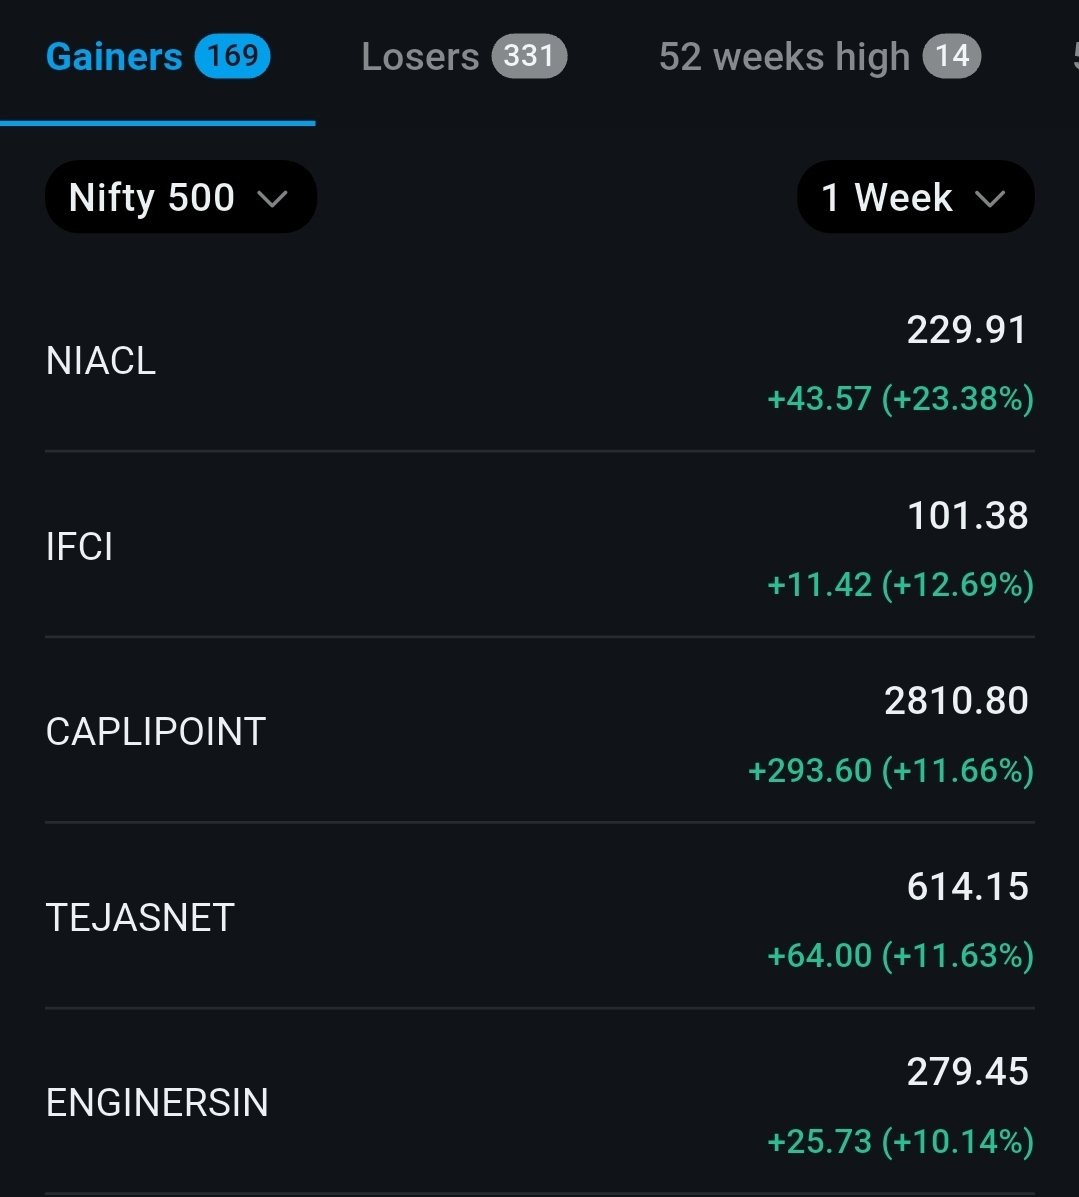
#ENGINERSIN trying to break multi-year pivot as well as trendline in such a weak market. Showing strength. Tight price action right side and the stock is near ATH. 👀
Smallcaps in USD terms are heavily coiled. If this flag resolves with a clean monthly breakout, historical cycle symmetry projects a target of 440.00 (+110.94%) heading into 2027–2028. Keep this macro chart on your radar. The waiting game might be nearing its end.📈#NiftySmallcap
@microcp2mltibgr It was in the range 10 to 40 $ for almost 30 years and then range expanded to 30 to 120 $. Next range expansion may be 90 to 270 $. The is pattern oil is playing.
🔥 Trading & Investing Become Much More Powerful When You Learn to Read Multiple Timeframes Together
Most beginners only focus on a single chart timeframe and miss the bigger picture
But in reality, smart investing and high-conviction trading happen when you understand the alignment between different timeframes of the same stock
✔️ So how should you actually study charts?
Before taking any investment or swing trading decision, I personally prefer checking at least 3 major timeframes to understand the complete trend structure.
📌 The 3 Important Timeframes:
👴 1) Monthly Chart → The Grandparents
This is where the long-term story is built
• Helps identify multiyear breakouts
• Shows secular trends and major accumulation zones
• Filters out short-term market noise
• Best for spotting wealth-creation opportunities early
👨 2) Weekly Chart → The Parents
This timeframe confirms whether the medium-term trend is healthy or not.
• Ideal for 1–2 year holding setups
• Helps track momentum continuation
• Shows important support/resistance structures
• Gives clarity on trend strength and sector leadership
👦 3) Daily Chart → The Child
This is where most swing trading entries and exits are planned
• Used for precise execution
• Helps identify breakouts, pullbacks and short-term momentum
• Gives proper risk-reward opportunities
But remember one important thing 👇
⚠️ A child cannot go against the parents and grandparents for too long
That is why I always check what the higher timeframes are doing before taking any short-term or long-term position
📈 Longer timeframes define the actual trend.
📉 Smaller timeframes only help in execution
This simple multi-timeframe approach can completely change the way you look at charts, investing and swing trading
Today’s market strength was textbook. This is exactly what markets do during corrections when they get stretched to oversold levels. As I said just recently, "some of the biggest rallies occur during bear markets and corrections." Today was a perfect example.
Traders rushed in after headlines hit that Iran’s president signaled a willingness to end the conflict with the U.S. The Dow exploded higher by 1,125 points. But let’s not confuse cause and effect. The news may have been the trigger, but the market was already set up for a rally. It was oversold and primed. Now comes the part where discipline matters.
We ignore the first few days of a rally attempt. That’s potential noise. What matters is whether the market can follow through and whether leadership begins to emerge and proper setups develop.
Technically, this is a classic snapback: Indexes that broke below the 200-day are rallying back toward it, while Indexes that held the 200-day are bouncing off it. That’s typical countertrend behavior until proven otherwise.
Expect volatility to remain elevated. That’s not where low-risk money is made, but it's certainly where the risk is. Your job during corrections is simple: identify the stocks showing the best relative strength and the tightest price action. Those are your future leaders when the market finally turns.
On the macro side, nothing has been resolved. Higher crude prices are still a problem. Yesterday’s rally did nothing to materially bring down oil. The bigger issue is still in play and the jury still out. Oil at these levels feeds inflation, pressures growth, and gives the Fed a reason to stay on hold longer. Yields stay elevated in that environment.
To cut through all the noise, I look to the market itself, which has a much better track record of telling us the truth than the politicians, the analysts, the news, and the gurus.
The four steps of the bottoming process are:
1. Oversold – The difference between an ordinary pullback and an oversold condition starts with price, but it does not end there. Poor breadth and and a lack of volume confirmed follow through describe a one-sided market, and one not to trust.
2. Rally – Inevitably, the market bounces from its oversold condition. A high-quality rally is broad-based. A low-quality rally is defined by short covering and driven primarily by the stocks that have declined the most. Again, the character of the rally is important to distinguish. So far, we simply don't have enough data to make a confident determination, so patience is the watch word while we wait.
3. Retest – After the rally, there is almost always a retest. The popular averages approach, and in some cases breach, their oversold lows. The key to a successful retest is less selling pressure, such as fewer stocks below their moving averages, fewer stocks, sectors, and markets making new lows, less total volume, and less downside volume. If the retest fails, the process reverts and we generally start looking for divergences during lower lows. In the event of unexpected news, it is possible for the market to recover in a "V" fashion with no retest. In that case, we look at breadth confirmation and participation.
4. Breadth thrusts – In the final phase, not only do benchmark indices rally sharply with few pullbacks, but they do so with an extremely high percentage of stocks, sectors, and markets participating, or what technical analysts call breadth thrusts. In rare cases, the market has skipped step 3. With strong enough breadth, retests are not necessary. The Covid bottom is an example of a pretty powerful V-shaped recovery.
Bottom line:
This was an oversold rally, sparked by headlines—but not defined by them, and certainly not confirmation of a reliable bottom.
Now we watch:
--Quality of follow-through
--Emergence of leadership
--Market internals and model health
If the rally lacks quality, if economic pressure builds, or if leading stocks begin to deteriorate, then this remains what it likely is—a rally within a correction.
Stay objective. Let the market prove itself. If you are going to trade, do so incrementally.
https://t.co/JXzFFTmMtn